. 2024 Jul 31;44(31):e2291232024.
doi: 10.1523/JNEUROSCI.2291-23.2024.

Characterization of Mice Carrying a Neurodevelopmental Disease-Associated GluN2B(L825V) Variant

Affiliations

Characterization of Mice Carrying a Neurodevelopmental Disease-Associated GluN2B(L825V) Variant

Miriam Candelas Serra et al. J Neurosci. .

Abstract

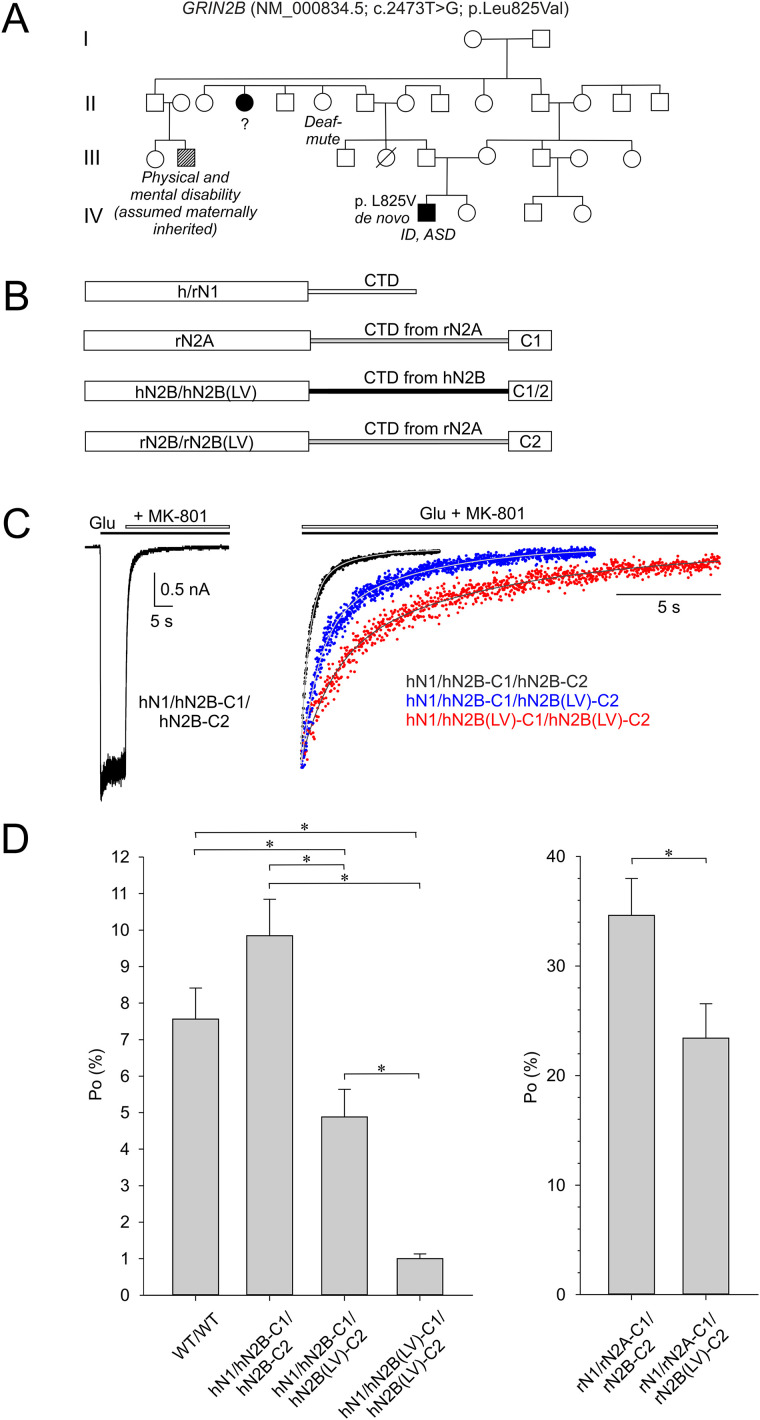
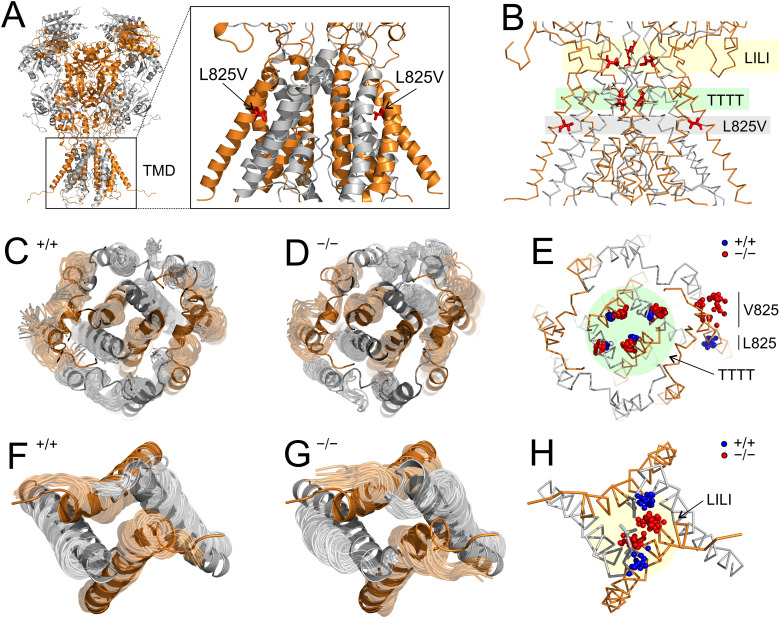
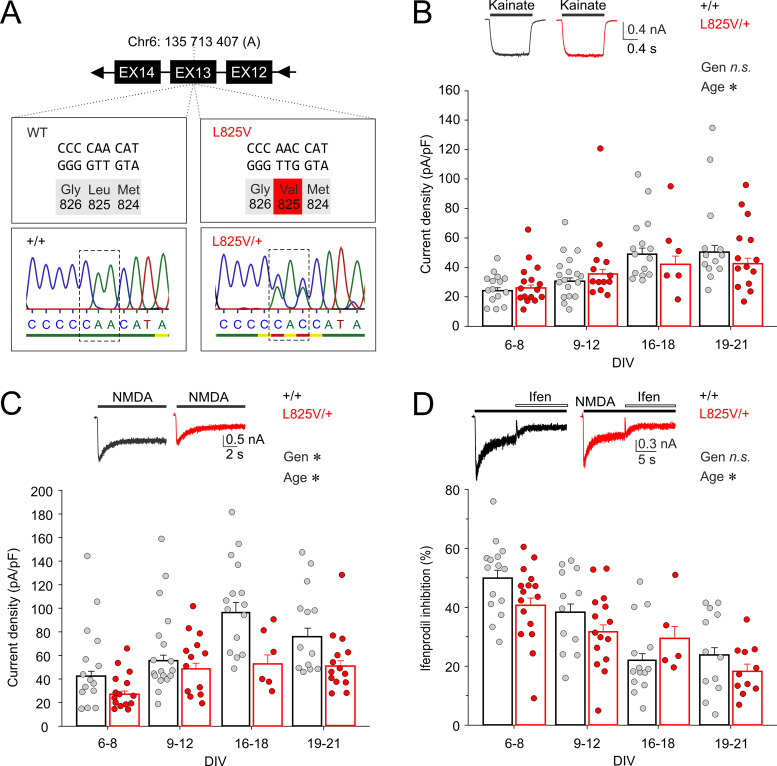
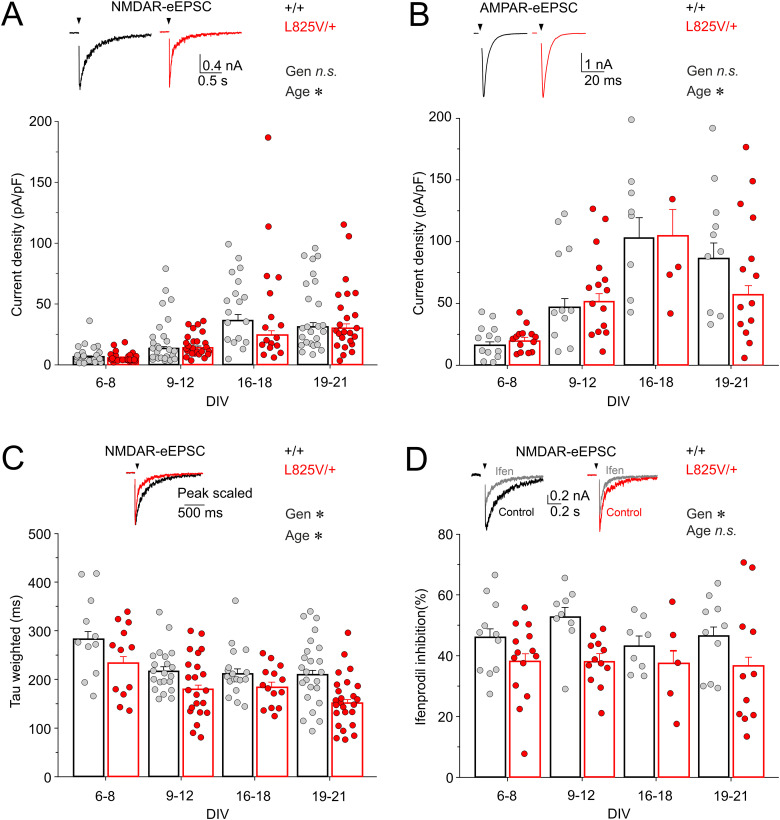
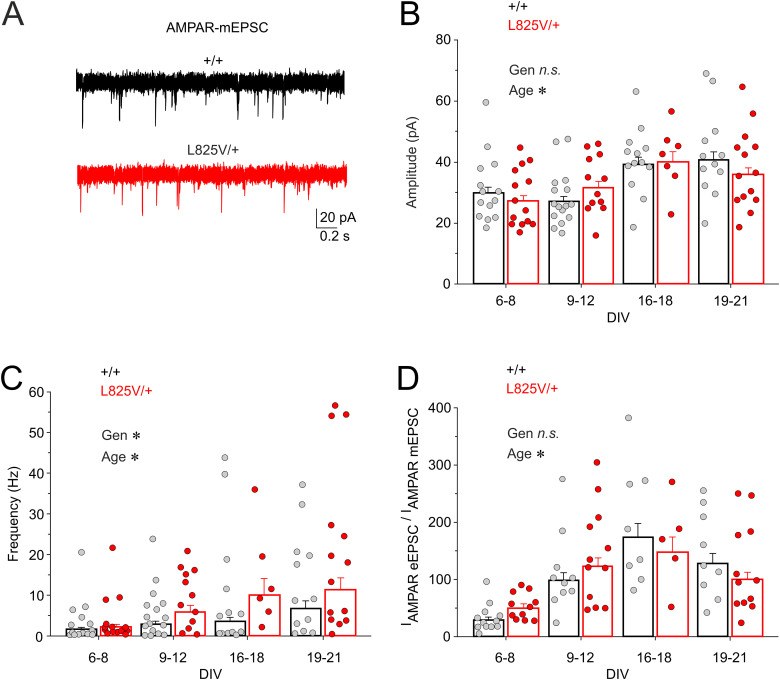
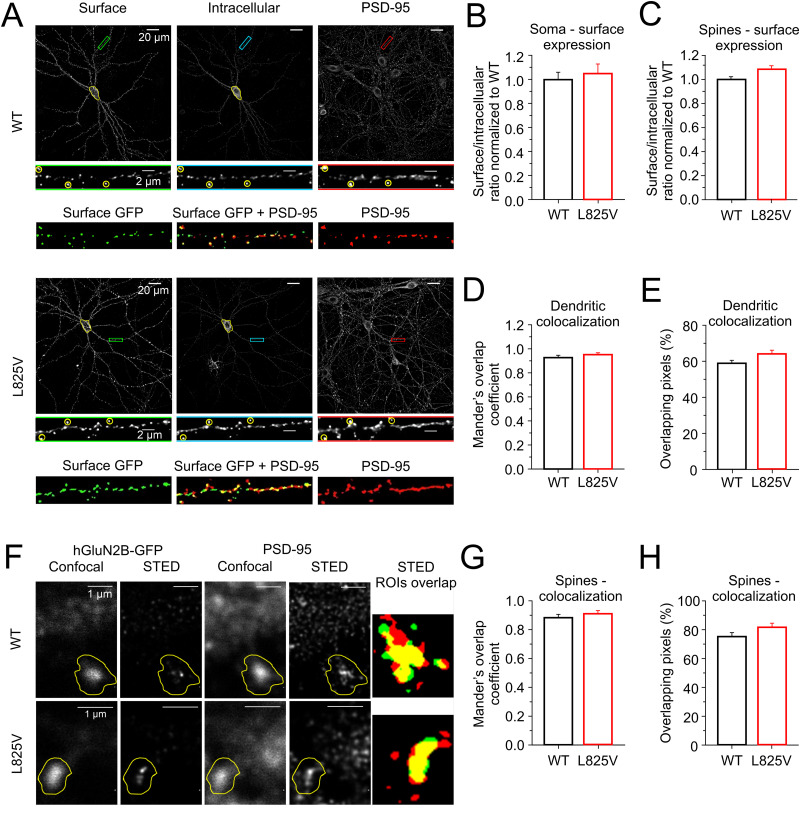
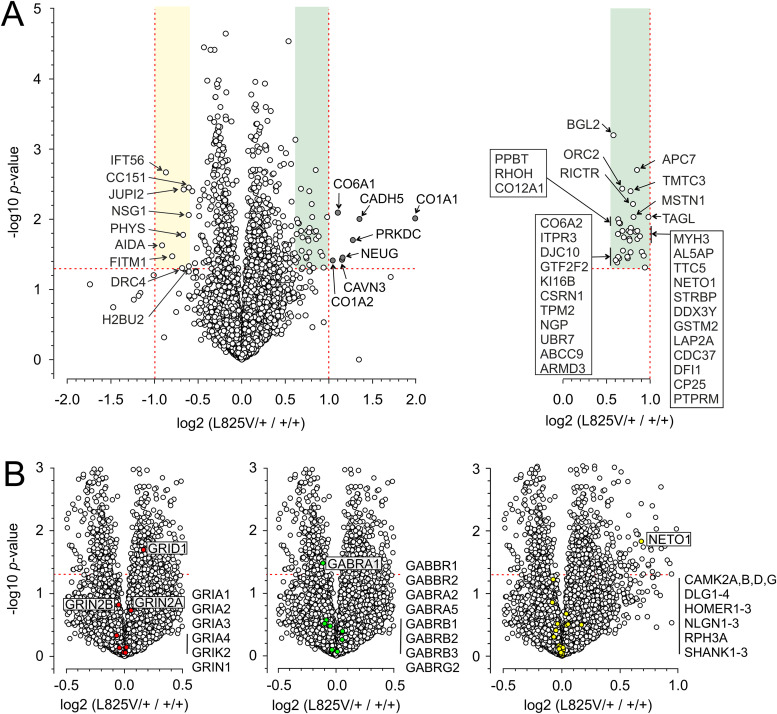
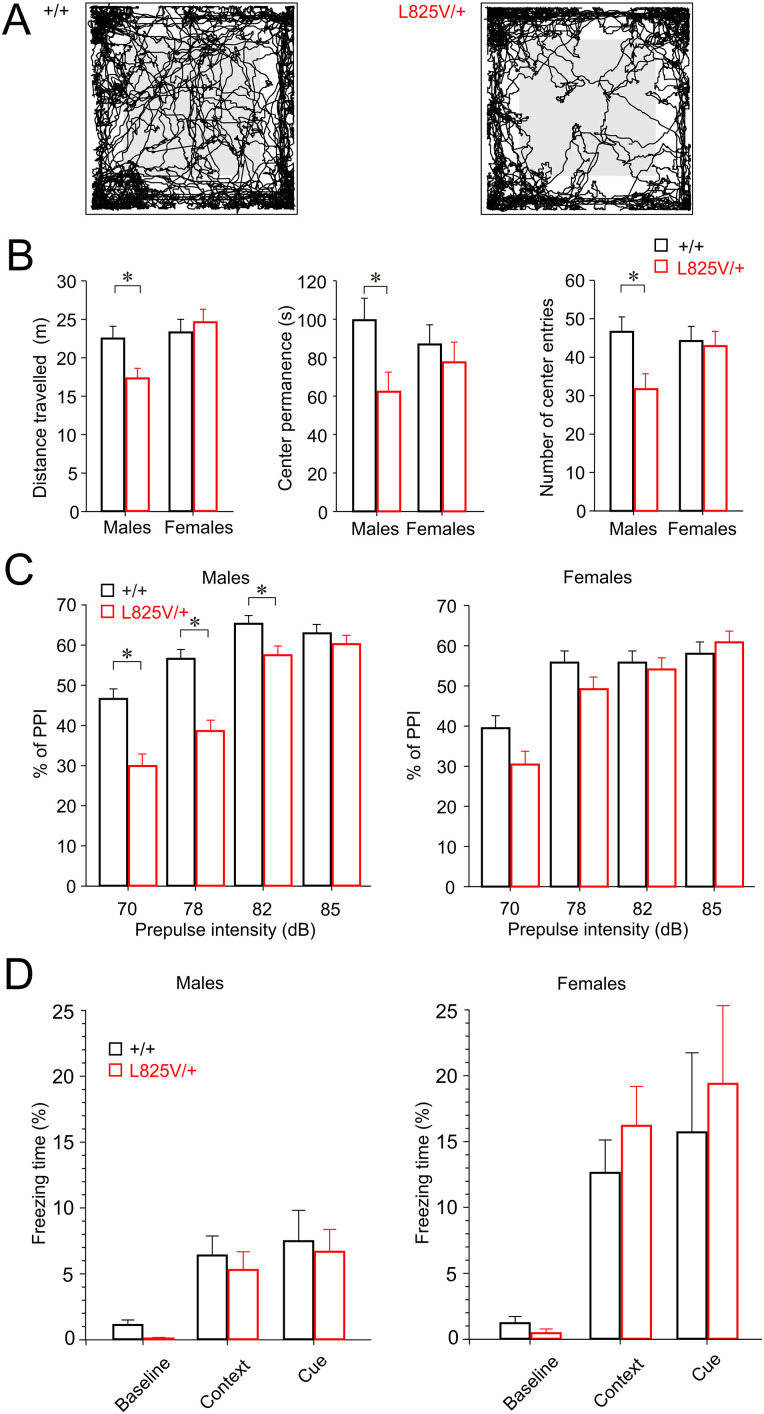
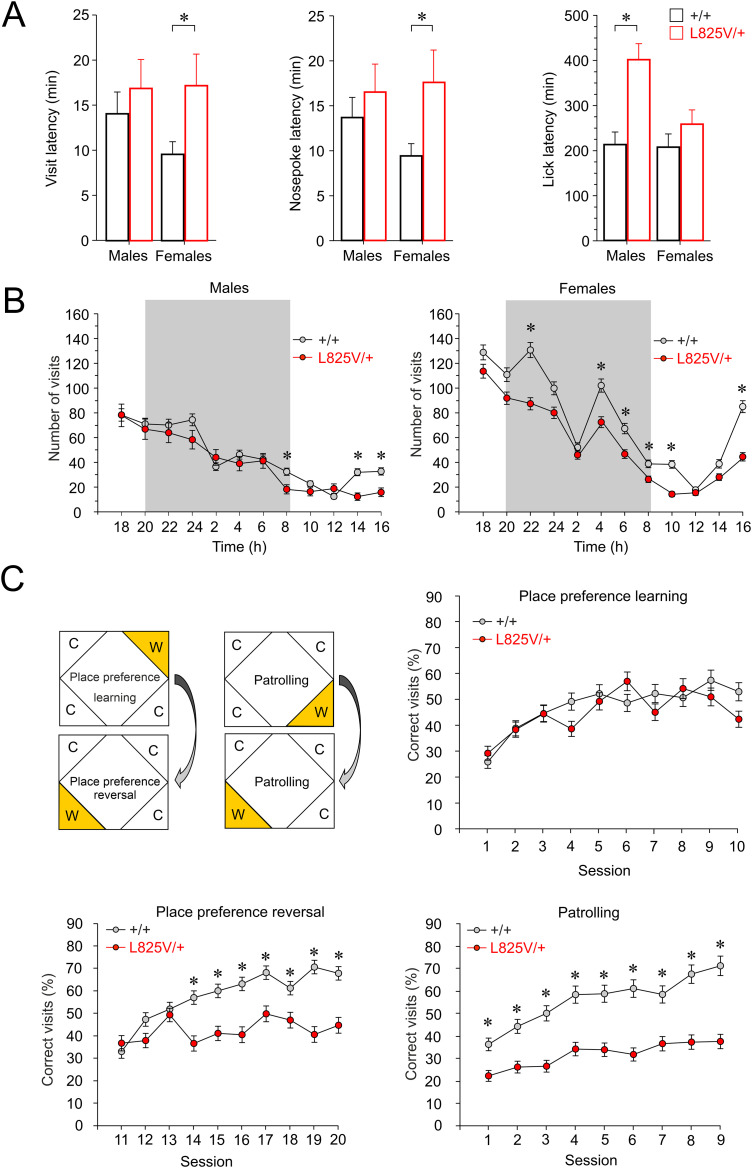
N-Methyl-d-aspartate receptors (NMDARs), encoded by GRIN genes, are ionotropic glutamate receptors playing a critical role in synaptic transmission, plasticity, and synapse development. Genome sequence analyses have identified variants in GRIN genes in patients with neurodevelopmental disorders, but the underlying disease mechanisms are not well understood. Here, we have created and evaluated a transgenic mouse line carrying a missense variant Grin2bL825V , corresponding to a de novo GRIN2B variant encoding GluN2B(L825V) found in a patient with intellectual disability (ID) and autism spectrum disorder (ASD). We used HEK293T cells expressing recombinant receptors and primary hippocampal neurons prepared from heterozygous Grin2bL825V/+ (L825V/+) and wild-type (WT) Grin2b+/+ (+/+) male and female mice to assess the functional impact of the variant. Whole-cell NMDAR currents were reduced in neurons from L825V/+ compared with +/+ mice. The peak amplitude of NMDAR-mediated evoked excitatory postsynaptic currents (NMDAR-eEPSCs) was unchanged, but NMDAR-eEPSCs in L825V/+ neurons had faster deactivation compared with +/+ neurons and were less sensitive to a GluN2B-selective antagonist ifenprodil. Together, these results suggest a decreased functional contribution of GluN2B subunits to synaptic NMDAR currents in hippocampal neurons from L825V/+ mice. The analysis of the GluN2B(L825V) subunit surface expression and synaptic localization revealed no differences compared with WT GluN2B. Behavioral testing of mice of both sexes demonstrated hypoactivity, anxiety, and impaired sensorimotor gating in the L825V/+ strain, particularly affecting males, as well as cognitive symptoms. The heterozygous L825V/+ mouse offers a clinically relevant model of GRIN2B-related ID/ASD, and our results suggest synaptic-level functional changes that may contribute to neurodevelopmental pathology.

Keywords: GluN2B; NMDA receptors; autism spectrum disorder; mouse model; synaptic transmission.


Conflict of interest statement

The authors declare no competing financial interests.

Figures

Figure 1.
Figure 1.
ID-/ASD-associated variant GluN2B(L825V) reduces Po in diheteromeric and triheteromeric NMDARs. A, Pedigree of the proband diagnosed with ID/ASD and identified to be a carrier of a de novo likely pathogenic mutation in GRIN2B (NM_000834.5; c.2473T>G; p.Leu825Val). B, Linear representations of the subunit polypeptide chains showing the CTD of GluN1 (white), the CTD of GluN2A (gray) tagged with C1, the CTD of GluN2B (black) tagged with C1 or C2, and a chimeric GluN2B subunit with its CTD replaced by the GluN2A CTD tagged with C2 [h and r stand for the human and the rat isoform, N1 for GluN1, N2A for GluN2A, N2B for GluN2B, and N2B(LV) for GluN2B(L825V)]. C, Left, typical response of hGluN1/hGluN2B-C1/hGluN2B-C2 receptors to the application of 1 mM glutamate in the continuous presence of 10 µM glycine, followed by the addition of 1 µM MK-801. Right, normalized current responses (indicated in dots) show the onset of MK-801 inhibition of responses to glutamate. The time course of the onset of MK-801 inhibition was best described by Po= 10.9% for hGluN1/hGluN2B-C1/hGluN2B-C2 (hN1/hN2B-C1/hN2B-C2) receptors (gray line), Po= 4.8% for hGluN1/hGluN2B-C1/hGluN2B(L285V)-C2 (hN1/hN2B-C1/hN2B(LV)-C2) receptors (blue line), and Po= 0.9% for hGluN1/hGluN2B(L825V)-C1/hGluN2B(L825V)-C2 (hN1/hN2B(LV)-C1/hN2B(LV)-C2) receptors (red line; see Materials and Methods for the details of the analysis procedure). D, Graphs show mean Po± SEM for hGluN1/hGluN2B without the C1 or C2 tags (WT/WT) and diheteromeric and triheteromeric NMDARs as indicated. * Marks significant differences. Data were power transformed and tested using ANOVA followed by pairwise comparisons using the Duncan method.
Figure 2.
Figure 2.
Summary of the L825V variant effects on the closed-state geometry of the NMDAR. A, The domain architecture of the GluN1(gray)/GluN2B(orange) receptor is shown in a crystal structure derived from the homology model with the L825V position in the TMD highlighted by red sticks. B, A schematic depiction of the positions of selected residues in the TMD. From the top are shown the auxiliary gating LILI (GluN2B I655 and GluN1 L657) residues with yellow background, the channel gating TTTT (GluN2B T647 and GluN1 T648) residues with green background, and the L825V positions with gray background. C, Top view at the TTTT level of the TMD showing an ensemble of MD snapshots representing closed-state structures of the human WT NMDAR (transparent) superimposed onto the initial crystal-like homology model (opaque). D, Top view at the TTTT level of the TMD showing an ensemble of MD snapshots representing closed-state structures of the human L825V NMDAR (transparent) superimposed onto the initial crystal-like homology model (opaque). E, Comparison of positions and mobility of the TTTT and L825/V825 residues summarizing data from panels C and D. The Cα atoms in the WT and variant receptor are shown as blue and red spheres, respectively. F, Top view at the LILI level of the TMD showing an ensemble of MD snapshots representing closed-state structures of the human WT NMDAR (transparent) superimposed onto the initial crystal-like homology model (opaque). G, Top view at the LILI level of the TMD showing an ensemble of MD snapshots representing closed-state structures of the human L825V NMDAR (transparent) superimposed onto the initial crystal-like homology model (opaque). H, Comparison of positions and mobility of the GluN1 L657 residues summarizing data from panels F and G. The Cα atoms in the WT and variant receptor are shown as blue and red spheres, respectively.
Figure 3.
Figure 3.
NMDAR but not AMPAR whole-cell currents are reduced in L825V/+ neurons. A, The position of the L825V variant within the mouse chromosome (chr6: 135 713 405–407) according to the GRCm39/mm39 assembly. Two bases T to G and G to T in the codon for leucine (TTG) were edited to create the new codon for valine (GTT). Two chromatograms show the results of Sanger sequencing of PCR amplicons of genomic DNA from +/+ and L825V/+ individuals containing the region of the L825V variant. B, C, Scatter plots show the current density distribution in individual hippocampal neurons by age in vitro; bar graphs show mean ± SEM for each genotype and age group. Currents were induced by 100 µM kainate (B) or 100 µM NMDA in the presence of 10 µM glycine (C). Insets show representative whole-cell responses evoked by kainate or NMDA in neurons prepared from +/+ (black) or L825V/+ (red) animals and cultured for 21 DIV. D, The scatter plot shows the distribution of ifenprodil (3 µM) inhibition of NMDA-evoked currents recorded in individual neurons by age in vitro; the bar graph shows mean ± SEM for each genotype and age group. Inset shows the effect of 3 µM ifenprodil on responses to 100 μM NMDA in neurons prepared from +/+ (black) or L825V/+ (red) animals cultured for 21 DIV. Data (obtained from n = 5–18 neurons from 3 to 7 animals per group) were power transformed and tested using ANOVA. * Indicates a significant difference with respect to Gen, genotype, and Age, age (DIV).
Figure 4.
Figure 4.
NMDAR-eEPSCs in L825V/+ neurons have faster deactivation and lower sensitivity to ifenprodil inhibition. Scatter plots show the distribution of peak current density of NMDAR-eEPSCs (A) and AMPAR-eEPSCs (B) recorded from individual +/+ (gray symbols) or L825V/+ (red symbols) neurons by age in vitro; bar graphs show mean ± SEM for each genotype and age group. Insets show representative eEPSCs recorded from +/+ (black) and L825V/+ (red) neurons at 7 and 8 DIV, respectively, for NMDAR-eEPSCs, and at 7 and 11 DIV, respectively, for AMPAR-eEPSCs. C, The scatter plot shows the distribution of weighted deactivation time constants (tau weighted) of NMDAR-eEPSCs recorded from individual +/+ or L825V/+ neurons by age in vitro; the bar graph shows mean ± SEM for each genotype and age group. Inset shows scaled NMDAR-eEPSCs from a +/+ (black, 7 DIV) and a L825V/+ neuron (red, 8 DIV). D, The scatter plot shows the distribution of ifenprodil (3 µM) inhibition of peak NMDAR-eEPSCs recorded in individual neurons by age in vitro; the bar graph shows mean ± SEM for each genotype and age group. Inset shows control NMDAR-eEPSCs and the effect of 3 µM ifenprodil (shown in gray) recorded from a +/+ (black) and L825V/+ (red) neuron cultured for 7 and 8 DIV, respectively. Data (obtained from n = 5–26 neurons from 3 to 13 animals per group) were power transformed and tested using ANOVA. * Indicates a significant difference with respect to Gen, genotype, and Age, age (DIV).
Figure 5.
Figure 5.
Properties of AMPAR-mEPSCs in +/+ and L825V/+ neurons. A, Representative recording of AMPAR-mEPSCs from single-neuron microisland cultures prepared from +/+ or L825V/+ animals and maintained for 21 DIV. B, The scatter plot shows the distribution of mean AMPAR-mEPSC current amplitudes recorded from individual +/+ and L825V/+ autaptic neurons (each point represents mean AMPAR-mEPSC amplitude from a 2 min recording period) by age in vitro; the bar graph shows mean ± SEM for each genotype and age group. C, The scatter plot shows the distribution of AMPA-mEPSC frequency recorded from individual +/+ and L825V/+ autaptic neurons by age in vitro; the bar graph shows mean ± SEM for each genotype and age group. D, The scatter plot shows the distribution of the ratio of peak AMPAR-eEPSC current amplitude and mean AMPAR-mEPSC current amplitudes recorded from individual +/+ and L825V/+ neurons by age in vitro; the bar graph shows mean ± SEM for each genotype and age group. Data (obtained from n = 5–16 neurons from 3 to 7 animals per group) were power transformed and tested using ANOVA. * indicates a significant difference with respect to Gen, genotype, and Age, age (DIV).
Figure 6.
Figure 6.
Cell surface expression and synaptic localization of NMDARs containing the eGFP-hGluN2B WT or eGFP-hGluN2B(L825V) subunit. A, Representative images (maximum intensity projection) of mouse hippocampal neurons (14 DIV) showing surface and intracellular immunostaining for WT or L825V eGFP-hGluN2B subunits and total immunostaining for PSD-95. The area highlighted in yellow indicates the soma of the neuron. Green, blue, and red rectangles indicate secondary dendrites and are also shown below at a higher magnification (highlighted areas show examples of dendritic spines used for analysis). The bottom row shows thresholded surface receptors (green) and PSD-95 (red) with their composite image used to calculate the overlap of surface receptors with PSD-95. B, C, Summary of the relative cell surface expression of NMDARs containing WT or L825V eGFP-hGluN2B measured at the soma (B) and in dendritic spines (C), both expressed as the ratio of surface/intracellular fluorescence intensity normalized to WT. D, E, Summary of the colocalization analysis of dendritic surface WT or L825V eGFP-hGluN2B with PSD-95 assessed by Mander's overlap coefficient (D) and by the percentage of overlapping pixels (E). F, Representative images of dendritic spines showing immunostaining for WT or L825V eGFP-hGluN2B and for PSD-95 by confocal and super-resolution STED microscopy. The areas marked in yellow indicate ROIs used in the colocalization analysis. Color images on the right show the overlap of STED deconvolved ROIs after Huang segmentation between eGFP-hGluN2B (green) and PSD-95 (red) labeling. G, Summary of the colocalization analysis of WT or L825V eGFP-hGluN2B with PSD-95 assessed by Mander's overlap coefficient. H, Summary of the colocalization analysis determined as the percentage of pixels of surface WT or L825V eGFP-hGluN2B labeling overlapping with PSD-95. The summary data are presented as the mean ± SEM; for B–E, n = 22–40 neurons from 4 to 10 cultures; for G, H, n = 15–17 neurons from two cultures. No significant differences were found between WT and L825V eGFP-hGluN2B data shown in B–E and G and H.
Figure 7.
Figure 7.
Analysis of protein levels in +/+ and L825V/+ mouse hippocampus. A, The volcano plot showing proteomics data. The abscissa displays negative (downregulated) and positive (upregulated) fold changes in the ratio of the protein levels found in the hippocampi of L825V/+ relative to +/+ mice. The statistical significance (-log of p-values) is indicated on the ordinate. The dashed horizontal line shows the p-value of 0.05 cutoff, and the two vertical dashed lines indicate twofold down-/upregulation of the protein level. The gray symbols show proteins expressed significantly (p < 0.05) more (greater than twofold) in the hippocampi of L825V/+ compared with +/+ mice. The area highlighted in green in A is also shown on the right with individual detected proteins labeled. B, The same data as in A; highlighted in red are the AMPAR, kainate receptor, and NMDAR subunits; highlighted in green are the GABAAR subunits; highlighted in yellow are the selected synaptic proteins.
Figure 8.
Figure 8.
Adult L825V/+ mice display sex-dependent hypoactivity, anxiety, and impaired sensorimotor gating, preferentially affecting males. A, Representative locomotion track traces of +/+ and L825V/+ mice in the open-field test. B, Quantification of the total distance traveled, center permanence, and the number of center entries. C, Quantification of the % inhibition of the startle response as a function of prepulse intensity. D, Freezing time (%) in response to context or cue (contextual or cued fear conditioning test). Data [obtained from n = 10–12 animals (from 5 to 7 litters) per group] are presented as mean ± SEM and were analyzed by ANOVA followed by post hoc tests using the LSD method. * Indicates a significant genotype difference.
Figure 9.
Figure 9.
Behavioral phenotyping of L825V/+ mice in the IntelliCage system. A, First visit, nosepoke, and lick attempt latency at the corner chambers after introducing animals to the IntelliCage. B, The number of visits during the initial free adaptation phase lasting 4 consecutive days (all corners had doors open and mice had free access to water). C, Trial design for the different behavioral tasks: C, unconditionally closed; W, water available at the designated corner during the drinking sessions (21:00–23:00 and 3:00–5:00). Graphs show learning performance in the place preference, place preference reversal, and patrolling tests. Each plot represents the session score based on the proportions of visits to the correct corner (in %). Data [obtained from n = 9–10 animals (from 4 to 7 litters) per group] are presented as mean ± SEM and were analyzed by ANOVA followed by post hoc tests using the LSD method. * Indicates a significant genotype difference.

Similar articles

Cited by

References

    1. Akashi K, Kakizaki T, Kamiya H, Fukaya M, Yamasaki M, Abe M, Natsume R, Watanabe M, Sakimura K (2009) NMDA receptor GluN2B (GluR epsilon 2/NR2B) subunit is crucial for channel function, postsynaptic macromolecular organization, and actin cytoskeleton at hippocampal CA3 synapses. J Neurosci 29:10869–10882. 10.1523/JNEUROSCI.5531-08.2009 - DOI - PMC - PubMed
    1. Al-Hallaq RA, Conrads TP, Veenstra TD, Wenthold RJ (2007) NMDA di-heteromeric receptor populations and associated proteins in rat hippocampus. J Neurosci 27:8334–8343. 10.1523/JNEUROSCI.2155-07.2007 - DOI - PMC - PubMed
    1. Alvarez VA, Ridenour DA, Sabatini BL (2007) Distinct structural and ionotropic roles of NMDA receptors in controlling spine and synapse stability. J Neurosci 27:7365–7376. 10.1523/JNEUROSCI.0956-07.2007 - DOI - PMC - PubMed
    1. Amin JB, Leng X, Gochman A, Zhou HX, Wollmuth LP (2018) A conserved glycine harboring disease-associated mutations permits NMDA receptor slow deactivation and high Ca(2+) permeability. Nat Commun 9:3748. 10.1038/s41467-018-06145-w - DOI - PMC - PubMed
    1. Amin JB, Moody GR, Wollmuth LP (2021) From bedside-to-bench: what disease-associated variants are teaching us about the NMDA receptor. J Physiol 599:397–416. 10.1113/JP278705 - DOI - PMC - PubMed

Substances

LinkOut - more resources