. 2024 Jun 26;12(6):e009082.
doi: 10.1136/jitc-2024-009082.

Tumor cell-released autophagosomes (TRAPs) induce PD-L1-decorated NETs that suppress T-cell function to promote breast cancer pulmonary metastasis

Affiliations

Tumor cell-released autophagosomes (TRAPs) induce PD-L1-decorated NETs that suppress T-cell function to promote breast cancer pulmonary metastasis

Xiaohe Zhou et al. J Immunother Cancer. .

Abstract

Background: Lung metastasis is the primary cause of breast cancer-related mortality. Neutrophil extracellular traps (NETs) are involved in the progression of breast cancer. However, the mechanism of NET formation is not fully understood. This study posits that tumor cell-released autophagosomes (TRAPs) play a crucial role in this process.

Methods: TRAPs were isolated from breast cancer cell lines to analyze their impact on NET formation in both human and mouse neutrophils. The study used both in vitro and in vivo models, including Toll-like receptor 4 (TLR4-/-) mice and engineered breast cancer cell lines. Immunofluorescence, ELISA, Western blotting, RNA sequencing, and flow cytometry were employed to dissect the signaling pathways leading to NET production and to explore their immunosuppressive effects, particularly focusing on the impact of NETs on T-cell function. The therapeutic potential of targeting TRAP-induced NETs and their immunosuppressive functions was evaluated using DNase I and αPD-L1 antibodies. Clinical relevance was assessed by correlating circulating levels of TRAPs and NETs with lung metastasis in patients with breast cancer.

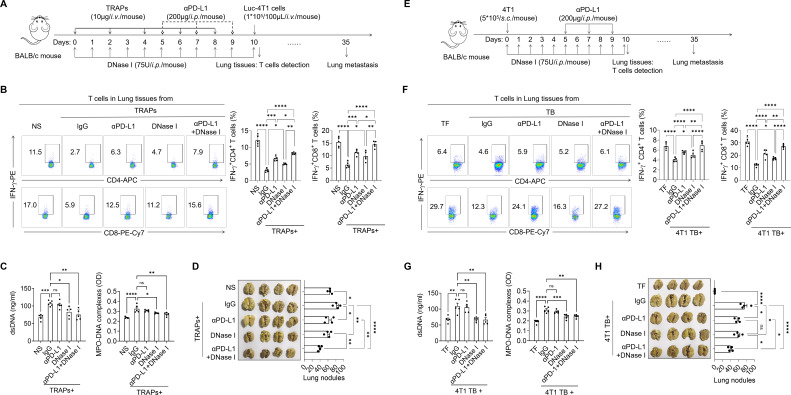
Results: This study showed that TRAPs induced the formation of NETs in both human and mouse neutrophils by using the high mobility group box 1 and activating the TLR4-Myd88-ERK/p38 signaling axis. More importantly, PD-L1 carried by TRAP-induced NETs inhibited T-cell function in vitro and in vivo, thereby contributing to the formation of lung premetastatic niche (PMN) immunosuppression. In contrast, Becn1 KD-4T1 breast tumors with decreased circulating TRAPs in vivo reduced the formation of NETs, which in turn attenuated the immunosuppressive effects in PMN and resulted in a reduction of breast cancer pulmonary metastasis in murine models. Moreover, treatment with αPD-L1 in combination with DNase I that degraded NETs restored T-cell function and significantly reduced tumor metastasis. TRAP levels in the peripheral blood positively correlated with NET levels and lung metastasis in patients with breast cancer.

Conclusions: Our results demonstrate a novel role of TRAPs in the formation of PD-L1-decorated NETs, which may provide a new strategy for early detection and treatment of pulmonary metastasis in patients with breast cancer.

Keywords: Breast Cancer; Immune modulatory; Neutrophil.


Conflict of interest statement

Competing interests: None declared.

Figures

Figure 1
Figure 1. Tumor cell-released autophagosomes (TRAPs) induce neutrophil extracellular trap (NET) formation and enhance the pulmonary metastasis of breast cancer. (A) Establishment of a tumor-bearing mouse model with reduced TRAP release. Experimental groups included the TF, Becn1 NC (negative control), Becn1 KD (knockdown), and Becn1 KD+TRAPs groups. (B) Plasma levels of dsDNA and myeloperoxidase-DNA (MPO-DNA) complexes were measured in the four groups on day 10. (C,D) Immunofluorescence staining for DNA (blue), MPO (green), and H3Cit (red) in lung tissues from each group. (E) Representative images of pulmonary surface nodules on day 35 (n=5 mice/group). (F) Schematic overview of the TRAP tail vein injection mouse model (n=5). Mice received intravenous 4T1-TRAP injections every 2 days for a total of five injections. (G,H) Immunofluorescence staining for DNA (blue), MPO (green), and H3Cit (red) in lung tissues from the TRAP and control groups on day 10. (I) Plasma levels of dsDNA and MPO-DNA complexes were measured on day 10. (J) Western blot analysis of H3Cit protein levels in lung tissues from the TRAP and control groups on day 10. (K,L) Lung colonization was analyzed following the intravenous injection of Luc-4T1 cells. Representative bioluminescence imaging (BLI) (K) and images of pulmonary surface nodules (L) are shown for day 35 (n=5 mice/group). Data (mean±SEM) represent three independent experiments (*p< 0.05; **p< 0.01; ***p< 0.001; ****p< 0.0001; NS, not significant).
Figure 2
Figure 2. Tumor cell-released autophagosomes (TRAPs) can induce human and mouse neutrophils to form neutrophil extracellular traps (NETs) in vitro. (A,F) The purity of neutrophils obtained from human peripheral blood and mouse bone marrow was analyzed by FCM. (B,G) The purity of neutrophils obtained from human peripheral blood and mouse bone marrow by Wright-Giemsa staining. (C,H) Human and mouse neutrophils were treated with phorbol 12-myristate 13-acetate (PMA) (100 nM), TRAPs derived from the human MDA-MB-231 breast cancer cell line (10 µg/mL), or TRAPs from the mouse 4T1 breast cancer cell line (10 µg/mL) for 3 hours. The morphology of NETs was observed using a scanning electron microscope (SEM). (D,I) Human neutrophils were treated with PMA or MDA-MB-231-TRAPs in the presence or absence of a PAD4 inhibitor (GSK484, 10 µM) or DNase I (10 U) for 3 hours. Mouse neutrophils received similar treatments, except that they were stimulated with 4T1-TRAPs. Representative immunofluorescence costaining images of DNA (blue), H3Cit (red), NE (green), or MPO (green) were used to assess NET formation. (E,J) Quantification of NETs was performed by detecting the content of dsDNA and MPO-DNA complexes in the post-treatment supernatants of cultured human and mouse neutrophils. Data (mean±SEM) represent at least three independent experiments (*p< 0.05; **p< 0.01; ***p< 0.001; ****p< 0.0001). FCM: Flow Cytometry.
Figure 3
Figure 3. Tumor cell-released autophagosomes (TRAPs) induce neutrophil extracellular trap (NET) formation via the HMGB1-TLR4-Myd88-ERK/p38 signaling pathway. (A,B) Mouse neutrophils were stimulated with protease K, or ultrasonically treated TRAPs for 3 hours. (A) NETs were examined for DNA (DAPI and SYTOX Green) by fluorescence microscopy, and (B) the levels of dsDNA and myeloperoxidase-DNA (MPO-DNA) complexes in culture supernatants were detected by ELISA. (C) TRAPs pretreated with or without α-HSP27, α-HSP60, α-HSP70, α-HSP90, or α-HMGB1 blocking antibodies, were used to stimulate mouse neutrophils for 3 hours, and then dsDNA and MPO-DNA complexes were detected in culture supernatants. (D,E) Mouse neutrophils were subjected to TRAPHmgb1 KD or TRAPHmgb1 NC treatment for 3 hours, (D) NETs were identified by DNA (DAPI and SYTOX Green) by fluorescence microscopy, (E) and the levels of dsDNA and MPO-DNA complexes were detected in culture supernatants. (F) Schematic overview of the mouse tail vein injection with NS, TRAPHmgb1 KD, or TRAPHmgb1 NC. (G) Levels of dsDNA and MPO-DNA complexes in the plasma of mice were detected. (H,I) Representative images of immunofluorescence staining for DNA (blue), MPO (green), and H3Cit (red) in lung tissues on day 10. (J,K) Neutrophils pretreated with described inhibitor, or solvent control (DMSO) solutions for 2 hours, were then stimulated with TRAPs for 3 hours. (J) NETs were examined for DNA (DAPI and SYTOX Green) by fluorescence microscopy, and (K) culture supernatants were collected to detect dsDNA and MPO-DNA complexes. (L) Neutrophils from control and TLR4-knockout mice were stimulated with TRAPs for 3 hours, and the levels of dsDNA and MPO-DNA complexes in the culture supernatants were detected. (M) Western blotting analyses of ERK and p38 protein phosphorylation in neutrophils treated with TRAPs at different time points. (N) Neutrophils pretreated with ERK and p38 pathway inhibitors for 1 hour were stimulated with TRAPs for 3 hours, and the levels of dsDNA and MPO-DNA complexes in the culture supernatants were determined. (O) Western blotting analysis of ERK and p38 protein phosphorylation in neutrophils treated with TRAPHmgb1 KD and TRAPHmgb1 NC. (P) Neutrophils pretreated with described inhibitors for 2 hours were then stimulated with TRAPs for 1 hour. Western blotting was used to detect the phosphorylation of ERK and P38 proteins. Data (mean±SEM) represent three independent experiments (*p< 0.05; **p< 0.01; ***p< 0.001; ****p< 0.0001; NS, not significant).
Figure 4
Figure 4. Tumor cell-released autophagosom (TRAP)-induced NETs inhibit T-cell function in a PD-L1-dependent manner. (A) RNA sequencing revealed the functional enrichment of differentially expressed genes in human peripheral blood neutrophils treated with or without MDA-MB-231-TRAPs (10 µg/mL) for 3 hours. (B) The heat map illustrates the genes differentially expressed between TRAP-treated and untreated neutrophils. (C) H3Cit and PD-L1 of TRAPPD-L1 NC and TRAPPD-L1 KD -stimulated mouse neutrophils for 6 hour were detected by FCM. (D) DNA (blue), H3Cit (red), MPO (green), and PD-L1 (orange) of TRAPPD-L1 NC and TRAPPD-L1 KD -stimulated mouse neutrophils for 6 hours were detected by immunofluorescence staining. (E) Representative images of immunofluorescence staining for DNA (blue), Ly6G (green), H3Cit (red), and PD-L1 (orange) in the lung tissues of mice after the tail vein injection of TRAPs. (F) Typical scanning electron microscope images of cell-free NETs isolated from TRAP-stimulated mouse neutrophils. (G) SEM images of cell-free NETs and coincubated T-cells. (H–K) TRAP-induced NETs were purified and incubated with either αPD-L1, DNase I, or αPD-L1 plus DNase I, and then cocultured with mouse splenocytes in the presence of anti-CD3/CD28 for 48 hours. The IFN-γ and Ki67 percentage of CD4+ and CD8+ T cells was detected by FCM. Data (mean±SEM) represent at least three independent experiments (*p< 0.05; **p< 0.01; ***p< 0.001; ****p< 0.0001; NS, not significant). FCM: Flow Cytometry.
Figure 5
Figure 5. αPD-L1 combined with DNase I can attenuate tumor cell-released autophagosome (TRAP)-induced neutrophil extracellular traps (NETs)-mediated immunosuppression against T cells in vivo. (A,E) An experimental schematic detailing the establishment of the mouse model. (B,F) Lung-infiltrating lymphocytes were stimulated with the protein transport inhibitor, and intracellular IFN-γ expression in CD4+ and CD8+ T cells was analyzed by FCM. (C,G) Levels of plasma dsDNA and MPO-DNA complexes in the five groups were measured on day 10. (D,H) Luc-4T1 cells were injected intravenously for lung colonization analysis, with representative images of pulmonary surface nodules displayed on day 35. Data (mean±SEM) represent three independent experiments (*p< 0.05; **p< 0.01; ***p< 0.001; ****p< 0.0001; NS, not significant). MPO, myeloperoxidase. FCM: Flow Cytometry.
Figure 6
Figure 6. Circulating levels of tumor cell-released autophagosome (TRAP) and neutrophil extracellular trap (NET) are correlated with lung metastasis of patients with breast cancer (BC). (A,B) The number of TRAPs in healthy donors (HDs, n=42) and BC (n=105) patients with different stages of disease (A). Comparison of TRAPs between patients with BC without metastasis (n=78) and those with lung metastasis (n=27) (B). (C,D) HMGB1 mean fluorescence intensity (MFI) on TRAPs was compared between HDs and patients with BC at various stages I, and between patients with BC without metastasis and those with lung metastasis (D). (E,F) Plasma levels of MPO-DNA were compared between HDs and patients with BC at different stages I, and between patients with BC without metastasis and those with lung metastasis (F). (G,H) Correlations between peripheral blood TRAP levels and surface HMGB1 MFI (G) and MPO-DNA (H) in 105 patients with BC. (I–O) Receiver operating characteristic (ROC) curves for TRAPs (I), HMGB1 MFI on TRAPs (J), MPO-DNA (K), the combination of TRAPs and HMGB1 MFI on TRAPs (L), the combination of TRAPs and MPO-DNA (M), the combination of HMGB1 MFI on TRAPs and MPO-DNA (N), and the combination of all three (TRAPs, HMGB1 MFI on TRAPs, and MPO-DNA) (O). Data (mean±SEM) represent three independent experiments (*p< 0.05; **p< 0.01; ***p< 0.001; ****p< 0.0001; NS, not significant). MPO, myeloperoxidase.
Figure 7
Figure 7. Schematic showing that TRAPs induce the release of PD-L1-decorated NETs, which suppress T-cell function to promote breast cancer pulmonary metastasis. NETS, neutrophil extracellular traps; TRAPs, tumor cell-released autophagosomes.

References

    1. Loibl S, Poortmans P, Morrow M, et al. Breast cancer. Lancet. 2021;397:1750–69. doi: 10.1016/S0140-6736(20)32381-3. - DOI - PubMed
    1. Akhtar M, Haider A, Rashid S, et al. “Paget’s "seed and soil" theory of cancer metastasis: an idea whose time has come”. Adv Anat Pathol. 2019;26:69–74. doi: 10.1097/PAP.0000000000000219. - DOI - PubMed
    1. de Groot AE, Roy S, Brown JS, et al. Revisiting seed and soil: examining the primary tumor and cancer cell foraging in metastasis. Mol Cancer Res. 2017;15:361–70. doi: 10.1158/1541-7786.MCR-16-0436. - DOI - PMC - PubMed
    1. Liu Q, Zhang H, Jiang X, et al. “Factors involved in cancer metastasis: a better understanding to "seed and soil" hypothesis”. Mol Cancer. 2017;16 doi: 10.1186/s12943-017-0742-4. - DOI - PMC - PubMed
    1. Liu Y, Cao X. Characteristics and significance of the pre-metastatic niche. Cancer Cell. 2016;30:668–81. doi: 10.1016/j.ccell.2016.09.011. - DOI - PubMed