. 2024 Jun 26;15(1):5423.
doi: 10.1038/s41467-024-49740-w.

MRE11 and TREX1 control senescence by coordinating replication stress and interferon signaling

Affiliations

MRE11 and TREX1 control senescence by coordinating replication stress and interferon signaling

Hervé Técher et al. Nat Commun. .

Abstract

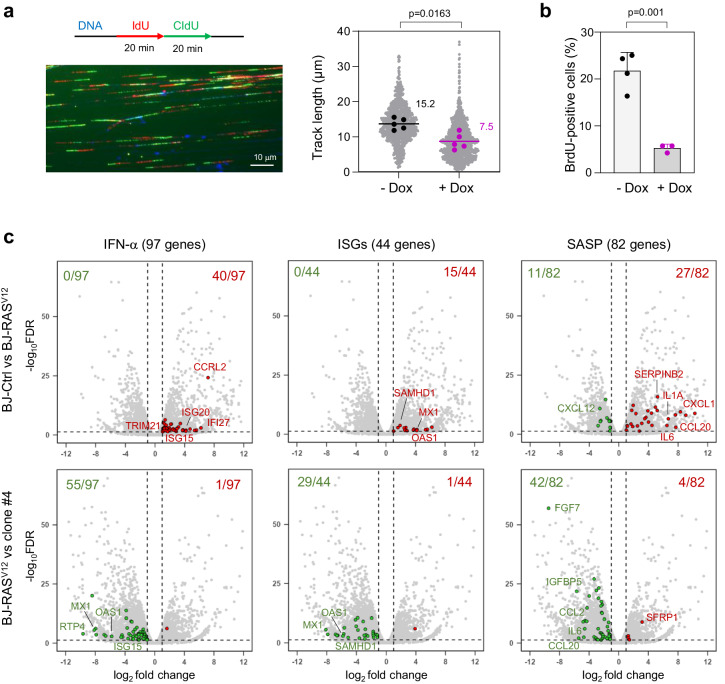
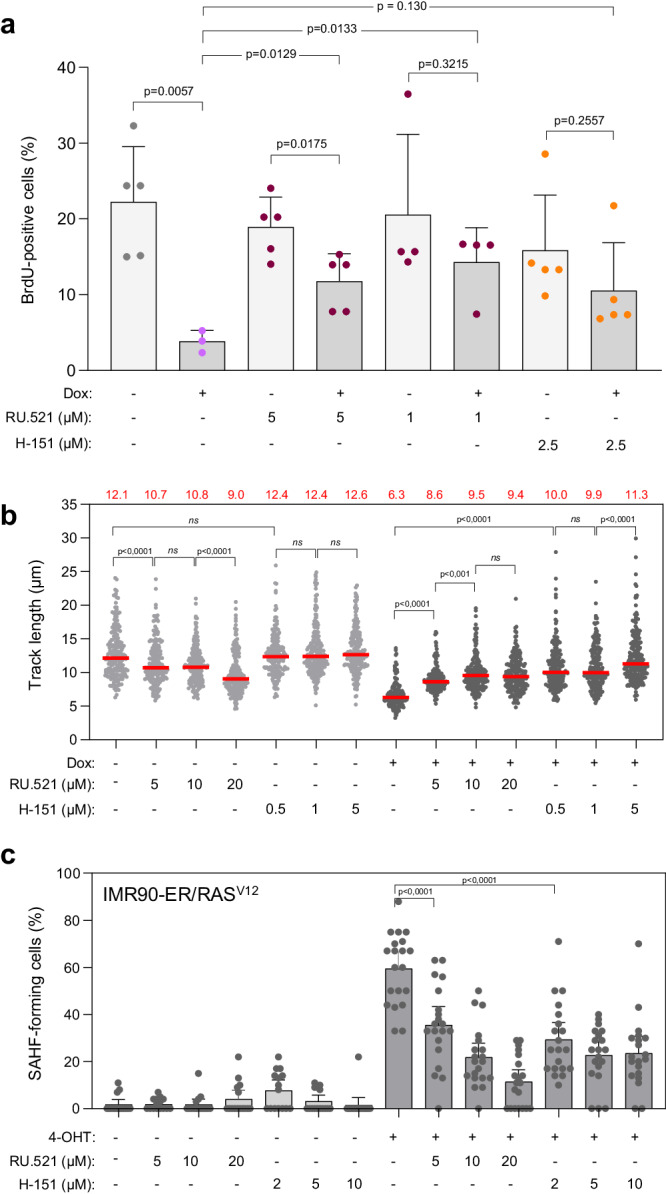
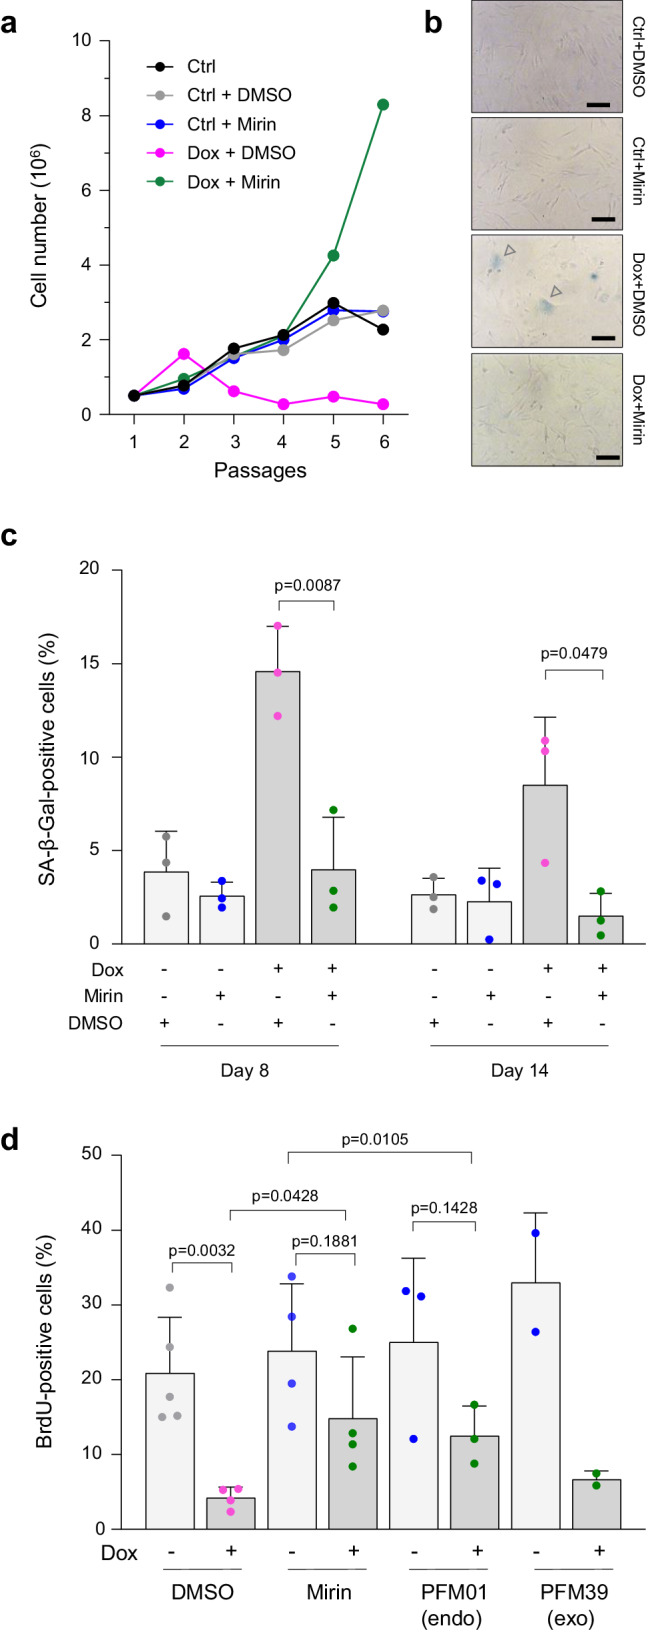
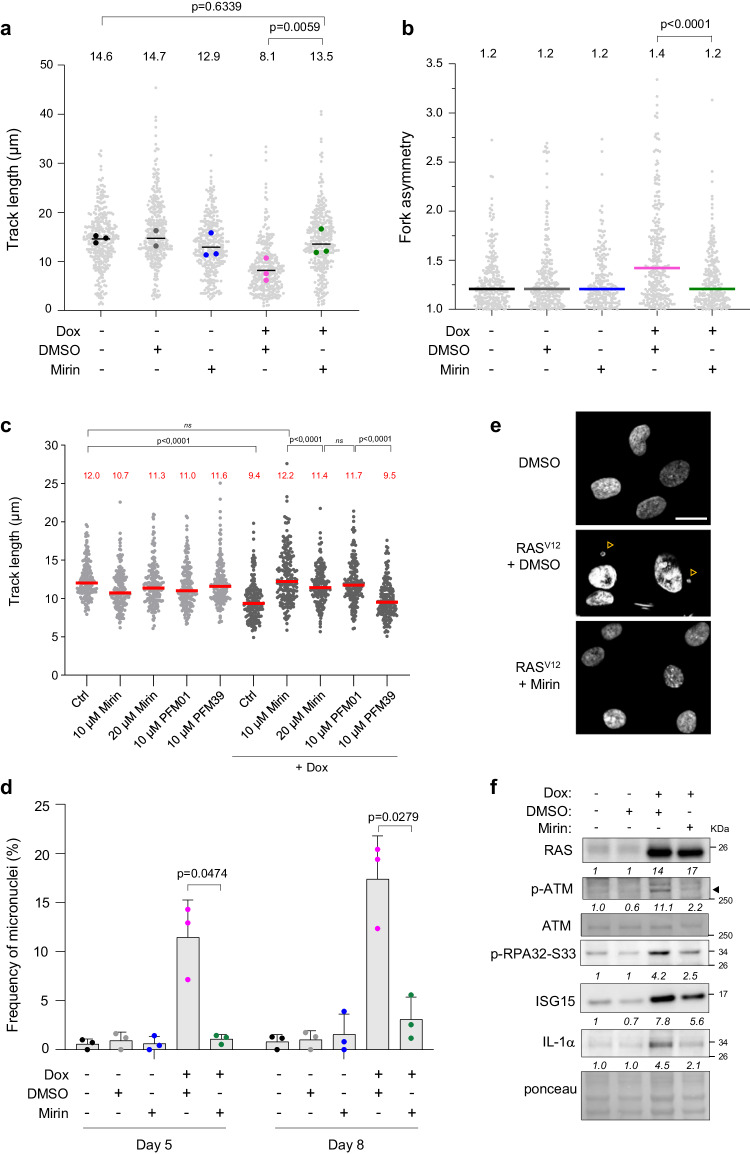
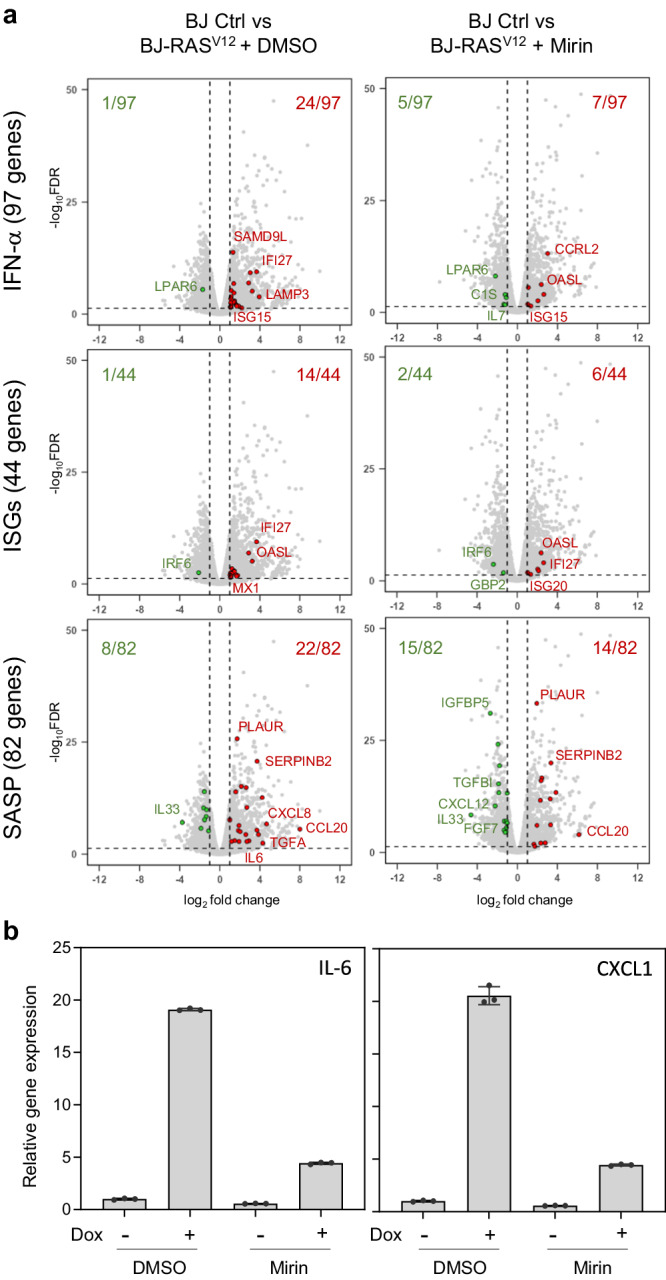
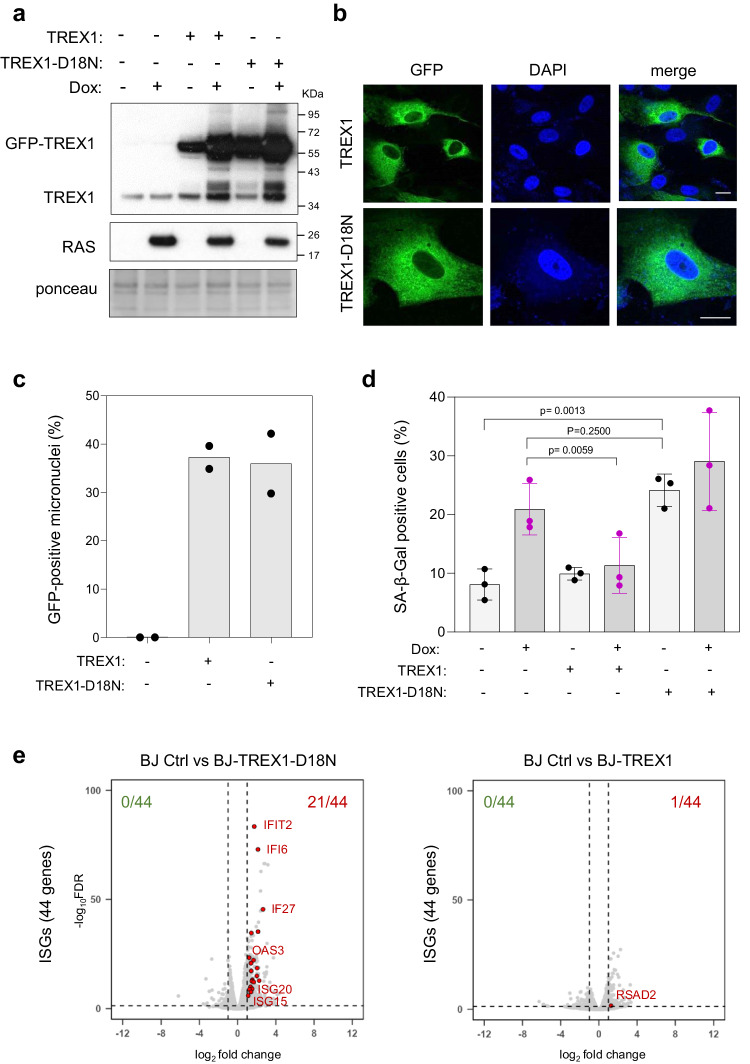
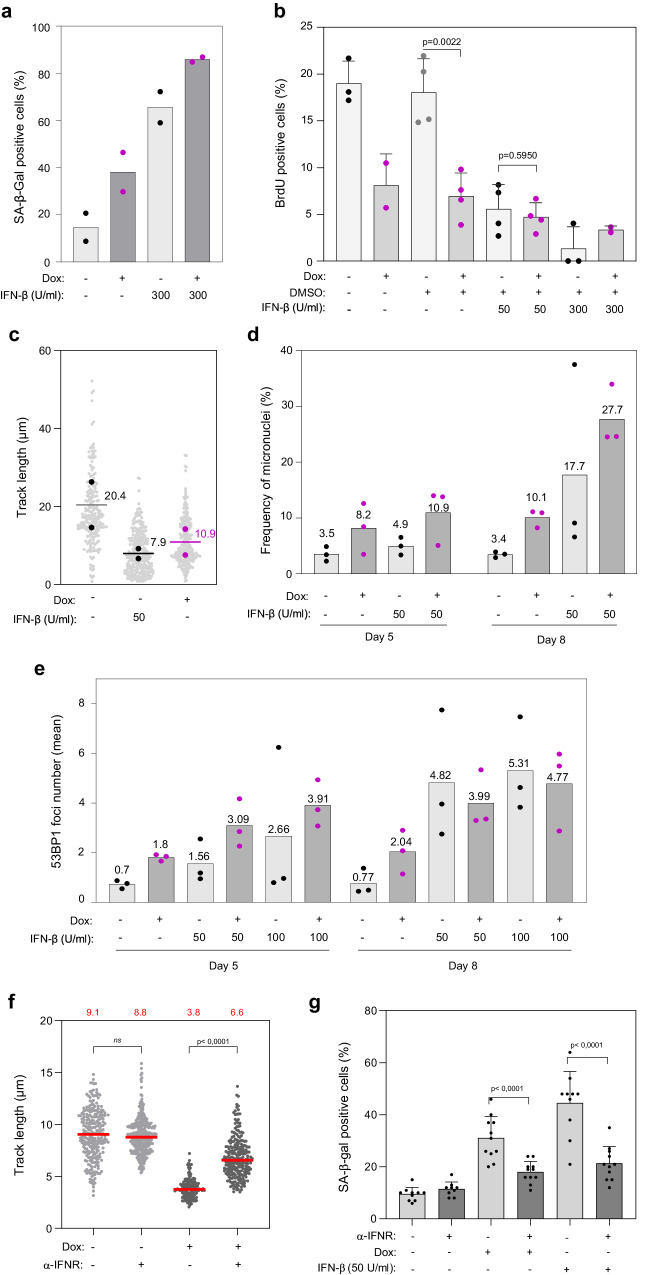
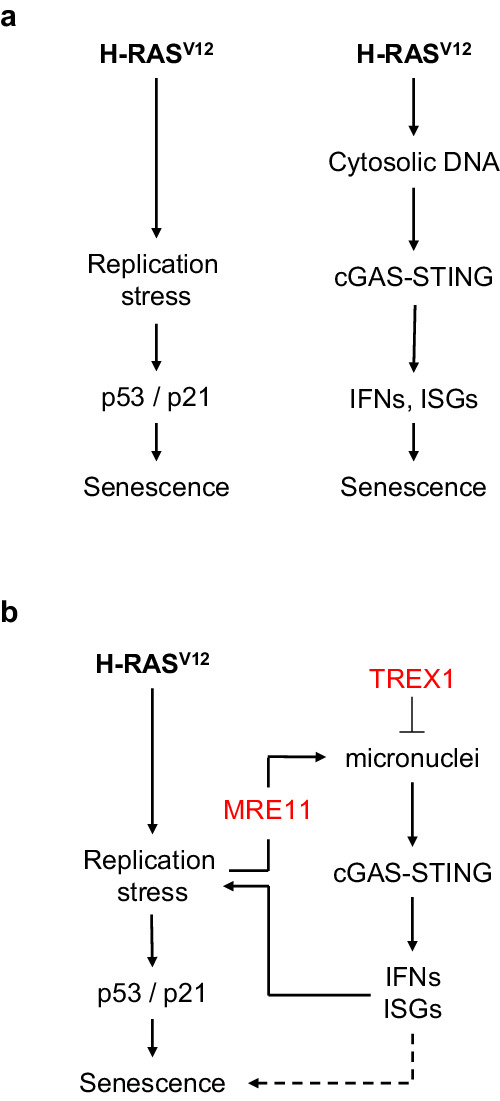
Oncogene-induced senescence (OIS) arrests cell proliferation in response to replication stress (RS) induced by oncogenes. OIS depends on the DNA damage response (DDR), but also on the cGAS-STING pathway, which detects cytosolic DNA and induces type I interferons (IFNs). Whether and how RS and IFN responses cooperate to promote OIS remains unknown. Here, we show that the induction of OIS by the H-RASV12 oncogene in immortalized human fibroblasts depends on the MRE11 nuclease. Indeed, treatment with the MRE11 inhibitor Mirin prevented RS, micronuclei formation and IFN response induced by RASV12. Overexpression of the cytosolic nuclease TREX1 also prevented OIS. Conversely, overexpression of a dominant negative mutant of TREX1 or treatment with IFN-β was sufficient to induce RS and DNA damage, independent of RASV12 induction. These data suggest that the IFN response acts as a positive feedback loop to amplify DDR in OIS through a process regulated by MRE11 and TREX1.


Conflict of interest statement

The authors declare no competing interests.

Figures

Fig. 1
Fig. 1. Induction of IFN, ISG and SASP genes in response to RASV12-induced RS.
a Analysis of replication fork progression by DNA fiber spreading. Cells were pulse-labeled with two consecutive pulses of IdU and CldU for 20 min each. DNA was counterstained with an anti-ssDNA antibody and monoclonal antibodies against IdU and CldU. A representative image is shown. RASV12 overexpression was induced (+Dox) or not (−Dox) with 10 μg/ml doxycycline for 8 days. Gray dots correspond to track lengths from five independent experiments. Track length is the sum of adjacent IdU and CldU tracks from individual forks. The mean of individual experiments is shown as large dots. Horizontal bars indicate the median of the five biological replicates. P value: two-sided paired t-test. b RASV12 overexpression was induced (+Dox, n = 3) or not (−Dox, n = 4) with doxycycline for 8 days and cells were labeled with 30 μM BrdU for 20 min. BrdU incorporation was monitored by immunofluorescence of at least 100 cells per condition and in each independent experiment. Means and standard deviations are presented for at least three independent experiments. P value: two-sided unpaired t-test. c Volcano plots of differentially expressed genes in BJ-RASV12 cells overexpressing (BJ-RASV12) or not (BJ-Ctrl) RASV12. Clone #4 is a BJ-RASV12 clone that escaped senescence by overexpressing Claspin and Timeless. Gene sets correspond to interferon-α response genes (IFN-α, GSEA M5911), interferon stimulated genes (ISGs, Reactome R-HSA-9034125) and SASP genes. Up-regulated genes are shown in red (log2 fold change > 1 and FDR < 0.05). Down-regulated genes are shown in green (log2 fold change < −1 and FDR < 0.05). Data are from biological duplicates. Source data are provided as a Source Data file.
Fig. 2
Fig. 2. The cGAS-STING pathway contributes to RASV12-induced senescence.
a Inhibition of the cGAS-STING pathway restores cell proliferation in BJ-RASV12 fibroblasts. RASV12 overexpression was induced (+Dox) or not (−Dox) for 8 days with 10 μg/ml doxycycline and cells were labeled for 20 min with 30 μM BrdU. Cells were treated with the cGAS inhibitor RU.521 (1 or 5 μM) or the STING inhibitor H-151 (2.5 μM). DMSO was used as control. BrdU incorporation was monitored by immunofluorescence and the frequency of BrdU-positive cells was determined. At least 62 cells per condition in each experiment were scored. Mean, SD and p values (two-sided unpaired t-test) are shown. Each point represents a biological replicate (n = at least 3). b cGAS and STING inhibitors counteract RASV12-induced fork slowing. BJ-RASV12 fibroblasts were treated or not with 10 μg/ml doxycycline in the absence or presence of increasing doses of cGAS or STING inhibitor (RU.521 or H-151, respectively) for 6 days. Replication fork progression was measured by DNA fiber spreading. Median of the IdU+CldU track length is indicated in red. ****p < 0.0001, ***p < 0.001, ns non-significant, two-tailed Mann–Whitney rank sum test. A minimum of 150 fibers were measured in each sample. A representative experiment is shown (n = 2). c cGAS and STING inhibitors prevent SAHF formation induced by RASV12. IMR90-ER/RASV12 fibroblasts were treated or not with 100 nM 4-hydroxytamoxifen (4-OHT) in the absence or presence of increasing doses of cGAS or STING inhibitor (RU.521 or H-151, respectively) for 6 days. The percentage of SAHF was quantified by DAPI staining. ****p < 0.0001, two-tailed Mann–Whitney rank sum test. One representative experiment from two independent experiments is shown (n = 2). Source data are provided as a Source Data file.
Fig. 3
Fig. 3. MRE11 promotes senescence in BJ-RASV12 fibroblasts.
a Effect of MRE11 inhibition on BJ-RASV12 cell growth. Untreated (Ctrl) or RAS-induced (Dox, 10 μg/ml) BJ-RASV12 cells were grown in the presence (+Mirin) or the absence (DMSO) of 10 µM Mirin. Cumulative cell number was calculated by counting cells during five consecutive passages, with each passage lasting 3–4 days in culture. A representative experiment is shown (n = 2). b Representative images of SA-β-gal staining in BJ-RASV12 fibroblasts overexpressing RASV12 and treated or not with 10 µM Mirin for 8 and 14 days (n = 3). Scale bars are 100 μm. c MRE11 inhibition prevents the induction of senescence-associated β-galactosidase (SA-β-gal). BJ-RASV12 fibroblasts were induced with 10 μg/ml doxycycline (Dox) for 8 and 14 days in the presence or absence of 10 μM Mirin. Cells were stained for SA-β-gal activity and the frequency of SA-β-gal positive cells was scored. Mean, SD and p values (two-sided unpaired t-test) are shown for three independent experiments. d Effect of MRE11 inhibitors on cell proliferation. BJ-RASV12 fibroblasts were induced or not with 10 μg/ml doxycycline (Dox). The frequency of BrdU-positive cells, at least 74 cells were scored per condition in each independent experiment, before and after RASV12 induction was monitored in the presence or the absence of 10 μM Mirin, 10 μM PFM01 and 10 μM PFM39 after 8 days of treatment. Non-treated (-) and DMSO-treated cells were used as controls. Mean, SD, and p values (two-sided unpaired t-test) are shown. Each point represents a biological replicate. Source data are provided as a Source Data file.
Fig. 4
Fig. 4. Mirin prevents RASV12-induced replication stress.
a BJ-RASV12 cells were grown for 8 days with or without 10 µg/ml Dox and 10 µM Mirin. Cells were labeled with two consecutive pulses of IdU and CldU for 20 min each and DNA fibers were stretched on glass slides. The distribution of track length is shown for at least two independent experiments. A minimum of 300 individual forks were measured per condition. Median and p values (two-sided paired t-test) are indicated. b Mirin suppresses the fork asymmetry induced by RASV12. Fork asymmetry was measured as the ratio of the longest to the shortest track for each individual fork in BJ-RASV12 cells treated with different combinations of Dox and Mirin. Median and p values (two-tailed Mann–Whitney rank sum test) are indicated. At least 200 individual forks were measured for each condition. A representative experiment is shown (n = 2). c Mirin and PFM01, but not PFM39, restore RASV12-induced fork slowing. BJ-RASV12 fibroblasts were treated or not with 10 μg/ml doxycycline in the absence or presence of increasing doses of Mirin, 10 μM PFM01 or 10 μM PFM39 for 6 days. Replication fork progression was measured by DNA fiber spreading. A minimum of 150 fibers were measured in each sample. Median track length is indicated in red. ****p < 0.0001, two-tailed Mann–Whitney rank sum test. A representative experiment is shown (n = 2). d Mirin prevents the accumulation of micronuclei in BJ-RASV12 fibroblasts. The frequency of micronucleated cells was determined by fluorescence microscopy in cells treated with indicated combinations of 10 μg/ml Dox and 10 µM Mirin. At least 50 cells were analyzed per condition and in each experiment. Mean, SD, and p values (two-sided unpaired t-test) are shown for three independent experiments. e Representative images of DAPI-stained BJ-RAS cells after 5 days of RASV12induction. Arrowheads point to micronuclei. Scale bar is 20 μm. f Western blot analysis of DDR factors, ISG15 and IL-1α in BJ-RASV12 cells treated or not with 10 μg/ml doxycycline and 10 µM Mirin. Relative fold changes are indicated. The experiment is representative of at least two independent experiments (see also Supplementary Fig. 5). Source data are provided as a Source Data file.
Fig. 5
Fig. 5. The induction of IFN, ISG and SASP genes in BJ-RASV12 cells depends on MRE11.
a BJ-RASV12 fibroblasts were induced for 8 days with 10 μg/ml Dox in the presence or the absence of 10 μM Mirin. Volcano plots of differentially expressed IFN, ISG and SASP genes between control and RAS-induced BJ cells treated or not with Mirin are shown. Data are from biological triplicates. b Levels of IL6 and CXCL1 expression were quantified by RT-qPCR. Mean ± SD of one representative experiment of two independent experiments is shown (n = 2). Source data are provided as a Source Data file.
Fig. 6
Fig. 6. TREX1 modulates senescence in BJ-RASV12 fibroblasts.
a Western blot analysis of RASV12 and TREX1 levels in BJ-RASV12 cells treated or not with 10 μg/ml doxycycline and stably overexpressing full-length (TREX1) or D18N mutant (TREX1-D18N) TREX1 tagged with an N-terminal GFP. Data are representative of at least three independent experiments. b Subcellular localization of GFP-TREX1 and GFP-TREX1-D18N was assessed by fluorescence microscopy. Representative images of one experiment are shown (n = 3). c Frequency of GFP-TREX1 positive micronuclei. At least 200 cells of each sample were scored for the formation of micronuclei (n = 2). d Frequency of SA-β-gal positive BJ-RASV12 fibroblasts overexpressing TREX1 or TREX1-D18N. Mean, SD and p values (two-sided unpaired t-test) are shown for three biological replicates. e Volcano plots of differentially expressed ISG genes in non-induced BJ-RAS cells (BJ Ctrl) compared to cells overexpressing either TREX1 or TREX1-D18N. Source data are provided as a Source Data file.
Fig. 7
Fig. 7. IFN-β induces replication stress and senescence in BJ fibroblasts.
a BJ-RASV12 fibroblasts induced or not with 10 μg/ml doxycycline were treated or not with 300 U/ml of recombinant interferon-β (IFN-β) for a period of 8 days and the frequency of SA-β-gal positive cells was scored in two independent experiments. b BrdU incorporation in BJ-RASV12 cells treated or not with 50 or 300 U/ml IFN-β. Mean, SD and p values (two-sided unpaired t-test) are shown. At least 90 cells were scored per condition and in each experiment. Each point represent a biological replicate. c DNA fiber analysis of fork progression in BJ-RASV12 cells treated or not with 10 µg/ml Dox and 50 U/ml IFN-β, as described in Fig. 4a. Median values from two independent experiments are indicated. d Micronuclei frequency in BJ-RASV12 cells treated or not with 10 µg/ml Dox and 50 µ/ml IFN-β for 5 and 8 days. Mean values are shown for three independent experiments. e Number of 53BP1 foci in BJ-RASV12 cells treated or not with Dox and with 50 or 100 U/ml IFN-β for 5 or 8 days. Mean values are shown for three independent experiments. f IFN-β signaling contributes to RASV12-induced fork slowing. BJ-RASV12 fibroblasts were treated or not with 10 μg/ml doxycycline and 50 U/ml IFN-β for 6 days as indicated, in the presence of an anti-IFNα/β receptor antibody (α-IFNR) or a control IgG. Replication fork progression was measured by DNA fiber spreading. A minimum of 150 fibers were measured in each sample. Median track length is indicated in red. ****p < 0.0001, ns non-significant, two-tailed Mann–Whitney rank sum test. A representative experiment is shown (n = 2). g IFN-β signaling promotes RASV12-induced senescence. BJ-RASV12 fibroblasts treated as indicated above and β-galactosidase activity was analyzed on day 6. A minimum of 200 cells from 10 images were scored for SA-β-gal-positive cells in each sample. The percentage of SA-β-gal-positive cells (Mean ± SD) is shown for one representative experiment from two independent experiments (n = 2). ****p < 0.0001, two-tailed Mann–Whitney rank sum test. Source data are provided as a Source Data file.
Fig. 8
Fig. 8. Role of RS and cytosolic DNA sensing pathways in OIS.
a The DDR and cGAS-STING pathways are both required for the onset of OIS, but whether these pathways cooperate to induce senescence remains unclear. b Our data indicate that the nuclease MRE11 plays a central role in OIS by activating both the RS response and the cGAS-STING pathway via micronuclei formation. This function of MRE11 is counterbalanced by another nuclease, TREX1, which prevents activation of the cGAS-STING pathway by degrading cytosolic DNA. Remarkably, TREX1 inhibition or addition of IFN-β was sufficient to induce RS and senescence, even in the absence of RASV12 induction. Collectively, these data suggest that MRE11 activates a positive feedback loop that amplifies the RS response in OIS via activation of cytosolic DNA sensing.

References

    1. Gorgoulis V, et al. Cellular senescence: defining a path forward. Cell. 2019;179:813–827. doi: 10.1016/j.cell.2019.10.005. - DOI - PubMed
    1. Kotsantis P, Petermann E, Boulton SJ. Mechanisms of oncogene-induced replication stress: jigsaw falling into place. Cancer Discov. 2018;8:537–555. doi: 10.1158/2159-8290.CD-17-1461. - DOI - PMC - PubMed
    1. Bartkova J, et al. Oncogene-induced senescence is part of the tumorigenesis barrier imposed by DNA damage checkpoints. Nature. 2006;444:633–637. doi: 10.1038/nature05268. - DOI - PubMed
    1. Di Micco R, et al. Oncogene-induced senescence is a DNA damage response triggered by DNA hyper-replication. Nature. 2006;444:638–642. doi: 10.1038/nature05327. - DOI - PubMed
    1. Yang H, Wang H, Ren U, Chen Q, Chena ZJ. CGAS is essential for cellular senescence. Proc. Natl Acad. Sci. USA. 2017;114:E4612–E4620. doi: 10.1073/pnas.1705499114. - DOI - PMC - PubMed