. 2024 Jun 26;15(1):5426.
doi: 10.1038/s41467-024-49758-0.

Evolution of STAT2 resistance to flavivirus NS5 occurred multiple times despite genetic constraints

Affiliations

Evolution of STAT2 resistance to flavivirus NS5 occurred multiple times despite genetic constraints

Ethan C Veit et al. Nat Commun. .

Abstract

Zika and dengue virus nonstructural protein 5 antagonism of STAT2, a critical interferon signaling transcription factor, to suppress the host interferon response is required for viremia and pathogenesis in a vertebrate host. This affects viral species tropism, as mouse STAT2 resistance renders only immunocompromised or humanized STAT2 mice infectable. Here, we explore how STAT2 evolution impacts antagonism. By measuring the susceptibility of 38 diverse STAT2 proteins, we demonstrate that resistance arose numerous times in mammalian evolution. In four species, resistance requires distinct sets of multiple amino acid changes that often individually disrupt STAT2 signaling. This reflects an evolutionary ridge where progressive resistance is balanced by the need to maintain STAT2 function. Furthermore, resistance may come with a fitness cost, as resistance that arose early in lemur evolution was subsequently lost in some lemur lineages. These findings underscore that while it is possible to evolve resistance to antagonism, complex evolutionary trajectories are required to avoid detrimental host fitness consequences.


Conflict of interest statement

Adolfo García-Sastre has received research support from GSK, Pfizer, Senhwa Biosciences, Kenall Manufacturing, Blade Therapeutics, Avimex, Johnson & Johnson, Dynavax, 7Hills Pharma, Pharmamar, ImmunityBio, Accurius, Nanocomposix, Hexamer, N-fold LLC, Model Medicines, Atea Pharma, Applied Biological Laboratories and Merck, outside of the reported work. A.G.-S. has consulting agreements for the following companies involving cash and/or stock: Castlevax, Amovir, Vivaldi Biosciences, Contrafect, 7Hills Pharma, Avimex, Pagoda, Accurius, Esperovax, Farmak, Applied Biological Laboratories, Pharmamar, CureLab Oncology, CureLab Veterinary, Synairgen, Paratus, Pfizer and Prosetta, outside of the reported work. A.G.-S. has been an invited speaker in meeting events organized by Seqirus, Janssen, Abbott and Astrazeneca. A.G.-S. is inventor on patents and patent applications on the use of antivirals and vaccines for the treatment and prevention of virus infections and cancer, owned by the Icahn School of Medicine at Mount Sinai, New York, outside of the reported work. The remaining authors declare no competing interests.

Figures

Fig. 1
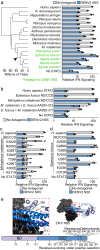
Fig. 1. STAT2 susceptibility to flavivirus NS5 antagonism varies among mammals.
a Relative IFN signaling (mean ± s.d., n = 6) (defined as the ratio of activities of the two luciferases normalized to naïve HEK-293T’s transfected with reporters only) in naïve and STAT2 KO (confirmed via immunoblot with molecular weight marker positions labeled) HEK-293T cells transfected with reporter plasmids only (dark grey), plus STAT2 plasmid (light grey), or plus STAT2 and ZIKV NS5 plasmids (pink). b Structure of the complex between ZIKV NS5 (grayscale space filling representation) and H. sapiens STAT2 (ribbon representation with domain colored as in (c) (composite of PDB:6WCZ, 6UX2). c Schematic of the strategy for the cloning the ND and CCD of various STAT2 orthologs (red fill) as chimeras with the rest of H. sapiens STAT2. d Node dated molecular phylogeny showing species relatedness of 38 mammalian species. Branch length corresponds to divergence time in millions of years with a scale included below. Grey-scale background coloring corresponds to order classification. e STAT2 ortholog ND/CCD chimera expression was compared by immunoblot at 48 h post transient transfection in STAT2 KO HEK-293T cells. Molecular weight marker positions are labeled on the top. fh Relative IFN signaling (defined in this and all subsequent experiments as defined as the ratio of activities of the two luciferases normalized to H. sapiens STAT2 in the absence of an antagonist) mediated by each of ND/CCD chimeras in the absence of a viral antagonist (grey) and in the presence of f ZIKV NS5 (pink) (mean ± s.d., for Homo sapiens, Mus musculus, and No STAT2, n = 12, all others n = 6). g SPOV NS5 (yellow) (mean ± s.d., n = 6). h DENV2 NS5 (blue) (mean ± s.d., for Homo sapiens, Mus musculus, and No STAT2, n = 12, all others n = 6). Source data are provided as a Source Data file. All IFN signaling values are derived from at least two independent experiments each with three technical replicates.
Fig. 2
Fig. 2. M. musculus STAT2 resistance is contained in the coiled-coil domain.
a STAT2 ND/CCD schematic showing the locations of the M. musculus resistance determinants, IRF9 contact sites, and the residue found to be rapidly evolving in rodents. Numbering is relative to H. sapiens STAT2. b Relative expression level in absence of antagonist, determined by immunoblot (with molecular weight marker positions on the top) and relative IFN signaling (mean ± s.d., n = 6) mediated by each of indicated STAT2 mutant in the absence of a viral antagonist (grey) and in the presence of ZIKV NS5 (pink). c Immunoblots with the antibodies labeled on the right of STAT2 KO HEK-293T cell whole cell extracts (WCE) and FLAG-antibody immunoprecipitations of the indicated STAT2 proteins with FLAG-tagged ZIKV NS5. To avoid degradation, STAT2 proteins and NS5 were expressed separately, and lysates were mixed prior to immunoprecipitation. Molecular weight marker positions are labeled on the left. Co-immunoprecipitation repeated one other time yielded similar results. d Structure of ZIKV NS5 and STAT2, as shown in Fig. 1b, with residues in zoomed images colored in red to indicate IRF9 contact sites and M. musculus resistance determinants. Source data are provided as a Source Data file. All IFN signaling values are derived from at least two independent experiments each with three technical replicates.
Fig. 3
Fig. 3. Flavivirus NS5 resistance determinants vary between rodent species.
a Node dated molecular phylogeny on the left showing species relatedness of H. sapiens and nine rodents species with those possessing a STAT2 resistant to ZIKV NS5 marked in green (*). Arrows mark the roots of two separate acquisitions of resistance to ZIKV NS5 antagonism. To the right is an amino acid alignment of these species spanning the region encoding the previously mapped M. musculus resistance determinants. The numbering on the top and bottom of the alignment corresponds to H. sapiens and M. musculus STAT2 respectively. b Relative IFN signaling (Mean ± s.d, n = 6) of the indicated STAT2 ND/CCD chimeras in the absence (grey) and presence of ZIKV NS5 (pink). c Top, space filling representation of ZIKV NS5 in complex with ribbon representation of H. sapiens STAT2 with a zoomed in view of the region encoding the C. porcellus resistance determinants (red) to the right. Below is a schematic of the STAT2 ND/CCD showing the C. porcellus resistance determinants with numbering corresponding to H. sapiens STAT2. d Relative IFN signaling (Mean ± s.d, n = 6) of the indicate STAT2 chimeras in the absence of an antagonist (grey), or in the presence of ZIKV MR766 NS5 (pink), SPOV NS5 (yellow), DENV1 NS5 (turquoise), DENV2 NS5 (blue), DENV3 NS5 (light purple), and DENV4 NS5 (purple). Source data are provided as a Source Data file. All IFN signaling values are derived from at least two independent experiments each with three technical replicates.
Fig. 4
Fig. 4. Vespertilionidae bats exhibit monophyletic resistance to DENV NS5.
a Node dated molecular phylogeny on the left showing species relatedness of H. sapiens and the 15 bat species, with those that have a STAT2 that is resistant to DENV NS5 antagonism marked in green(*). The black arrow indicates the family Vespertilionidae branch point where resistance to DENV NS5 antagonism occurred. On the right is a graph corresponding to the Relative IFN signaling (Mean ± s.d, n = 6) of each species ND and CCD chimeras in the absence (gray) and presence of DENV2 NS5 (blue) b Relative IFN signaling (Mean ± s.d, n = 6) in the absence (grey) and presence (blue) of DENV2 NS5 for the M. natalensis and E. fuscus ND/CCD chimeras and chimeras with reciprocal changes in the resistance determinates mapped in (Supplementary Fig. 4b). c Relative IFN signaling (Mean ± s.d, n = 6) in the absence (grey) and presence (blue) of DENV2 NS5 for the M. natalensis ND/CCD chimera with each of the eight mapped resistance determinants swapped individually to the E. fuscus sequence. d Relative IFN signaling (Mean ± s.d, n = 6) in the absence (grey) and presence (blue) of DENV2 NS5 for the E. fuscus ND/CCD chimera with each of the eight mapped resistance determinants swapped individually to the M. natalensis sequence. e Top, space filling representation of ZIKV NS5 (as a proxy for DENV NS5) in complex with ribbon representation of H. sapiens STAT2. Zoomed region shows E. fuscus STAT2 resistance determinants (red). Below, schematic of the STAT2 ND/CCD showing the E. fuscus STAT2 resistance determinants, and the residues found to be rapidly evolving using PAML/FUBAR. Underlined numbers indicated resistance determinants that are also rapidly evolving. Source data are provided as a Source Data file. All IFN signaling values are derived from at least two independent experiments each with three technical replicates.
Fig. 5
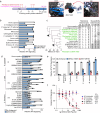
Fig. 5. DENV NS5 resistance was acquired and subsequently lost in lemur evolution.
a Left, STAT2 ND/CCD schematic with resistance (red), susceptibility (pink), and rapidly evolving residues via PAML/FUBAR (black) marked. Right, space filling representation of ZIKV NS5 (as a proxy for DENV NS5) in complex with ribbon representation of H. sapiens STAT2. Zoomed in regions show two views of the DENV NS5 resistance determinants mapped in P. coquereli STAT2 (red) and the residues involved in the reversion to susceptibility (pink). Underlined numbers indicated resistance determinants that are also rapidly evolving. Note: STAT2 residue 127 is not resolved in this structure. b Relative IFN signaling (Mean ± s.d, n = 6) of STAT2 chimeras in the absence (grey) and presence (blue) of DENV2 NS5. c Species level node dated molecular phylogeny with alignments of the STAT2 sequence at residues defined as resistance and susceptibility determinants. Species with STAT2 susceptible to DENV NS5 antagonism are marked (*). Arrows (1) and (2) indicate the acquisition of resistance to the reversion to susceptibility, respectively. d Relative IFN signaling (Mean ± s.d, n = 6) in the absence (grey) and presence (blue) of DENV2 NS5 of (i) P. coquereli STAT2 with L. catta amino acids (ii) L. catta STAT2 with P. coquereli amino acids (iii) L. catta STAT2 with E. flavifrons amino acids (iv) E. flavifrons STAT2 with L. catta amino acids. e Relative STAT2 abundance (Mean ± s.d, n = 3) following DENV (blue) or ZIKV (pink) infection compared to the uninfected condition for each cell line. Values are normalized to the percent infection for each virus in each cell line (quantification of Supplementary Fig. 6b, gating strategy and quantification in Supplementary Fig. 8). Data is generated from the quantification of three independent experiments. f Relative IFN signaling (Mean ± s.d, n = 6) of STAT2 chimeras with increasing amounts of DENV2 NS5. Values are normalized to signaling in absence of DENV2 NS5 and the baseline is set to reporter levels in the absence of STAT2. Curves are fit using least-squares fit method of non-linear regression to calculate IC50 values for each STAT2 in units of ng of DENV2 NS5 plasmid. Source data are provided as a Source Data file. All IFN signaling values are derived from at least two independent experiments each with three technical replicates.

References

    1. Grant A, et al. Zika virus targets human STAT2 to inhibit type I interferon signaling. Cell Host Microbe. 2016;19:882–890. doi: 10.1016/j.chom.2016.05.009. - DOI - PMC - PubMed
    1. Ashour J, Laurent-Rolle M, Shi P-Y, García-Sastre A. NS5 of dengue virus mediates STAT2 binding and degradation. J. Virol. 2009;83:5408–5418. doi: 10.1128/JVI.02188-08. - DOI - PMC - PubMed
    1. Laurent-Rolle M, et al. The interferon signaling antagonist function of yellow fever virus NS5 protein is activated by type I interferon. Cell Host Microbe. 2014;16:314–327. doi: 10.1016/j.chom.2014.07.015. - DOI - PMC - PubMed
    1. Lubick KJ, et al. Flavivirus antagonism of type I interferon signaling reveals prolidase as a regulator of IFNAR1 surface expression. Cell Host Microbe. 2015;18:61–74. doi: 10.1016/j.chom.2015.06.007. - DOI - PMC - PubMed
    1. Ashour J, et al. Mouse STAT2 restricts early dengue virus replication. Cell Host Microbe. 2010;8:410–421. doi: 10.1016/j.chom.2010.10.007. - DOI - PMC - PubMed

Substances