. 2024 Jun 26;15(1):5403.
doi: 10.1038/s41467-024-49460-1.

IFNγ causes mitochondrial dysfunction and oxidative stress in myositis

Affiliations

IFNγ causes mitochondrial dysfunction and oxidative stress in myositis

Catalina Abad et al. Nat Commun. .

Abstract

Idiopathic inflammatory myopathies (IIMs) are severe autoimmune diseases with poorly understood pathogenesis and unmet medical needs. Here, we examine the role of interferon γ (IFNγ) using NOD female mice deficient in the inducible T cell co-stimulator (Icos), which have previously been shown to develop spontaneous IFNγ-driven myositis mimicking human disease. Using muscle proteomic and spatial transcriptomic analyses we reveal profound myofiber metabolic dysregulation in these mice. In addition, we report muscle mitochondrial abnormalities and oxidative stress in diseased mice. Supporting a pathogenic role for oxidative stress, treatment with a reactive oxygen species (ROS) buffer compound alleviated myositis, preserved muscle mitochondrial ultrastructure and respiration, and reduced inflammation. Mitochondrial anomalies and oxidative stress were diminished following anti-IFNγ treatment. Further transcriptomic analysis in IIMs patients and human myoblast in vitro studies supported the link between IFNγ and mitochondrial dysfunction observed in mice. These results suggest that mitochondrial dysfunction, ROS and inflammation are interconnected in a self-maintenance loop, opening perspectives for mitochondria therapy and/or ROS targeting drugs in myositis.


Conflict of interest statement

O.B. received research funding and/or honorarium from argenx, BMS, CSL Behring, Egle TX, OGD2, and UCB. The remaining authors declare no competing interests.

Figures

Fig. 1
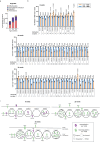
Fig. 1. Icos-/- NOD mice developing myositis exhibit profound muscle metabolic disturbances.
a Immunofluorescence staining of immune cells (CD45) and myofibers (laminin) in the muscles of Icos+/+ NOD and Icos-/- NOD mice of 8, 25, and 35 weeks of age (predisease, onset and established disease in the Icos-/- NOD mice, respectively). A representative image out of n = 10 independent mice/genotype is shown. Scale bar, 1 mm. b Cytokine (Ifng and Ifnb) and chemokine (Ccl2, Cxcl9, Cxcl10) mRNA gene expression levels in the muscles of Icos+/+ NOD and Icos-/- NOD mice at different ages; for Icos+/+ NOD at all ages n = 5 independent mice/group; for Icos-/- NOD mice, n = 8 (8 and 25 weeks of age) and n = 10 (35 weeks of age) independent mice/group (arb. units: arbitrary units). Numbers denote p values. Mean values  ±  s.e.m are shown. a, b were repeated independently twice with one representative experiment being shown. cg Proteome analysis of Icos-/- NOD vs. Icos+/+ NOD mice muscles at 8, 25, and 35 weeks of age (n = 5 independent mice/genotype and age). c Number of dysregulated proteins in Icos-/- NOD vs. Icos+/+ NOD muscles. d Protein-protein interaction (PPI) map of dysregulated proteins in Icos-/- NOD vs. Icos+/+ NOD mice muscles, highlighting major altered pathways (input data corresponds to the mean of n = 5 independent mice) (STRING Gene ontology-Biological Process (GO-BP) analysis for all except for ‘Immune System’, which protein interactions were only identified by Reactome analysis). e Graphs showing the percentage of enriched STRING GO-BP and Reactome terms of the total terms for metabolic, muscle, and immune processes. f Proteins that are involved in ‘Metabolism’ (according to STRING GO-BP) were subdivided into the indicated categories based on STRING GO-BP or Reactome database analysis. g Top 15 ‘Canonical pathways’ identified using Ingenuity Pathway Analysis (IPA) of dysregulated proteins of Icos-/- NOD vs. Icos+/+ NOD mice. For b, statistical analyses were performed using the Two-way ANOVA test with Sidak’s post-hoc multiple comparisons. For the identification of significantly dysregulated proteins, statistical analysis was performed using the inbuilt Progenesis statistical box called ‘one-way ANOVA’. For the IPA analysis, Fisher’s Exact test was used. Source data are provided as a Source Data file.
Fig. 2
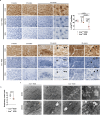
Fig. 2. Proteome analysis of muscle from Icos-/- NOD mice developing myositis reveals the presence of mitochondrial anomalies.
a In-depth STRING proteome analysis of Icos-/- NOD vs. Icos+/+ NOD mice muscles showing identified dysregulated proteins classified by organelle. b IPA proteome analysis showing altered proteins belonging to the mitochondrial respiratory chain in the muscles of Icos-/- NOD vs. Icos+/+ NOD mice. Histograms represent normalized protein levels with respect to Icos+/+ NOD mice (100%) (n = 5 independent mice/group). Mean values  ±  s.e.m are shown. c IPA-generated schematic graphic representing dysregulated protein distribution in the mitochondrial respiratory chain (respiratory chain complexes I to V and O, for other). Statistical analysis was performed using the inbuilt Progenesis statistical box called ‘one-way ANOVA’. Numbers on graphs denote p values obtained by comparison of Icos-/- NOD vs. Icos+/+ NOD raw data. Source data are provided as a Source Data file.
Fig. 3
Fig. 3. Mitochondrial functional and morphological anomalies are present in the muscles of Icos-/- NOD mice.
a Histoenzymology COX, NADH-TR, and SDH stainings of Icos-/- NOD and Icos+/+ NOD mice muscles at 8, 25, and 35 weeks of age (predisease, onset, and established disease stages) (representative images from n = 10 independent mice/genotype and age analyzed). For Icos-/- NOD mice at 35 weeks of age, two lower and two higher magnification representative images are shown. Arrows point at pale myofibers or dark fibers exhibiting loss of staining areas. Scale bars, 100 µm. Quantification of COXhigh fibers on images of entire quadriceps sections is shown on the right graph (n = 5 independent mice/genotype/age except for Icos-/- NOD mice at 35 weeks of age, with n = 8 independent mice). Statistical analysis was performed using the Two-way ANOVA test with Sidak’s post-hoc multicomparison. b Ex vivo analysis of oxygen consumption (respiratory control ratio) in Icos-/- NOD (n = 4 independent mice) and Icos+/+ NOD mice (n = 5 independent mice) skinned muscles fibers. Statistical analyses were performed using the Mann–Whitney test (two-tailed). Mean values ±  s.e.m are shown. c Electron microscopy representative images of muscles from Icos-/- NOD and Icos+/+ NOD mice. ac were repeated independently twice. Numbers on panels denote p values. Source data are provided as a Source Data file.
Fig. 4
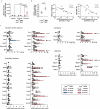
Fig. 4. Spatial transcriptome analysis were evocative of mitochondrial impairments in myofibers from Icos-/- NOD mice.
NanoString GeoMx Digital Spatial Profiling was used to perform whole transcriptome analysis. a Areas of illumination (AOIs) on the basis of morphology markers (CD45 and desmin). From n = 4 Icos+/+ NOD mice, n = 4 Regions Of Interest (ROIs, 1 ROI/mouse) for a total of n = 4 independent desmin+CD45- AOIs. From n = 6 Icos-/- NOD mice, two types of ROIs were selected according to their distance to an immune cell infiltrate: n = 6 ROIs (1 ROI/mouse) in proximity but not adjacent to an immune infiltrate cluster for a total of n = 6 independent desmin+CD45- AOIs (Icos-/- NOD PROX myofibers), and n = 8 ROIs (for 4 mice, 1 ROI/mouse and for 2 mice, 2 ROI/mouse) from Icos-/- NOD mice adjacent to a large immune cell infiltrate cluster for a total of n = 8 independent desmin+CD45- AOIs (Icos-/- NOD ADJ myofibers) and n = 8 independent desmin-CD45+ AOIs (Icos-/- NOD INF). b Principal component analysis (PCA) and t-Distributed Stochastic Neighbor Embedding (t-SNE) based on gene expression data of all AOIs. Each symbol represents one independent AOI. c Volcano plots and pathway analysis from statistical comparisons between Icos+/+ NOD vs. Icos-/- NOD PROX myofibers or d, Icos-/- NOD PROX vs. ADJ myofibers. e Histograms depicting normalized RNA counts for genes related to mitochondrial metabolism/structure (n = 4 independent AOIs from 4 Icos+/+ NOD mice, n = 6 independent AOIs ‘Icos-/- NOD PROX’ from 6 Icos-/- NOD mice and n = 8 independent AOIs ‘Icos-/- NOD ADJ’ from the same 6 Icos-/- NOD mice). Box plots bounds to 25th to 75th percentiles, with line at the median, and whiskers expand from min to max values. f Venn diagrams depicting dysregulated genes reported to be modulated by Type I, II and II IFNs as identified by the Interferome database. For c and d, red asterisks highlight mitochondria-related pathways. Q3 normalization was used for all data and a Linear Mixed Model (LMM) with Bonferroni-Hochberg (BH) correction was used for statistical analysis. Non adjusted p values of comparison between Icos-/- NOD PROX and ADJ are depicted. For pathway analysis, Gene Set Enrichment Analysis (GEA) was performed. Source data are provided as a Source Data file.
Fig. 5
Fig. 5. Muscles from Icos-/- NOD mice exhibit enhanced ROS production and transcriptomic oxidative stress features.
a Electron paramagnetic resonance (EPR) measurement of free radical (reactive oxygen species, ROS) production in the presence of ADP in muscle homogenates from Icos-/- NOD and Icos+/+ NOD mice at different time points corresponding to predisease, onset and established disease (for all Icos+/+ NOD mice n = 6, for Icos-/- NOD mice: n = 6 for 8 weeks, n = 7 for 25 weeks and n = 10 for 35 weeks). b Ex vivo analysis of H2O2 production in Icos-/- NOD (n = 5) and Icos+/+ NOD mice (n = 6) skinned muscles fibers in the presence of ADP. c RT-qPCR analysis targeted to oxidative stress-related genes of Icos-/- NOD (n = 8 for 8 and 25 weeks, n = 11 for 35 weeks) vs. Icos+/+ NOD (n = 8/group for 8 and 35 weeks and n = 6 for 25 weeks) mice (arb. units: arbitrary units). For a and b, mean values ± s.e.m are shown. For c, each box expands from max to min values and median are represented. For a and b, mean ± s.e.m and a representative experiment out of two are shown. For a, statistical analyses were performed using the Two-way ANOVA test with Sidak’s post-hoc multicomparison. For b, statistical analyses were performed using the Mann–Whitney test (two-tailed) (left) and correlations by Pearson’s test. For c, statistical analyses were performed using the Kruskal-Wallis test with uncorrected Dunn’s test (for each genotype, comparison shown in the graph corresponds to comparison with values from mice at 8 weeks). P values displayed correspond to the comparison of 25 and 35-week-old mice data of one given genotype with 8-week-old mice data of the same genotype. For all panels, n correspond to the number of independent mice. Numbers on panels denote p values. Source data are provided as a Source Data file.
Fig. 6
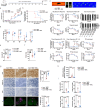
Fig. 6. Preventive NAC administration alleviates Icos-/- NOD mice myositis.
Icos-/- NOD mice were treated with NAC (2 g/L) from 14 weeks of age until 34 weeks of age (n = 10 mice/group). a Clinical score. b Percentage of disease-free mice. c Locomotor activity (Catwalk XT). d Grip strength. e Muscle strength after sciatic nerve stimulation. f Muscle weight. g Histopathological analysis. COX, NADH-TR, and SDH representative histoenzymology stainings (scale bars, 200 µm) and CD45/laminin immunofluorescence staining (scale bars, 1 mm). Graphs (right) depict the percentage of COXhigh fibers and the mean CD45-positively stained area with respect to total muscle area. Icos+/+ NOD (n = 5), Icos-/- NOD (n = 5), Icos-/- NOD + NAC (n = 7). h EPR measurement of ROS production (Icos+/+ NOD (n = 4), Icos-/- NOD (n = 10), Icos-/- NOD + NAC (n = 10)). i Chemokine and cytokine mRNA expressions (arb. units: arbitrary units). Icos+/+ NOD (n = 6), Icos-/- NOD (n = 6), Icos-/- NOD + NAC (n = 8). For a and c, statistical analysis was performed using Two-way ANOVA and Sidak’s multiple comparison post-hoc test. For b, Log-rank (Mantel Cox) test was used. For d, statistical analyses were performed using Two-way ANOVA with Sidak’s post-hoc test and for ei, statistical analyses were performed using the Kruskal–Wallis test with uncorrected Dunn’s multiple comparison test. For all panels, n values correspond to the number of independent mice. Data correspond to the mean values  ±  s.e.m and numbers on panels denote p values. For all, a representative experiment out of two is shown. Source data are provided as a Source Data file.
Fig. 7
Fig. 7. Bulk transcriptome analysis of dermatomyositis muscle biopsies and human myoblast culture with IFNγ suggest a causative link between this cytokine and mitochondrial dysfunction.
a Analysis of bulk transcriptomic data of muscle biopsies from 44 DM patients tested positive for myositis-specific autoantibodies against NXP2 (n = 14), TIF1γ (n = 12), Mi2 (n = 12), and MDA5 (n = 6), and from 33 histologically normal muscle biopsies focusing on mitochondrial genes (ATP8, ATP6, CO1, CO2, CO3, CYB, ND1ND2, ND3, ND4, ND4L, ND5, and ND6). NT normal tissue, DM dermatomyositis. n corresponds to independent subjects. Box plots bounds to 25th to 75th percentiles, with line at the median, and whiskers correspond to 1.5 times the interquantile range (1.5×[Q3-Q1]). b Correlation of the expression of these mitochondrial genes with IFNγ-induced genes (GBP2, IFI30, IFNG) and other genes related to myositis disease activity: immune (CD3E, CD4, CD8A, CD14, CD68, NCAM1), myofiber regenerative (MYOG, PAX7, MYH3, MYH8) and mature myofiber markers (ACTA1, MYH1, MYH2). c Effect of IFNγ (100 U/mL or 1000 U/mL) on mitochondrial gene expression in differentiating human skeletal muscle myoblasts (n = 2 wells/condition). Expression Trimmed Means of M values (TMM) of GBP2, IFI30, ATP8, ATP6, CO1, CO2, CO3, CYB, ND1, ND2, ND3, ND4, ND4L, ND5, and ND6. d Electron microscopy of myotubes treated with IFNγ and IFNγ + JAK inhibitors (ruxolitinib 1 µM or baricitinib 1 µM) (left, scale bar 1 µm). A zoomed insert on a representative mitochondrion is shown on the right (scale bar 0.2 µm). Images are representative of n = 3 wells/condition. For a, the Benjamini–Hochberg was used to adjust for multiple comparisons and p values are included in Supplementary Table 2. Source data are provided as a Source Data file.

References

    1. Lundberg IE, et al. Idiopathic inflammatory myopathies. Nat. Rev. Dis. Prim. 2021;7:86. doi: 10.1038/s41572-021-00321-x. - DOI - PubMed
    1. Ceribelli A, De Santis M, Isailovic N, Gershwin ME, Selmi C. The immune response and the pathogenesis of idiopathic inflammatory myositis: a critical review. Clin. Rev. Allergy Immunol. 2017;52:58–70. doi: 10.1007/s12016-016-8527-x. - DOI - PubMed
    1. Greenberg SA, et al. Interferon-alpha/beta-mediated innate immune mechanisms in dermatomyositis. Ann. Neurol. 2005;57:664–678. doi: 10.1002/ana.20464. - DOI - PubMed
    1. Pinal-Fernandez I, et al. Identification of distinctive interferon gene signatures in different types of myositis. Neurology. 2019;93:e1193–e1204. doi: 10.1212/WNL.0000000000008128. - DOI - PMC - PubMed
    1. Oddis CV, Aggarwal R. Treatment in myositis. Nat. Rev. Rheumatol. 2018;14:279–289. doi: 10.1038/nrrheum.2018.42. - DOI - PubMed

MeSH terms