. 2024 Jun 26;15(1):5410.
doi: 10.1038/s41467-024-49745-5.

METTL3-mediated chromatin contacts promote stress granule phase separation through metabolic reprogramming during senescence

Affiliations

METTL3-mediated chromatin contacts promote stress granule phase separation through metabolic reprogramming during senescence

Chen Wang et al. Nat Commun. .

Abstract

METTL3 is the catalytic subunit of the methyltransferase complex, which mediates m6A modification to regulate gene expression. In addition, METTL3 regulates transcription in an enzymatic activity-independent manner by driving changes in high-order chromatin structure. However, how these functions of the methyltransferase complex are coordinated remains unknown. Here we show that the methyltransferase complex coordinates its enzymatic activity-dependent and independent functions to regulate cellular senescence, a state of stable cell growth arrest. Specifically, METTL3-mediated chromatin loops induce Hexokinase 2 expression through the three-dimensional chromatin organization during senescence. Elevated Hexokinase 2 expression subsequently promotes liquid-liquid phase separation, manifesting as stress granule phase separation, by driving metabolic reprogramming. This correlates with an impairment of translation of cell-cycle related mRNAs harboring polymethylated m6A sites. In summary, our results report a coordination of m6A-dependent and -independent function of the methyltransferase complex in regulating senescence through phase separation driven by metabolic reprogramming.


Conflict of interest statement

The authors declare no competing interests.

Figures
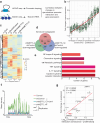
Fig. 1
Fig. 1. Chromatin contacts promote MTC-regulated genes during senescence.
a Schematic diagram showing genomic approaches employed: HiChIP-seq for monitor chromatin looping and fastGRO-seq for tracking nascent RNA transcription. b Pearson correlation between differences in chromatin contact numbers and alterations in nascent transcription in senescent cells relative to proliferating cells. n = 2 biologically independent fastGRO-seq experiments. The bottom and top edges of the box plot respectively represent the 25th and 75th percentiles, while the center refers to the median values of fold changes in gene expression. The whiskers extend to the minimum and maximum values within 1st and 99th percentiles range, respectively. c Heatmap showing profiles of nascent RNA transcription in proliferating and senescent cells with or without knockdown (KD) of METTL3 or METTL14. d Venn diagram showing overlapping of genes under indicated conditions. e KEGG pathway enrichment analysis showing enriched 40 genes depicted in (d) with pathways associated with SASP and metabolic process. f Mean density profiles of fastGRO reads for metabolic genes under indicated conditions. g Pearson correlation coefficient of 10 MTC-regulated genes exhibiting enhanced chromatin contacts was calculated between changes in chromatin contacts and differences in nascent transcription. P value was calculated using two-sided Pearson r analysis.
Fig. 2
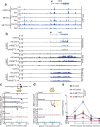
Fig. 2. HK2 upregulation by MTC depends on the chromatin looping during senescence.
a Tracks of publicly available H3K27Ac ChIP-seq (GSE74328), METTL3, and METTL14 Cut&Run-seq (GSE141992) showing peaks along HK2 genomic region in RAS-induced senescent cells and proliferating control cells. Arrow indicates the transcription start site (TSS) of HK2. b Tracks of fastGRO-seq, KAS-seq, and publicly available Pol II ChIP-seq (GSE141992) showing peaks surrounding HK2 genomic locus in proliferating and senescent cells with vector, METTL3, or METTL14 KD. Senescence was induced by 4-hydroxy-tamoxifen (4-OHT) in ER: RAS-expressing IMR90 cells. Arrow indicates the TSS of HK2. c Chromatin loops surrounding the HK2 locus indicated by H3K27ac HiChIP in proliferating and senescent cells with either vector, METTL3, or METTL14 KD. Tracks of publicly available ChIP-seq of H3K27Ac (GSE74328) in proliferating and senescent cells displayed peaks aligned the loop location as shown in H3K27Ac HiChIP. d Chromatin loops at the HK2 locus revealed by METTL3 HiChIP in proliferating and senescent cells, aligned with tracks of publicly available METTL3 Cut&Run-seq (GSE141992). Arrow indicates the loop from METTL3 HiChIP coinciding with the loop shown in (c). e 3C-qPCR analysis of the ligation frequency on the indicated HK2 gene loci in proliferating and senescent cells with either vector, METTL3 or METTL14 KD. 3C-qPCR primers were designed as illustrated in Fig. 2c with one forward primer anchoring at the promoter of HK2 and the reverse primers targeting the downstream enhancer region of HK2 according to the ChIP-seq peaks for H3K27Ac in control and senescent cells. NPC, non-peak control. Data represent the mean from n = 2 biologically independent experiments. Source data are provided as a Source Data file.
Fig. 3
Fig. 3. Hk2 is upregulated during mouse liver aging.
a Heatmaps showing quantitative analysis of ATAC-seq data in young and aged whole liver tissues with a false discovery rate (FDR) cutoff of <0.1. Red represents higher expression, while blue represents lower expression. Data represent two technical replicates of two biological replicates. b Tracks displaying ATAC-seq peak signals in aged liver tissues compared to the young. Arrows indicate the transcription start site of Hk2. c RT-qPCR analysis of Hk2 expression in young (n = 5) and aged (n = 5) hepatocytes. Data represent mean ± SD using a two-tailed Mann Whitney test. d Western blot analysis showing the expression level of Hk2 in young (n = 5) and aged (n = 5) whole liver tissues. Ponceau S staining was used as the internal control. e The band intensity of Hk2 compared to Ponceau S, as in (d), was quantified. Data represent mean ± SD using a two-tailed Mann Whitney test. f Western blot analysis showing the expression level of Hk2 in isolated hepatocytes from young (n = 5) and aged (n = 4) mice. Ponceau S staining was used as the internal control. g The band intensity of Hk2 compared to Ponceau S, as in (f), was quantified. Data represent mean ± SD values using a two-tailed Mann-Whitney test. Source data are provided as a Source Data file.
Fig. 4
Fig. 4. HK2 promotes purine metabolism during senescence.
a Five groups were analyzed by 13C glucose isotope tracing. 1, control proliferating cells. 2, RAS-induced senescent cells via 4-OHT with control shRNA (shControl). 3, senescent cells with shRNA targeting HK2 (shHK2). 4, senescent cells with shRNA targeting HK2 (shHK2) and rescued with wildtype Flag-HK2. 5, senescent cells with shRNA targeting HK2 (shHK2) and rescued with mutant Flag-HK2. Note that the HK2-overexpressing plasmid is resistant to shHK2 due to silent mutation. IMR90 cells with or without 4-OHT induction of RAS expressing shControl or shHK2 with or without rescue by ectopic expression of wildtype or catalytic-mutant HK2 (D209AD657A) were analyzed for expression of the indicated proteins by western blot on Day 9. b Distribution of 13C isotopologues of Inosine monophosphate (IMP), Adenosine monophosphate (AMP), Adenosine diphosphate (ADP), Adenosine diphosphate (ATP), Adenosine, and Inosine at indicated groups. Data represent mean ± SEM of n = 3 biologically independent experiments. c Boxplots showing the labeled fractions of IMP (M + 5), AMP (M + 5), ADP (M + 5), ATP (M + 5), Adenosine (M + 5), and Inosine (M + 5) under indicated conditions. Data represent mean ± SEM of n = 3 biologically independent experiments. P values were calculated using a two-tailed Student’s t test. d Distribution of 13C isotopologues of Ribose-5-phosphate (R-5-P) at indicated groups. Data represent mean ± SEM of n = 3 biologically independent experiments. P values were calculated using a two-tailed Student’s t test. e Diagram showing labeled metabolites through 13C glucose isotope tracing. Black circles represent 13C atoms. G-6-P Glucose-6-phosphate, R-5-P Ribose-5-phosphate, IMP inosine monophosphate, AMP Adenosine monophosphate, ADP Adenosine diphosphate, ATP Adenosine triphosphate. Source data are provided as a Source Data file.
Fig. 5
Fig. 5. HK2 promotes phase separation during senescence in an enzymatic activity -dependent manner.
a Immunofluorescence (IF) of control and oncogene (RAS or BRAF)-induced senescent cells with antibodies targeting YTHDF3 and TIAR. 4′,6-diamidino-2-phenylindole (DAPI) counterstaining was used to visualize the nuclei. b Quantification of the percentage of cells with phase separation events at indicated conditions, as in a, was determined (n > 200 cells over three independent experiments). P values were calculated using a two-tailed Student’s t test. Error bars represent mean with SD. c Quantification of the percentage of cells with phase separation events by antibodies targeting control IgG, YTHDF1, YTHDF2, and YTHDF3 in RAS-induced senescent cells was determined (n > 200 cells over three independent experiments). P values were calculated using a two-tailed Student’s t-test. Error bars represent mean with SD. d IF of control and RAS-induced senescent cells with antibodies targeting YTHDF3 and TIAR at indicated conditions. DAPI counterstaining was used to visualize the nuclei. Rectangle represented the area that was shown on the right with 5X magnification, showing cases of phase separation. e Quantification of the percentage of cells at indicated conditions, as in (d), was determined (n > 200 cells over three independent experiments). P values were calculated using a two-tailed Student’s t test. Error bars represent mean with SD. f IF of RAS-induced senescent cells with antibodies targeting YTHDF3 and TIAR at indicated conditions. DAPI counterstaining was used to visualize the nuclei. g Quantification of the percentage of cells with phase separation events at indicated conditions, as in (f), was determined (n > 200 cells over three independent experiments). P values were calculated using a two-tailed Student’s t test. Error bars represent mean with SD. h IF of RAS-induced senescent cells with antibodies targeting YTHDF3 and TIAR when treated with DMSO or METTL3 inhibitor (2.5 μM STM2457) for 48 h. i Quantification of the percentage of cells with phase separation events at indicated conditions, as in (h), was determined (n > 200 cells over three independent experiments). P values were calculated using a two-tailed Student’s t test. Error bars represent mean with SD. Scale bars, 20 μm. Source data are provided as a Source Data file.
Fig. 6
Fig. 6. HK2 maintains stable cell growth arrest of senescent cells by modulating cell-cycle related mRNAs with polymethylated m6A sites.
a Venn diagram illustrates the enrichment of RNAs with increased polymethylated m6A signals from publicly available m6A-seq when comparing senescent to control cells (GSE141993), overlapping with downregulated transcripts from publicly available RNA-seq (GSE141991). The highest m6A peak signal among all polymethylated m6A signals was used for comparison. b Pathway enrichment analysis showing enriched 35 genes depicted in (a) with pathways associated with cell cycle, cell division, and mitosis. c, Tracks of publicly available m6A-seq (GSE141993) from control (Cont) and senescent (Sen) cells showing peaks within the genomic locus of CDCA8, CENPE, ERCC6L, SMC2, SMC3, KIF16A and CCAR1, indicating polymethylated m6A signals. The m6A signal was normalized to the corresponding input. d Tracks (upper panel) of publicly available m6A-seq (CRA005942) in primates showing the median m6A peak signals within the SMC2 genomic locus from either the young or aged group. Heatmap (lower panel) revealed the distribution of the m6A peak signals from young (n = 8) and aged (n = 8) liver tissue in primates. The m6A signal was normalized to the corresponding input. e UMAP plot of publicly available scRNA-seq (GSE197017) from mouse skeletal muscle tissue showed clustering of cellular components of control (Non Sen) and senescent cells that were differentiated by CD45 marker (CD45+ Sen and CD45- Sen). UMAP projections were shown by Feature Plots depicting Cxcl1, Hk2, and Cdca8 expression in single cells. f Translational efficiency of mRNAs including CDCA8, CENPE, and SMC2 was detected by polysome profiling. Translational efficiency is normalized to free mRNA level for each gene. Data represent mean ± SD of n = 3 biologically independent experiments. P values were calculated using a two-tailed Student’s t test. g Senescent cells were co-stained by SPiDER SA-β Gal, and the LIVE/DEAD Near-IR dead cell stain kit then analyzed by flow cytometry under indicated conditions. h Quantification of dead senescent cells at indicated conditions, as in (g). Data represent mean ± SD of n = 3 biologically independent experiments. P values were calculated using a two-tailed Student’s t test. Source data are provided as a Source Data file.

References

    1. Kumari R, Jat P. Mechanisms of cellular senescence: cell cycle arrest and senescence associated secretory phenotype. Front. Cell Dev. Biol. 2021;9:645593. doi: 10.3389/fcell.2021.645593. - DOI - PMC - PubMed
    1. Narita M, et al. A novel role for high-mobility group a proteins in cellular senescence and heterochromatin formation. Cell. 2006;126:503–514. doi: 10.1016/j.cell.2006.05.052. - DOI - PubMed
    1. Coppe JP, Desprez PY, Krtolica A, Campisi J. The senescence-associated secretory phenotype: the dark side of tumor suppression. Annu. Rev. Pathol. 2010;5:99–118. doi: 10.1146/annurev-pathol-121808-102144. - DOI - PMC - PubMed
    1. Hao X, Wang C, Zhang R. Chromatin basis of the senescence-associated secretory phenotype. Trends Cell Biol. 2022;32:513–526. doi: 10.1016/j.tcb.2021.12.003. - DOI - PMC - PubMed
    1. Ritschka B, et al. The senescence-associated secretory phenotype induces cellular plasticity and tissue regeneration. Genes Dev. 2017;31:172–183. doi: 10.1101/gad.290635.116. - DOI - PMC - PubMed