. 2024 Jun 26;15(1):5402.
doi: 10.1038/s41467-024-49773-1.

Microglia contribute to neuronal synchrony despite endogenous ATP-related phenotypic transformation in acute mouse brain slices

Affiliations

Microglia contribute to neuronal synchrony despite endogenous ATP-related phenotypic transformation in acute mouse brain slices

Péter Berki et al. Nat Commun. .

Abstract

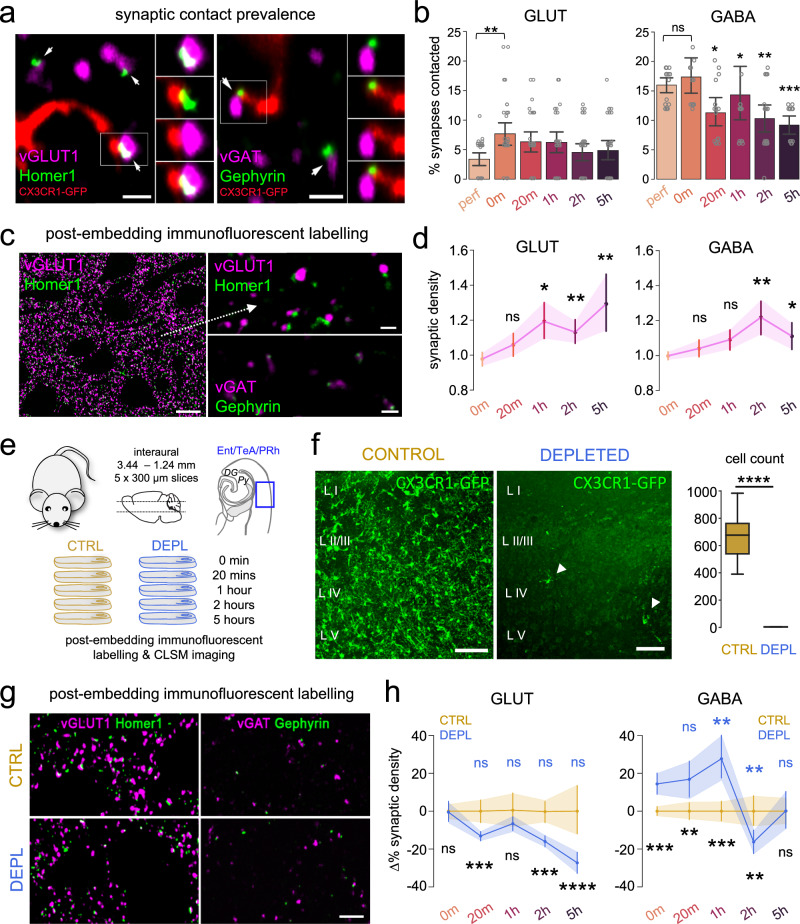
Acute brain slices represent a workhorse model for studying the central nervous system (CNS) from nanoscale events to complex circuits. While slice preparation inherently involves tissue damage, it is unclear how microglia, the main immune cells and damage sensors of the CNS react to this injury and shape neuronal activity ex vivo. To this end, we investigated microglial phenotypes and contribution to network organization and functioning in acute brain slices. We reveal time-dependent microglial phenotype changes influenced by complex extracellular ATP dynamics through P2Y12R and CX3CR1 signalling, which is sustained for hours in ex vivo mouse brain slices. Downregulation of P2Y12R and changes of microglia-neuron interactions occur in line with alterations in the number of excitatory and inhibitory synapses over time. Importantly, functional microglia modulate synapse sprouting, while microglial dysfunction results in markedly impaired ripple activity both ex vivo and in vivo. Collectively, our data suggest that microglia are modulators of complex neuronal networks with important roles to maintain neuronal network integrity and activity. We suggest that slice preparation can be used to model time-dependent changes of microglia-neuron interactions to reveal how microglia shape neuronal circuits in physiological and pathological conditions.


Conflict of interest statement

The authors declare no competing interests.

Figures

Fig. 1
Fig. 1. Microglia gradually migrate towards the surface of acute slice preparations in a P2Y12R- and CX3CR1-dependent manner.
a CX3CR1+/GFP littermates (males) were used to create slice preparations and immersion-fixed at different time-points, re-sectioned, and measured in Ent/TeA/PRh areas. b Cross-sections preserving top/bottom directionality. Scale: 500 µm (one independent experiment, N = 3 animal, n = 3 slices/animal). c A grid (violet) was used for quantification of cell body/process distributions. Scale: 100 µm. d Representative sections of images. Scale: 50 µm. Cell body % respective to grid layers. N = 3 animal, n = 3 slices/animal; P35 days; mean ± SEM, two-way ANOVA, Tukey’s multiple comparison, F(24, 408) = 2.305, p = 0.0005. Source data are provided as a Source Data file. e Cell body distribution changes in top/bottom layers (blue/yellow). N = 3 animal, n = 3 slices/animal; P35 days; mean ± SEM. Blue stat.: compared to 0-min, black stat.: top/bottom means, two-way ANOVA, Tukey’s multiple comparisons, F(24, 408) = 2.305, p = 0.0005. Source data are provided as a Source Data file. f Cell body distribution changes (control/PSB-treated/CX3CR1−/−). Ctrl: N = 3 animal, n = 3 slices/animal; PSB: N = 2 animal, n = 3 slices/animal; CX3CR1−/−: N = 3 animal, n = 3 slices/animal; P35 days; mean ± SEM; two-way ANOVA, Tukey’s multiple comparison, F(2,60) = 13.65, p < 0.0001. Source data are provided as a Source Data file. g Same as in d respective to processes, two-way ANOVA, Tukey’s multiple comparisons, F(24,408) = 4,766, p < 0.0001. Source data are provided as a Source Data file. h Same as in e respective processes, two-way ANOVA, Tukey’s multiple comparison test, F(24,408) = 4,766, p < 0.0001. Source data are provided as a Source Data file. i Same as in f regarding processes, two-way ANOVA, Tukey’s multiple comparison tests, F(2,60) = 17.23, p < 0.0001. Source data are provided as a Source Data file. j CX3CR1+/GFP mice (males, P45–80 days) were used to create slices and measured via 2P imaging. k Supplementary Movie 1: translocation of cell body/processes (dot) towards the surface (stripped line). Scale: 10 µm. l Left: minimum required displacement (µm) towards the top measured from bottom/middle (gold/grey). Right: area covered by processes at 0-min/5-h (orange/purple). N = 3 animal, n = 3 slices/animal, P35 days; Mann–Whitney (two-sided), p < 0.0001. Boxes: interquartile range, whiskers: min–max, vertical bar: median. Source data are provided as a Source Data file.
Fig. 2
Fig. 2. Microglia undergo rapid, progressive morphological changes in acute slices in a P2Y12R- and CX3CR1-dependent manner.
a Supplementary Movie 3. CX3CR1+/GFP signal of microglia after slice preparation. Scale: 10 µm. b Acute slices obtained from CX3CR1+/GFP (male littermates). Microglia were measured in whole cell patch-clamp, targeted ~50 µm below the surface (CA2-3 stratum radiatum). c Resting membrane potential(top)/input resistance(bottom) during recovery. N = 10 animal (7 males, 3 females), n = 5 slices/animal, P90 days; N = 158 cells, one-way ANOVA, Dunnett’s multiple comparisons, F(4,150) = 9.768, p < 0.0001 (top), ns (bottom). Boxes: interquartile range, whiskers: min–max, vertical bar: median. Source data are provided as a Source Data file. d Acute slices were obtained from CX3CR1+/GFP (male littermates) and immersion-fixed after different time-points (blue arrow), or slices were obtained from perfusion-fixed animals (orange arrow). e Slices were re-sectioned (middle 100 µm), and measurements were performed in Ent/TeA/PRh and CA2-3 stratum radiatum. Stained images (left, Scale: 20 µm) were analysed: raw z-stack (1.), image segmentation (2.), cell segmentation (3.), cell body(yellow)/processes(blue). Obtaining skeleton (4.) 3D-models (right, bar: 10 µm) (two independent experiments, N = 4–4 animal, n = 3 slices/animal). f Analysed confocal images (Scale: 50 µm). g Top: individual microglia (yellow: cell body; blue, purple: processes; Scale: 5 µm). Bottom: skeletons (violet, cell body: red dot, Scale: 5 µm). h Top: sphericity in cortex (blue) and in hippocampus (red). Bottom: # process endings/cell. N = 8 animals, P35 days, one-way ANOVA, Dunnett’s multiple comparison, p < 0.0001 (comparisons from 20 min/5 h are made to 0 min) Boxes: interquartile range, whiskers: min–max, vertical bar: median. All p and F values can be found in Supplementary Table 2. Source data are provided as a Source Data file. i Same as in h from P95 animals. N = 5 animals, P95 days, one-way ANOVA, Dunnett’s multiple comparisons, p < 0.0001. Source data are provided as a Source Data file. j Sphericity/# process endings in CX3CR1−/− (green) or P2Y12R−/− (purple) and WT (grey), N = 3 animal/condition (only males), n = 5 slices/animal, P35 days, two-way ANOVA with Tukey’s multiple comparison test, p < 0.0001. Boxes: interquartile range, whiskers: min–max, vertical bar: mean. All p and F values can be found in Supplementary Table 2. Source data are provided as a Source Data file.
Fig. 3
Fig. 3. Migration and rapid phenotype changes of microglia during the incubation process do not depend on cutting techniques.
a Schematics of experiment. Comparison of slice preparation techniques of independent laboratories. Laboratories received a protocol to synchronize acute slice fixation timepoints and fixation methods, while using their own native acute slice preparation method. b Measurements were performed in Ent/TeA/PRh cortical areas, and CA2-3 stratum radiatum of the hippocampus from C57Bl/6J animals (only males). c Acute slice preparations were sent to our laboratory after fixation and preparation for transport (see the “Methods” section), where they were treated together during immunostaining, imaging, and morphological analysis. d Maximum intensity projections of confocal images showing microglia (IBA-1) in the hippocampus (top, red) and in the cortex (bottom, blue). Scale bar: 50 µm. (One independent experiment (N = 3-2-2 animal, n = 1 slice/animal/timepoint). e Quantification of extracted morphological features across different laboratories regarding sphericity in hippocampus (left) and in cortex (right). N = 3 animal/lab1; 2 animal/lab#2; 2 animal/lab#3; n = 3 slices/animal, P65 days, one-way ANOVA with Dunnett’s multiple comparison test, p < 0.0001. Boxes: interquartile range, whiskers: min–max, vertical bar: mean. All p and F values can be found in Supplementary Table 3. Source data are provided as a Source Data file. f Same as in d, regarding number of ending nodes/cell in cortex (left) and in hippocampus (right). N = 3 animal/lab1; 2 animal/lab#2; 2 animal/lab#3; n = 3 slices/animal, P65 days, median ± SEM, one-way ANOVA with Dunnett’s multiple comparison test, p < 0.0001. Boxes: interquartile range, whiskers: min–max, vertical bar: mean. All p and F values can be found in Supplementary Table 3. Source data are provided as a Source Data file. g Bar plots representing measured changes of microglial cell body numbers (left) and area covered by processes (right) in percentages calculated between 0 min and 5 h across the top and bottom layers of acute slice preparations. N = 3 animal/lab1; 2 animal/lab#2; 2 animal/lab#3; n = 3 slices/animal, P65 days, median ± SEM, two-way ANOVA with Dunnett’s multiple comparison test, p < 0.0001, mean ± SEM. All p and F values can be found in Supplementary Table 3. Source data are provided as a Source Data file.
Fig. 4
Fig. 4. Slice cutting induced rise in extracellular ATP followed by sustained induction of focal ATP events characterize acute brain slices.
a Ex-vivo 2P imaging of the ATP sensor (GRABATP) in VGluT1 neurons, followed by z-stack acquisition. (N = 3 animals, only males, P70 days). b Representative images of the videos after cutting. Scale: 20 µm. c MFI data showing a continuous decrease of extracellular ATP signal. Two-way RM ANOVA, Time: F(1.169, 21.04) = 67.03, p < 0.0001. Regions: F(1, 18) = 0,3801, p = 0,5452, mean ± SEM. Source data are provided as a Source Data file. d Side-views of Z-stacks: elevated ATP at the slice surface (0–25 µm, left). Horizontal scale: 20 µm, vertical scale: 125 µm. Occurrence of ATP flashes (right), timeline of two ATP events (bottom, 10 s/image). Scale: 20 µm. e MIP images from 10-min imaging before/after (1–2 min) deliberate incisions with sterile blades (controlled secondary injury), ~4 h after cutting, resulting in elevated ATP. Scale: 500 µm. f Quantification of d), ATP levels follow a time-dependent decrease (5-h vs. to 0-1 h). Two-way RM ANOVA, Tukey’s multiple comparison, F(4,64) = 8.267, p < 0.0001, mean ± SEM (N = 3 animals, n = 3 slices, 4 ROIs/region) Source data are provided as a Source Data file. gF/F graphs depict ATP event activity as shown in (d) and (e). Source data are provided as a Source Data file. h Intensity/incidence of ATP events in cortex (n = 360) vs. hippocampus (n = 181). Number of ATP events/10-min imaging/slice. Mann–Whitney (two-sided), p < 0.0001, median ± SD (left); unpaired t-test (two-sided), p = 0.0258, mean ± SEM (right). Source data are provided as a Source Data file. i k-means clustering reveals two different event clusters. Size of dots reflect size of flashes/surges (black indication). See also Supplementary Fig. 4d (N = 3 animals, n = 10 slices) Source data are provided as a Source Data file. j ATP flash/surge characteristics, Mann–Whitney (two-sided), p < 0.0001 (N = 3 animals, n = 10 slices, 5–5 slices/timepoint). Boxes: interquartile range, whiskers: min–max, vertical bar: median. Source data are provided as a Source Data file. k Cluster prevalence changes over time after slice preparation. Note: substantial increase of ATP surge prevalence 1–2  h after slice cut (N = 3 animals, n = 10 slices, 5–5 slices/timepoint). Source data are provided as a Source Data file.
Fig. 5
Fig. 5. Focal ATP events drive microglial process motility in acute brain slices in a P2Y12R- and CX3CR1-dependent manner.
a AAV-induced neuronal expression of ATP sensors (Cx3cr1-cre/tdTomato mice, N = 9 animals, only males, P70–110 days). Control (n = 6 slices), PSB0739-treated (4 µM; n = 8 slices) or AZD8797-treated (n = 5 slices). b k-means clustering. Dot sizes represent the area of events (scale in right) Grey: control, pink: PSB, green: AZD show flashes, black: control; purple: PSB; yellow: AZD show surges (N = 9 animals, n = 6 ctrl, 8 PSB, 5 AZD treatment). Source data are provided as a Source Data file. c Comparison of ATP flash/surge characteristics of control, PSB0739 and AZD8797 treatment. Two-way ANOVA, Tukey’s multiple comparisons, Intensity: F(1, 206) = 92.31, Duration: F(1, 206) = 133, Area: F(1, 206) = 115.8, p < 0.0001 (N = 9 animals, n = 6 ctrl, 8 PSB, 5 AZD-treated slices). Boxes: interquartile range, whiskers: min–max, vertical bar: mean. Source data are provided as a Source Data file. d ATP events (green) and process displacement (red, Supplementary Movie 7). ROIs indicate ATP event areas at maximum intensity. Scale bars: 10 µm. e ΔF/F traces of ATP sensor activity (green) and superimposed process accumulation (red) within the ATP flash territories, demarcated in d). f Left: Microglia process recruitment to flashes/surges represented as tdTomato ∆%MFI. Right: Latencies of process movements (N = 9 animals, n = 6 ctrl, 8 PSB, 5 AZD-treated slice), measured as indicated on (e). Kruskal–Wallis test with Dunn’s multiple comparison test, ∆%MFI: p < 0.0001 (left), Latency: p = 0.19 (right). Boxes: interquartile range, whiskers: min–max, vertical bar: median. Source data are provided as a Source Data file. g Directed movements (dm) early (2–3 h) vs. late (3–6 h) stages after slice preparation (N = 9 animals, n = 6 ctrl, 8 PSB, 5 AZD treated slices). Source data are provided as a Source Data file. h Distribution of process movement prevalence in response to flashes/surges (9 animals, 6 ctrl, 8 PSB, 5 AZD treated slice). Light colours (grey: control; pink: PSB; green: AZD) represent movement towards flashes, darker colours (black: control; purple: PSB; yellow: AZD) represent movement towards surges (N = 9 animals, n = 6 ctrl, 8 PSB, 5 AZD-treated slices). Source data are provided as a Source Data file.
Fig. 6
Fig. 6. Microglial P2Y12R undergoes rapid downregulation during the incubation process, paralleled by changes in microglia–neuron interactions.
a CLSM z-stacks depicting microglial cells with pre-embedding immunofluorescent labelling (IBA1, red; P2Y12 receptors, white) before (0 min) and after 1 h of incubation. Scale bar: 3 µm (One independent experiment, N = 1 animal, n = 1 slice/animal, representative experiment). b CX3CR1+/GFP littermates (N = 3 animals, only males, P35 days) were used to create slice preparations, immersion-fixed at different time-points. Measurements were performed in Ent/TeA/PRh areas. c After fixation, slices were dehydrated and embedded into resin blocks (1), ultrathin slices were cut onto glass slides (2) and resin etching was followed by post-embedding P2Y12R immunofluorescent labelling (3). Finally, z-stack images were gathered from preparations via high-resolution CLSM (4). Each ultrathin section represents the whole cross-section of one acute slice (4), measurement can be done throughout the whole depth range of acute slices within a single image plane. d P2Y12R labelling via the post-embedding technique. Microglial cell bodies (left), thick processes (middle), thin processes (right) and P2Y12R labelling (top) or P2Y12R labelling only (bottom). Scale: 2 µm (one independent experiment from N = 3 animal, n = 3 slices/animal). e Quantification of P2Y12R labelling intensity (arbitrary unit, see the “Methods” section) in the cell body (left), thick processes (middle) and thin processes (right.) N = 3 animal, P35 days; n = 3 slices/animal; One-way ANOVA, Dunnet’s multiple comparisons, Body: F(4, 40) = 2.746, p = 0.04 (left), Thick: F(4, 62) = 9.698, p < 0.0001 (middle), Thin: F(4, 154) = 13.09, p < 0.0001 (right), mean ± SEM. Comparisons are made to 0 min values. Source data are provided as a Source Data file. f Representative section of MIP image created from z-stacks used to quantify microglial contact prevalence/process coverage on neuronal soma. White arrows: areas where microglial processes are likely to form contacts on neuronal soma (overlap of microglia and Kv2.1 labelling, Scale: 5 µm). CX3CR1+/GFP littermates (only males, P65 days). g Quantification of contact prevalence (left) and coverage (right) of neuronal soma by microglial processes (N = 3 animals, n = 7–9 regions of interest analysed/timepoint, 30-60 neurons/timepoint P65 days) One-way ANOVA, Dunn’s multiple comparisons, F(5,36) = 9.118, p < 0.0001 (left), F(5,235) = 3.409, p = 0.0054 (right), mean ± SEM. Source data are provided as a Source Data file.
Fig. 7
Fig. 7. Rapid changes in microglia–synapse interactions and microglia-dependent synaptic sprouting characterize acute slices.
a Single image planes from confocal z-stacks used to quantify contact prevalence of microglial processes on glutamatergic(left)/GABAergic(right) synapses. (Insets show channel pairs from boxes, pre- and postsynaptic marker, microglia and postsynaptic marker, microglia, and presynaptic marker, merged.) Arrows: individual synapses contacted by processes (bars: 1 µm). CX3CR1+/GFP littermates were used (only males, P65 days). b Microglial contact prevalence onto glutamatergic(left)/GABAergic(right) synapses (N = 3 animals, n = 15–18 ROI analysed/timepoint, P65 days) Kruskal–Wallis, Dunn’s multiple comparisons, p = 0.019 (left), p < 0.0001 (right), mean ± SEM (compared to 0 min). Source data are provided as a Source Data file. c MIP images of confocal z-stacks used to quantify glutamatergic/GABAergic synaptic densities, created with post-embedding technique. Glutamatergic (left, bar: 5 µm) zoomed-in insets (right, top; bar: 1 µm), GABAergic (right, bottom; bar: 1 µm) labelling. d Synaptic density changes of glutamatergic (left)/GABAergic (right) synapses during incubation (N = 6 animal, n = 6 regions analysed/slice/timepoint, P65 days); Kruskal–Wallis, Dunn’s multiple comparisons, p = 0.0024, mean ± SEM (compared to 0 min). Source data are provided as a Source Data file. e CX3CR1+/GFP littermates (only males) were used to create control (CTRL; N = 3, P65 days; brown) and microglia depleted (DEPL; N = 3, P65 days; blue) subgroups. Slice preparations were obtained from both groups and immersion-fixed at different timepoints. f MIP images from control(left) or depleted(middle) slices (scale: 100 µm). Quantification comparing # of microglial cells in control(brown)/depleted(blue) slices (N = 6 animal/condition, P65 days); Mann–Whitney (two-sided), p < 0.0001, median ± SD. Boxes: interquartile range, whiskers: min–max, vertical bar: median. Source data are provided as a Source Data file. g MIP images created from confocal z-stacks used to compare densities of glutamatergic (left)/GABAergic (right) synapses in control (top) or depleted (bottom) slices (bar: 5 µm). h Comparison of glutamatergic(left)/GABAergic(right) density changes during incubation. (averages of control (brown, data also shown in d) vs. depleted condition (blue) (N = 6 animal/condition, n = 6 regions analysed/slice/timepoint, P65 days); Two-way RM ANOVA, Tukey’s multiple comparisons, F(4,184) = 4.668, p = 0.0013 (left), F(4,184) = 19.08, p < 0.0001 (right), mean ± SEM. Source data are provided as a Source Data file.
Fig. 8
Fig. 8. The absence of microglia, microglial P2Y12 or CX3CR1 dysregulates sharp wave-ripple activity.
a Acute hippocampal slices were obtained from control/experimental groups. Slices were measured in a pairwise manner, SWR activity was obtained from CA3 pyr. via LFP recordings. Depletion: CX3CR1+/GFP littermates (only males) were subjected to 3 weeks of either control/ PLX3397 diet (CTRL; N = 6, P65; gold, DEPL; N = 6, P65; blue) Knockouts: C57Bl/6J (N = 5 and N = 6) vs. P2Y12KO (N = 5) or CX3C1 KO (N = 6), P65 days). b Representative LFP recordings (left; bar: 30 s, 50 µV), average SWR events (right, N = 50, Scale: 100 ms, 25 µV) from control (top, gold) and depleted (bottom, blue) slices. Grey lines: individual SWR events. c Same as in (b), control (top, gold) and P2Y12R-KO (bottom, purple) slices. d Same as in (b), control (top, gold) and CX3CR1-KO (bottom, green) slices. e Pie-charts: SWR activity occurrence in control (gold), depleted (blue), P2Y12-KO (purple), and CX3CR1-KO (green) conditions. Grey: no spontaneous SWR activity (N = 6 ctrl vs. 6 depl animal, N = 5 ctrl vs. 5 P2Y12 KO animal, N = 5 ctrl vs. 5 CX3CR1 KO animal, 5 slices/animal, P65 days). f Quantification of SWR amplitude (left), rate (middle) and Ripple amplitude (right) from control (gold), depleted (blue), P2Y12 KO (purple), and CX3CR1 KO (green) slices. (N = 6 ctrl vs. 6 depl animal, N = 5 ctrl vs. 5 P2Y12 KO, N = 5 ctrl vs. 5 CX3CR1 KO animal, 5 slices/animal, P65 days); Mann–Whitney (two-sided), p < 0.001. (Each group had its own controls from littermates.) Boxes: interquartile range, whiskers: min-max, vertical bar: median. Source data are provided as a Source Data file. g. In vivo experiment. 64-channel probes were chronically implanted into the hippocampus of mice and recorded in their home cage. After the depletion of microglia (same mice), animals were re-measured. Example of a 1 s multiple channel recording from stratum oriens (top) and stratum lacunosum-molaculare (bottom). 200 ms signal from one channel corresponding to pyramidal-cell layer, showing an identified ripple-event. h Quantification of in vivo ripple parameters. Paired t-test (two-sided), p < 0.01 (N = 8 animals, P93–136 days). Boxes: range, whiskers: min–max, vertical bar: mean. Source data are provided as a Source Data file.

References

    1. Andersen P. Brain slices—a neurobiological tool of increasing usefulness. Trends Neurosci. 1981;4:53–56. doi: 10.1016/0166-2236(81)90019-9. - DOI
    1. Yamamoto C, McIlwain H. Electrical activities in thin sections from the mammalian brain maintained in chemically-defined media in vitro. J. Neurochem. 1966;13:1333–1343. doi: 10.1111/j.1471-4159.1966.tb04296.x. - DOI - PubMed
    1. Brahma B, Forman RE, Stewart EE, Nicholson C, Rice ME. Ascorbate Inhibits Edema in Brain Slices. J. Neurochem. 2000;74:1263–1270. doi: 10.1046/j.1471-4159.2000.741263.x. - DOI - PubMed
    1. Richerson GB, Messer C. Effect of composition of experimental solutions on neuronal survival during rat brain slicing. Exp. Neurol. 1995;131:133–143. doi: 10.1016/0014-4886(95)90015-2. - DOI - PubMed
    1. Ting JT, Daigle TL, Chen Q, Feng G. Acute brain slice methods for adult and aging animals: application of targeted patch clamp analysis and optogenetics. Methods Mol. Biol. 2014;1183:221–242. doi: 10.1007/978-1-4939-1096-0_14. - DOI - PMC - PubMed