. 2024 Jun 26;15(1):5413.
doi: 10.1038/s41467-024-49820-x.

Fructooligosaccharides benefits on glucose homeostasis upon high-fat diet feeding require type 2 conventional dendritic cells

Affiliations

Fructooligosaccharides benefits on glucose homeostasis upon high-fat diet feeding require type 2 conventional dendritic cells

Adélaïde Gélineau et al. Nat Commun. .

Abstract

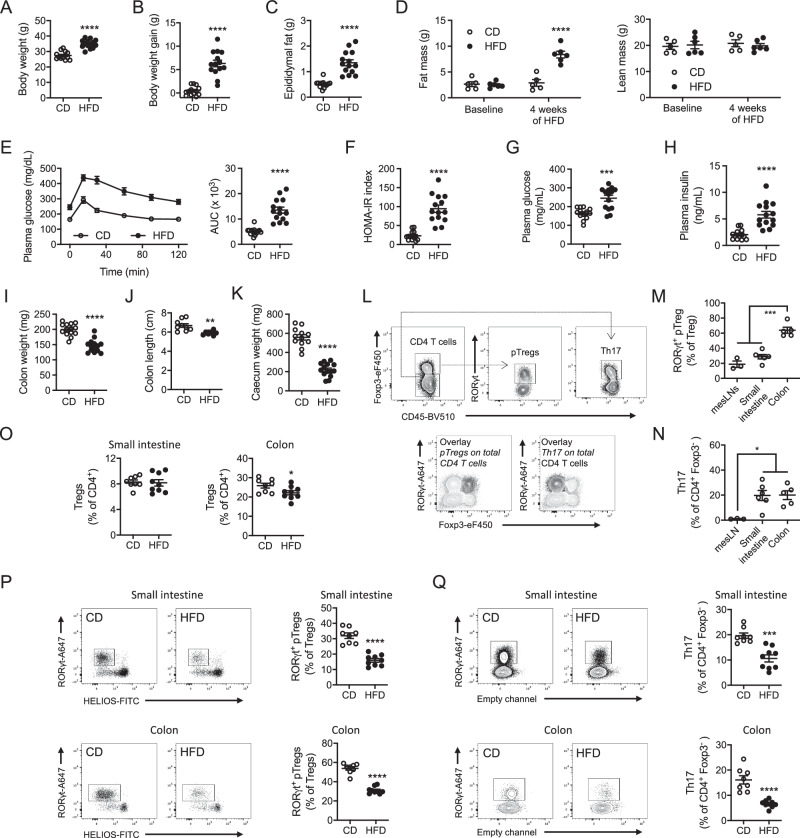
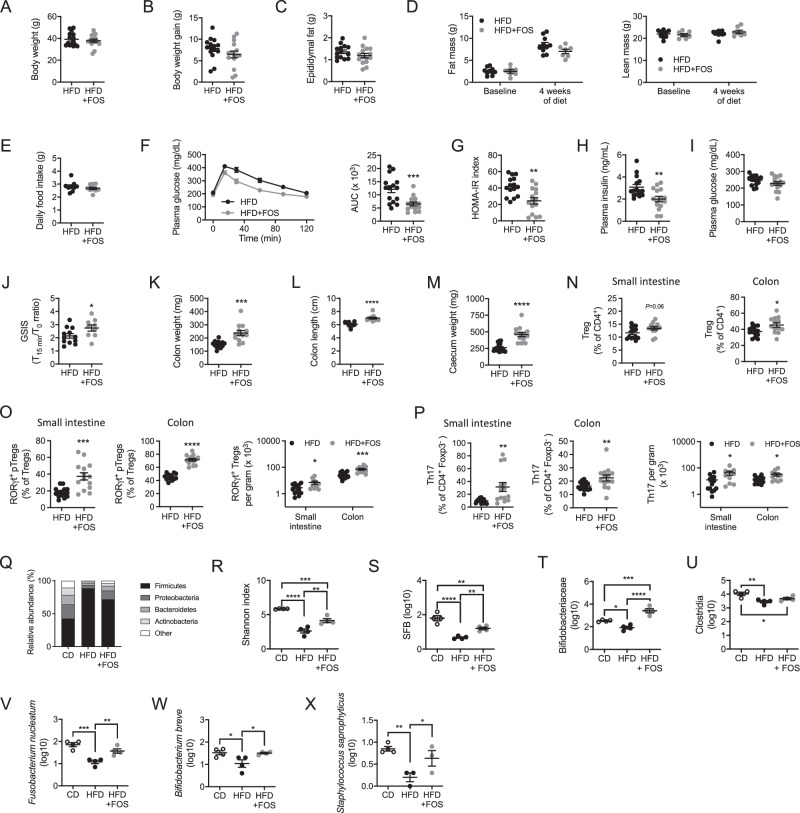
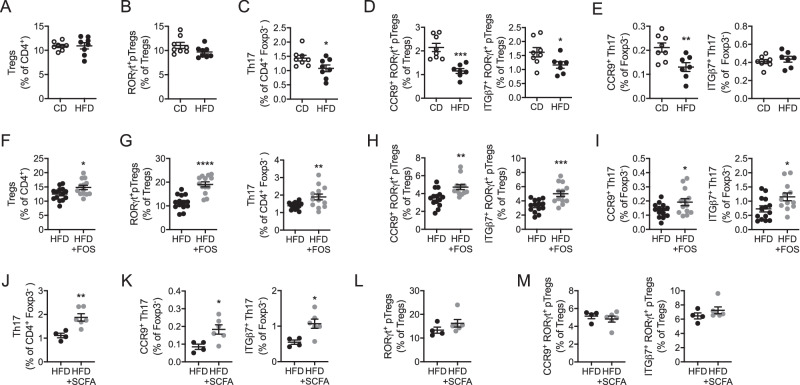
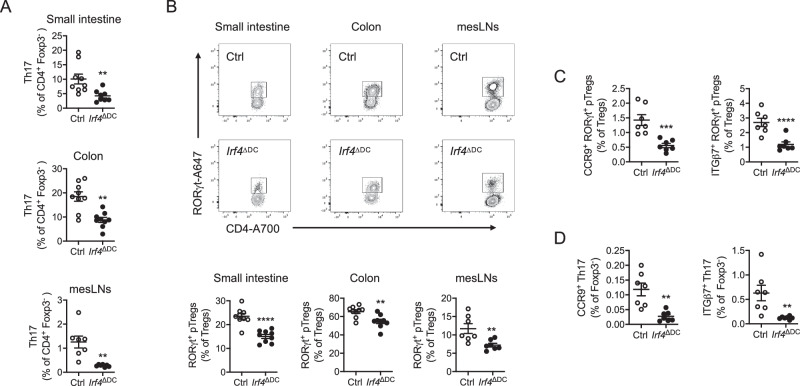
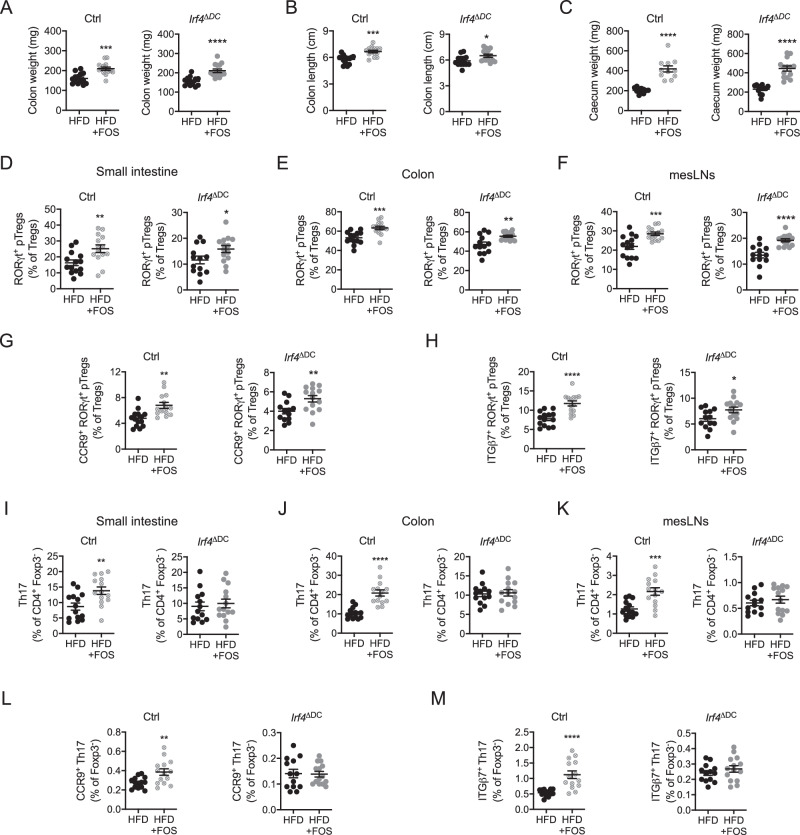
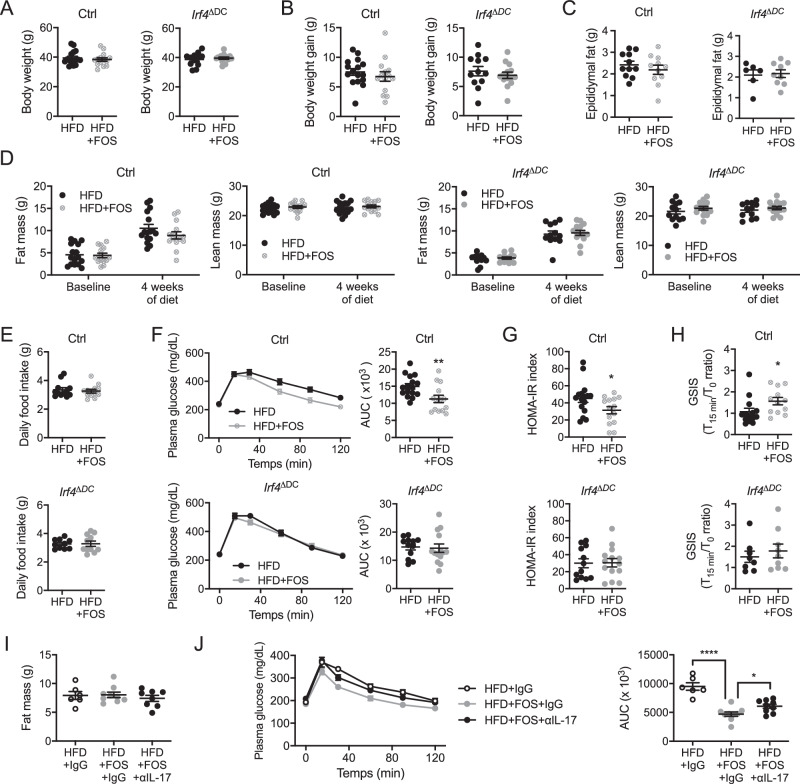
Diet composition impacts metabolic health and is now recognized to shape the immune system, especially in the intestinal tract. Nutritional imbalance and increased caloric intake are induced by high-fat diet (HFD) in which lipids are enriched at the expense of dietary fibers. Such nutritional challenge alters glucose homeostasis as well as intestinal immunity. Here, we observed that short-term HFD induced dysbiosis, glucose intolerance and decreased intestinal RORγt+ CD4 T cells, including peripherally-induced Tregs and IL17-producing (Th17) T cells. However, supplementation of HFD-fed male mice with the fermentable dietary fiber fructooligosaccharides (FOS) was sufficient to maintain RORγt+ CD4 T cell subsets and microbial species known to induce them, alongside having a beneficial impact on glucose tolerance. FOS-mediated normalization of Th17 cells and amelioration of glucose handling required the cDC2 dendritic cell subset in HFD-fed animals, while IL-17 neutralization limited FOS impact on glucose tolerance. Overall, we uncover a pivotal role of cDC2 in the control of the immune and metabolic effects of FOS in the context of HFD feeding.


Conflict of interest statement

The authors declare no competing interests.

Figures

Fig. 1
Fig. 1. HFD feeding decreases RORγt+ pTregs and Th17 cells in the small intestine and colon.
AD Body weight (n = 13–14 mice per group) (A), body weight gain (n = 13–14 mice per group) (B), epididymal fat mass (n = 13–14 mice per group) (C) and body composition (fat and lean mass) (n = 5–6 mice per group, statistical significance assessed with 2-way ANOVA and Sidak’s multiple comparison test, stars display adjusted P value) (D) in wild-type mice fed a chow diet (CD) or a high-fat diet (HFD) for 4 weeks. E, F Oral glucose tolerance test and associated area under the curve (AUC) quantification (E), HOMA-IR index measurement (F), fasted plasma glucose (G), and insulin (H) levels in wild-type mice fed a chow diet (CD) or a high-fat diet (HFD) for 4 weeks (n = 13–14 mice per group). IK Colon weight (n = 13–14 mice per group) (I), colon length (n = 9–10 mice per group) (J) and cecum weight (n = 13–14 mice per group) (K) in wild-type mice fed a chow diet (CD) or a high-fat diet (HFD) for 4 weeks. L Flow cytometry plots depicting RORγt+ CD4 T cells, including RORγt+ pTregs and Th17 cells, in the small intestine of chow diet-fed wild-type animals. M, N Flow cytometry analysis of RORγt+ pTregs (M) and Th17 cells (N) in the mesenteric lymph nodes (mesLNs) (n = 3 mice), the small intestine (n = 6 mice) and the colon (n = 5 mice) of chow diet-fed wild-type animals. Statistical significance tested with 1-way ANOVA and Newman-Keuls multiple comparison test. OQ Flow cytometry analysis of total Tregs (O), RORγt+ pTregs (P) and Th17 cells (Q) in the small intestine and colon of wild-type mice fed a chow diet (CD) or a high-fat diet (HFD) for 4 weeks (n = 8–9 mice per group). All data in this figure are presented as mean values ± SEM. All panels correspond to two independent experimental groups. Statistical significance has been assessed with a two-sided T test unless otherwise stated on the corresponding panel legend.
Fig. 2
Fig. 2. Fructooligosaccharides supplementation improves glucose tolerance and prevents RORγt+ pTregs and Th17 cells loss in HFD-fed animals.
AE Body weight (n = 15 mice per group) (A), body weight gain (n = 15 mice per group) (B), epididymal fat mass (n = 14–15 mice per group) (C), and body composition (fat and lean mass) (n = 7–10 mice per group. Statistical significance assessed with 2-way ANOVA and Sidak’s multiple comparison test, stars display adjusted P value) (D) and daily food intake (n = 9 mice per group) (E) in wild-type mice fed a high-fat diet (HFD) or a high-fat diet supplemented with fructooligosaccharides (FOS) (HFD + FOS) administered in the drinking water for 4 weeks. FJ Oral glucose tolerance test and associated area under the curve (AUC) quantification (n = 15 mice per group) (F), HOMA-IR index measurement (n = 15 mice per group) (G), plasma insulin levels (n = 15 mice per group) (H), fasted plasma glucose levels (n = 15 mice per group) (I) and glucose-stimulated insulin secretion (GSIS) (n = 9–12 mice per group, 2 independent experimental groups) (J) in wild-type mice fed a high-fat diet (HFD) or a high-fat diet supplemented with FOS (HFD + FOS) for 4 weeks. KM Colon weight (n = 13–14 mice per group) (K), colon length (n = 9–12 mice per group) (L), and cecum weight (n = 13–14 mice per group, two independent experimental groups) (M) in wild-type mice fed a high-fat diet (HFD) or a high-fat diet supplemented with FOS (HFD + FOS) for 4 weeks. NP Flow cytometry analysis of total Tregs (N), RORγt+ pTregs (O), and Th17 cells (P) in the small intestine and colon of wild-type mice fed a high-fat diet (HFD) or a high-fat diet supplemented with FOS (HFD + FOS) for 4 weeks (n = 13–14 mice per group). QX Microbiome sequencing and analysis of phyla relative abundance (Q), Shannon index of microbial diversity (R), relative abundance of specific bacterial class or species including Segmented Filamentous Bacteria (SFB) (S), Bifidobacteria (T), Clostridia (U), Fusobacterium nucleatum (V), Bifidobacterium breve (W), and Staphylococcus saprophyticus (X) in wild-type mice fed a chow diet (CD), a high-fat diet (HFD) or a high-fat diet supplemented with FOS (HFD + FOS) for 4 weeks (n = 4 mice per group, each from an independent experimental group. Statistical testing with one-way ANOVA and Newman-Keuls multiple comparison test). All data in this figure are presented as mean values ± SEM. All panels correspond to three independent experimental groups unless otherwise specified in the corresponding panel legend. Statistical significance has been assessed with a two-sided T test unless otherwise stated in the corresponding panel legend.
Fig. 3
Fig. 3. Th17 cells generation and gut-homing imprinting of RORγt+ pTregs and Th17 cells are impaired by HFD feeding and corrected upon FOS supplementation.
AC Flow cytometry analysis of total Tregs (A), RORγt+ pTregs (B), and Th17 cells (C) in the mesenteric lymph nodes of wild-type mice fed a chow diet (CD) or a high-fat diet (HFD) for 4 weeks (n = 8 mice per group, 2 independent experimental groups). D, E Flow cytometry analysis of RORγt+ pTregs (D) and Th17 cells (E) expressing CCR9 or ITGβ7 in the mesenteric lymph nodes of wild-type mice fed a chow diet (CD) or a high-fat diet (HFD) for 4 weeks (n = 7–8 mice per group, 2 independent experimental groups). F, G Flow cytometry analysis of total Tregs (F), RORγt+ pTregs (G), and Th17 cells (G) in the mesenteric lymph nodes of wild-type mice fed a high-fat diet (HFD) or a high-fat diet supplemented with FOS (HFD + FOS) for 4 weeks (n = 13–14 mice per group, 3 independent experimental groups). H, I Flow cytometry analysis of CCR9 or ITGβ7-expressing RORγt+ pTregs (H) and Th17 cells (I) in the mesenteric lymph nodes of wild-type mice fed a high-fat diet (HFD) or a high-fat diet supplemented with FOS (HFD + FOS) for 4 weeks (n = 13–14 mice per group, 3 independent experimental groups). J, K Flow cytometry analysis of Th17 cells (J) and Th17 cells expressing CCR9 or ITGβ7 (K) in the mesenteric lymph nodes of wild-type mice fed a high-fat diet (HFD) or a high-fat diet supplemented in SCFA (HFD + SCFA) for 4 weeks (n = 4–6 mice per group, 1 experimental group). L, M Flow cytometry analysis of RORγt+ pTregs (L) and RORγt+ pTregs expressing CCR9 or ITGβ7 (M) in the mesenteric lymph nodes of wild-type mice fed a high-fat diet (HFD) or a high-fat diet supplemented in SCFA (HFD + SCFA) for 4 weeks (n = 4–6 mice per group, 1 experimental group). All data in this figure are presented as mean values ± SEM. Statistical significance has been assessed with a two-sided T test, stars display P value.
Fig. 4
Fig. 4. IRF4-dependent dendritic cells (cDC2) participate to the homeostasis of RORγt+ pTregs and Th17 cells.
A Flow cytometry analysis of Th17 cells in the small intestine (n = 9 mice per group), colon (n = 9 mice per group) and mesenteric lymph nodes (mesLNs) (n = 7 mice per group) of mice lacking Irf4 in dendritic cells (Irf4ΔDC) and Irf4flox/flox controls (ctrl). B Flow cytometry plots and analysis of RORγt+ pTregs in the small intestine (n = 9 mice per group), colon (n = 9 mice per group) and mesenteric lymph nodes (mesLNs) (n = 7 mice per group) of mice lacking Irf4 in dendritic cells (Irf4ΔDC) and Irf4flox/flox controls (Ctrl). C, D Flow cytometry analysis of CCR9 or ITGβ7-expressing RORγt+ pTregs (C) and Th17 cells (D) in the mesenteric lymph nodes of mice lacking Irf4 in dendritic cells (Irf4ΔDC) and Irf4flox/flox controls (Ctrl) (n = 7 mice per group). All data in this figure are presented as mean values ± SEM. Statistical significance has been assessed with a two-sided T test and stars display P value. All panels correspond to two independent experimental groups.
Fig. 5
Fig. 5. cDC2 control FOS-mediated prevention of Th17 cells loss in HFD-fed animals.
AC Colon weight (A), colon length (B), and cecum weight (C) in mice lacking Irf4 in dendritic cells (Irf4ΔDC) (n = 13–14 mice per group) and Irf4flox/flox controls (ctrl) (n = 11–14 mice per group) fed a high-fat diet (HFD) or a high-fat diet supplemented with FOS (HFD + FOS) for 4 weeks. Panel C includes two independent experimental groups. DF Flow cytometry analysis of RORγt+ pTregs in the small intestine (D), colon (E) and mesenteric lymph nodes (mesLNs) (F) of mice lacking Irf4 in dendritic cells (Irf4ΔDC) (n = 13–14 per group) and Irf4flox/flox controls (ctrl) (n = 11–14 mice per group) fed a high-fat diet (HFD) or a high-fat diet supplemented with FOS (HFD + FOS) for 4 weeks. G, H Flow cytometry analysis of CCR9 (G) or ITGβ7 (H)-expressing RORγt+ pTregs in the mesenteric lymph nodes (mesLNs) of mice lacking Irf4 in dendritic cells (Irf4ΔDC) (n = 13–14 mice per group) and Irf4flox/flox controls (ctrl) (n = 14 mice per group) fed a high-fat diet (HFD) or a high-fat diet supplemented with FOS (HFD + FOS) for 4 weeks. IK Flow cytometry analysis of Th17 cells in the small intestine (I), colon (J), and mesenteric lymph nodes (mesLNs) (K) of mice lacking Irf4 in dendritic cells (Irf4ΔDC) (n = 13–14 mice per group) and Irf4flox/flox controls (ctrl) (n = 14 mice per group) fed a high-fat diet (HFD) or a high-fat diet supplemented with FOS (HFD + FOS) for 4 weeks. L, M Flow cytometry analysis of CCR9 (L) or ITGβ7 (M)-expressing Th17 cells in the mesenteric lymph nodes (mesLNs) of mice lacking Irf4 in dendritic cells (Irf4ΔDC) (n = 13–14 mice per group) and Irf4flox/flox controls (ctrl) (n = 14 mice per group) fed a high-fat diet (HFD) or a high-fat diet supplemented with FOS (HFD + FOS) for 4 weeks. All data in this figure are presented as mean values ± SEM. Statistical significance has been assessed with a two-sided T test and stars display P value. All panels correspond to three independent experimental groups unless otherwise stated in the corresponding panel legend.
Fig. 6
Fig. 6. cDC2 control FOS-mediated improvement of glucose tolerance in HFD-fed animals.
AE Body weight (A), body weight gain (B), epididymal fat mass (C), body composition (fat and lean mass) (D), and daily food intake (E) in mice lacking Irf4 in dendritic cells (Irf4ΔDC) (n = 6–14 mice per group) and Irf4flox/flox controls (ctrl) (n = 11–16 mice per group) fed a high-fat diet (HFD) or a high-fat diet supplemented with FOS (HFD + FOS) for 4 weeks. Panels A, B and D include three independent experimental groups, panel C includes two independent experimental group. Statistical significance in panel D was assessed with one-way ANOVA and Sidak’s multiple comparison test and stars display adjusted P value. FH Oral glucose tolerance test and associated area under the curve (AUC) quantification (F), HOMA-IR index measurement (G), and glucose-stimulated insulin secretion (GSIS) (H) in mice lacking Irf4 in dendritic cells (Irf4ΔDC) (n = 8–14 mice per group) and Irf4flox/flox controls (ctrl) (n = 12–16 mice per group, panels F and G include three independent experimental groups, panel H includes two independent experimental groups) fed a high-fat diet (HFD) or a high-fat diet supplemented with FOS (HFD + FOS) for 4 weeks. I, J Body fat mass (I) and oral glucose tolerance test with the associated area under the curve (AUC) quantification (J) measured after 4 weeks of HFD in mice treated with an isotype control (HFD + IgG) as well as mice supplemented with FOS and treated with an isotype control (HFD + FOS+IgG) or antibodies neutralizing IL-17A and IL-17F (HFD + FOS + αIL-17) (n = 6–9 mice per group, two independent experimental groups, statistical significance tested with one-way ANOVA and Newman-Keuls multiple comparison test). All data in this figure are presented as mean values ± SEM. Statistical significance has been assessed with a two-sided T test unless stated otherwise on the corresponding panels.

References

    1. Ezzati M, Riboli E. Behavioral and dietary risk factors for noncommunicable diseases. N. Engl. J. Med. 2013;369:954–964. doi: 10.1056/NEJMra1203528. - DOI - PubMed
    1. GBD 2013 Risk Factors Collaborators et al. Global, regional, and national comparative risk assessment of 79 behavioural, environmental and occupational, and metabolic risks or clusters of risks in 188 countries, 1990–2013: a systematic analysis for the Global Burden of Disease Study 2013. Lancet Lond. Engl. 386, 2287–2323 (2015). - PMC - PubMed
    1. Christ A, Lauterbach M, Latz E. Western diet and the immune system: an inflammatory connection. Immunity. 2019;51:794–811. doi: 10.1016/j.immuni.2019.09.020. - DOI - PubMed
    1. Thorburn AN, Macia L, Mackay CR. Diet, metabolites, and ‘western-lifestyle’ inflammatory diseases. Immunity. 2014;40:833–842. doi: 10.1016/j.immuni.2014.05.014. - DOI - PubMed
    1. Veldhoen M, Brucklacher-Waldert V. Dietary influences on intestinal immunity. Nat. Rev. Immunol. 2012;12:696–708. doi: 10.1038/nri3299. - DOI - PubMed

MeSH terms