. 2024 Jun 26;9(1):118.
doi: 10.1038/s41541-024-00912-1.

Systemic prime mucosal boost significantly increases protective efficacy of bivalent RSV influenza viral vectored vaccine

Affiliations

Systemic prime mucosal boost significantly increases protective efficacy of bivalent RSV influenza viral vectored vaccine

Cameron Bissett et al. NPJ Vaccines. .

Abstract

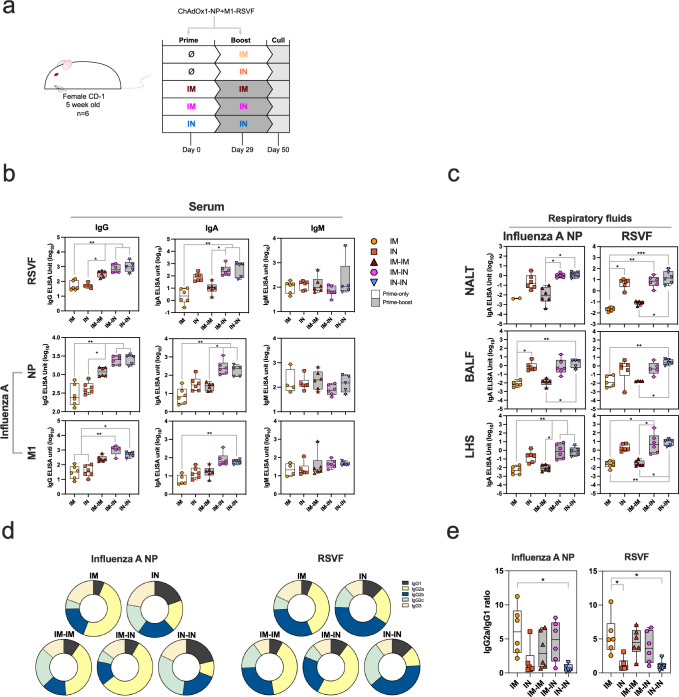
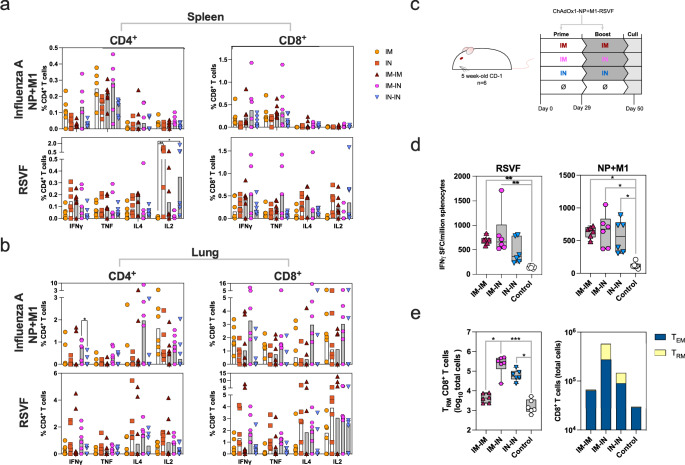
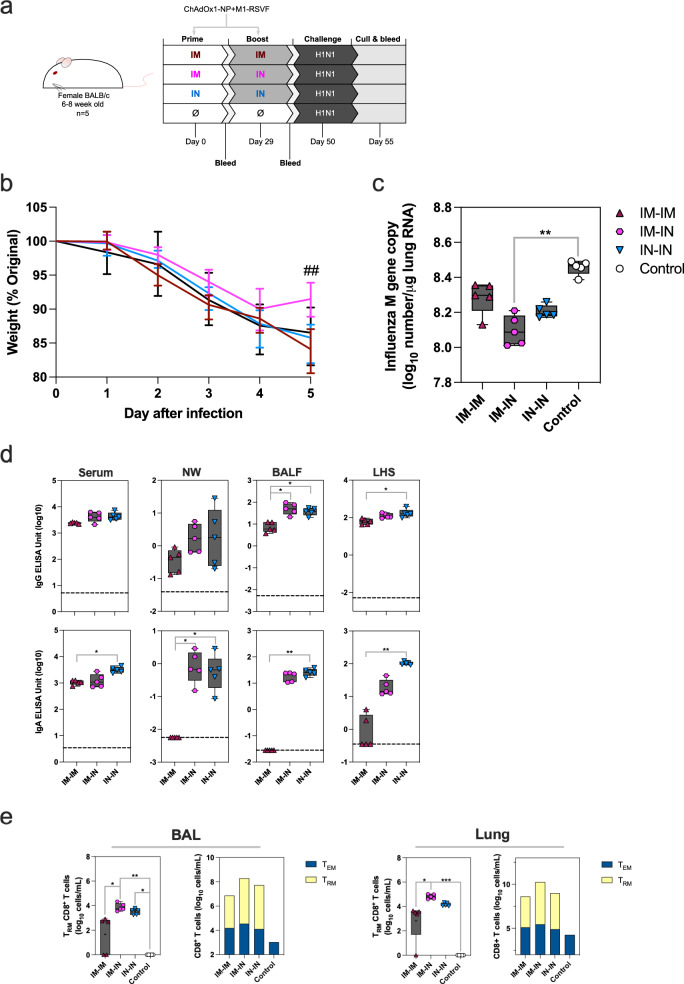
Although licensed vaccines against influenza virus have been successful in reducing pathogen-mediated disease, they have been less effective at preventing viral infection of the airways and current seasonal updates to influenza vaccines do not always successfully accommodate viral drift. Most licensed influenza and recently licensed RSV vaccines are administered via the intramuscular route. Alternative immunisation strategies, such as intranasal vaccinations, and "prime-pull" regimens, may deliver a more sterilising form of protection against respiratory viruses. A bivalent ChAdOx1-based vaccine (ChAdOx1-NP + M1-RSVF) encoding conserved nucleoprotein and matrix 1 proteins from influenza A virus and a modified pre-fusion stabilised RSV A F protein, was designed, developed and tested in preclinical animal models. The aim was to induce broad, cross-protective tissue-resident T cells against heterotypic influenza viruses and neutralising antibodies against RSV in the respiratory mucosa and systemically. When administered via an intramuscular prime-intranasal boost (IM-IN) regimen in mice, superior protection was generated against challenge with either RSV A, Influenza A H3N2 or H1N1. These results support further clinical development of a pan influenza & RSV vaccine administered in a prime-pull regimen.


Conflict of interest statement

The authors of this manuscript have the following competing interests: S.G. is the co-founder and a board member of Barinthus Biotherapeutics (formerly Vaccitech), and is named as an inventor on patents covering the use of ChAdOx1 vector vaccines. T.L. was a consultant to Barinthus Biotherapeutics on an unrelated project involving ChAdOx1 vector vaccines. She is also named as an inventor on a patent involving unrelated ChAdOx1 vector vaccines. T.L. also reports an honorarium from Seqirus. S.S. is senior director of research at Barinthus Biotherapeutics. All other authors declare no competing interests.

Figures

Fig. 1
Fig. 1. Humoral immunogenicity of ChAdOx1-NP + M1-RSVF.
a Vaccination schematic for the assessment of the immunogenicity of ChAdOx1-NP + M1-RSVF administered through different regimens in outbred, 5-week-old, CD-1 mice (n = 6). Mice were culled on day 50, with sera, lungs, spleens, nasal-associated lymphoid tissue (NALT) and bronchioalveolar lavage fluid (BALF) harvested. b IgG, IgA and IgM responses against RSV-F, influenza A NP and M1 (H1N1) in sera three weeks post-final vaccination, measured by ELISA. Values are displayed as ELISA units (EUs) (log10). Individual mouse values are represented as symbols. Values were analysed using non-parametric Kruskal-Wallis tests to assess for statistically significant differences between groups, which are then expressed as p values (*=p < 0.05, **=p < 0.01, ***=p < 0.001). c Levels of IgA specific to influenza A NP (H1N1) and RSVF in NALT, BALF and lung homogenate supernatant (LHS) collected from mice three weeks post-final vaccination as measured by ELISAs (*=p < 0.05, **=p < 0.01, ***=p < 0.001). d Relative levels of anti-influenza A NP (H1N1) and anti-RSVF IgG subclasses in serum (IgG1, IgG2a, IgG2b, IgG2c and IgG3), as measured by tIgG-normalised indirect ELISA. Relative IgG subclass levels following each regimen are presented as individual doughnut charts, with each section of the doughnut representing the median IgG subclass OD405nm response. Bar charts with individual sample responses per subclass per regimen are present in Supplementary Fig. 3a. e Serum antigen-specific IgG2a to IgG1 subclass ratios (IgG2a OD405nm/IgG1 OD405nm). For all boxplots, whisker endings represent upper and lower extremes, the box bounds represent upper and lower quartiles, respectively, and the central line represents the group median.
Fig. 2
Fig. 2. Cellular immunogenicity of ChAdOx1-NP + M1-RSVF.
a Cytokine responses in CD4+ and CD8+ splenocytes that were separately stimulated with influenza A (H1N1) NP + M1- and RSVF-spanning peptides; % cytokine+ T cells were determined through intracellular staining. Basal frequencies of cytokine+ T cells (unstimulated sample) were subtracted from stimulated sample frequencies. Median responses in each group are displayed as the top lines of bars on graphs on the left-hand side of the figure, with symbols representing individual mice, grey-shaded bars prime-boost regimens and white bars prime-only regimens. b Cytokine responses in CD4+ and CD8+ lung cells harvested from mice, separately stimulated with influenza A (H1N1) NP + M1- and RSVF-spanning peptides. c Vaccination schematic for the continued assessment of the cellular immunogenicity of ChAdOx1-NP + M1-RSVF. d IFNγ responses in splenocytes stimulated with NP + M1- and RSVF-spanning peptides (IFNγ spot-forming cells (SFCs)/million splenocytes), as measured by IFNγ enzyme-linked immunosorbent spot (ELISpot) assay. e Total counts of CD8+ TRM cells (left), as well as relative counts of CD8+ TEM and TRM cells (right) in lungs post-vaccination (all non-antigen-specific). TRM cells were defined as CD8+CD44+CD62L-CD103+CD69+, and negative for intravenous (IV) circulatory CD3+ T cell stain. TEM cells were defined as CD8+CD44+CD62L-CD127+, and negative for IV circulatory CD3+ T cell stain. Group differences of data in (a), (b), (d) and (e) were analysed using non-parametric Kruskal-Wallis tests (*=p < 0.05, **=p < 0.01, ***=p < 0.001). For all boxplots, whisker endings represent upper and lower extremes, the box bounds represent upper and lower quartiles, respectively, and the central line represents the group median.
Fig. 3
Fig. 3. Challenging ChAdOx1-NP + M1-RSVF-vaccinated mice with RSV.
a Vaccination and challenge schematic for the assessment of the protective capacity of ChAdOx1-NP + M1-RSVF against RSV-A2 infection. Mice were prime-boost-vaccinated, then challenged with RSV-A2, and culled 7 days later with tissues and fluids harvested. Blood sampling was performed 4 weeks post-prime and 3 weeks post-boost. b Weight change in mice over time post-challenge, measured as % of pre-challenge weight. At each timepoint, lines represent group medians, and bars represent group bodyweight ranges. Significant differences between IM-IN and control groups are represented with *, between IM-IM and control as & (* or & =p < 0.05, **=p < 0.01). c Viral load in lungs 7 days post-challenge, measured as number of RSV L gene copies/μg lung RNA (log10). d RSVF-specific IgG and IgA levels in serum, NWs, BALF and LHS post-challenge, measured by ELISA. Median negative control values are displayed as dashed lines. e Levels of antigen-specific CD8+ TRM, and relative levels of antigen-specific CD8+ TEM and TRM, in BAL and lungs post-challenge. TRM and TEM cells were defined as CD3+CD8+CD44+CD62L-CD103+CD69+, and CD3+CD8+CD44+CD62L-, respectively, and positive for RSV pentamer H-2Kd KYKNVTEL. In boxplots, a “+” symbol represents the group mean. Two mice from the IM-IM-vaccinated group did not have detectable BAL or lung TRM. Group differences for all data were analysed using non-parametric Kruskal-Wallis tests (*=p < 0.05, **=p < 0.01). For all figure boxplots, whisker endings represent upper and lower extremes, the box bounds represent upper and lower quartiles, respectively, and the central line represents the group median.
Fig. 4
Fig. 4. Challenging ChAdOx1-NP + M1-RSVF-vaccinated mice with H3N2.
a Vaccination and challenge schematic for the assessment of the protective capacity of ChAdOx1-NP + M1-RSVF against X31 (H3N2) infection and subsequent disease in mice. Mice were prime-boost-vaccinated, then challenged with X31, and culled 6 days later with tissues and fluids harvested. Blood sampling was performed 4 weeks post-prime and 3 weeks post-boost. b Weight change in mice over time post-challenge, measured as % of pre-challenge weight. Significant differences at timepoints between IM-IN and control mouse groups are represented with *, between IM-IN and IM-IM as # and between IN-IN and unvaccinated as @ (*, @ or # =p < 0.05, **=p < 0.01). c Viral load in lungs 6 days post-challenge (M gene copies/μg lung RNA (log10)). d H3N2 NP-specific IgG and IgA levels in serum, NWs, BALF and LHS post-challenge, as measured by ELISA (log10 EU). Median negative control values are displayed as dashed lines. e Levels of antigen-specific CD8+ TRM cells, and relative levels of antigen-specific CD8+ TEM and TRM, in BAL and lungs post-challenge. TRM and TEM cells were defined as CD3+CD8+CD44+CD62L-CD103+CD69+, and CD3+CD8+CD44+CD62L-, respectively, and positive for influenza pentamer H-2Kd TYQRTALV. In boxplots, a “+” symbol represents the group mean. One mouse in group IM-IN did not have detectable Lung TRM. Group differences for all data were analysed using non-parametric Kruskal-Wallis tests (*=p < 0.05, **=p < 0.01). For all boxplots, whisker endings represent upper and lower extremes, the box bounds represent upper and lower quartiles, respectively, and the central line represents the group median.
Fig. 5
Fig. 5. Challenging ChAdOx1-NP + M1-RSVF-vaccinated mice with H1N1.
a Vaccination and challenge schematic for the assessment of the protective capacity of ChAdOx1-NP + M1-RSVF against H1N1 infection and subsequent disease in mice. Mice were prime-boost-vaccinated, then challenged with H1N1, and culled 5 days later with tissues and fluids harvested. Blood sampling was performed 4 weeks post-priming and 3 weeks post-boosting. b Weight change in mice over time post-challenge, as measured by % of pre-challenge weight. The significant difference between IM-IN and IM-IM mouse groups is represented with ## (##=p < 0.01). c Viral load in lungs 5 days post-challenge (number of M gene copies/μg lung RNA (log10)). d H1N1 NP-specific IgG and IgA levels in serum, NWs, BALF and LHS post-challenge, as measured ELISA (log10 EU). Median control values are displayed as dashed lines on graphs. e Levels of antigen-specific CD8+ TRM cells, and relative levels of antigen-specific CD8+ TEM and TRM, in BAL and lungs post-challenge. TRM and TEM cells were defined as CD3+CD8+CD44+CD62L-CD103+CD69+, and CD3+CD8+CD44+CD62L-, respectively, and positive for influenza pentamer H-2Kd TYQRTALV. In boxplots, a “+” symbol represents the group mean. Two mice in group IM-IM did not have detectable BAL TRM, and one mouse in group IM-IM did not have detectable Lung TRM. Group differences for all data were analysed using non-parametric Kruskal-Wallis tests (*=p < 0.05, **=p < 0.01, ***=p < 0.001). For all boxplots, whisker endings represent upper and lower extremes, the box bounds represent upper and lower quartiles, respectively, and the central line represents the group median.

References

    1. Sridhar S, Brokstad KA, Cox RJ. Influenza Vaccination Strategies: Comparing Inactivated and Live Attenuated Influenza Vaccines. Vaccines. 2015;3:373–389. doi: 10.3390/vaccines3020373. - DOI - PMC - PubMed
    1. Oh JE, et al. Intranasal priming induces local lung-resident B cell populations that secrete protective mucosal antiviral IgA. Sci. Immunol. 2021;6:eabj5129. doi: 10.1126/sciimmunol.abj5129. - DOI - PMC - PubMed
    1. Fu Y-H, et al. Intranasal immunization with a helper-dependent adenoviral vector expressing the codon-optimized fusion glycoprotein of human respiratory syncytial virus elicits protective immunity in BALB/c mice. Virol. J. 2013;10:183. doi: 10.1186/1743-422X-10-183. - DOI - PMC - PubMed
    1. Khan IU, Huang J, Li X, Xie J, Zhu N. Nasal immunization with RSV F and G protein fragments conjugated to an M cell-targeting ligand induces an enhanced immune response and protection against RSV infection. Antivir. Res. 2018;159:95–103. doi: 10.1016/j.antiviral.2018.10.001. - DOI - PubMed
    1. Mossad SB. Demystifying FluMist, a new intranasal, live influenza vaccine. Clevel. Clin. J. Med. 2003;70:801–806. doi: 10.3949/ccjm.70.9.801. - DOI - PubMed