. 2024 Jul;631(8020):360-368.
doi: 10.1038/s41586-024-07389-x. Epub 2024 Jun 26.

Connectomic reconstruction of a female Drosophila ventral nerve cord

Affiliations

Connectomic reconstruction of a female Drosophila ventral nerve cord

Anthony Azevedo et al. Nature. 2024 Jul.

Abstract

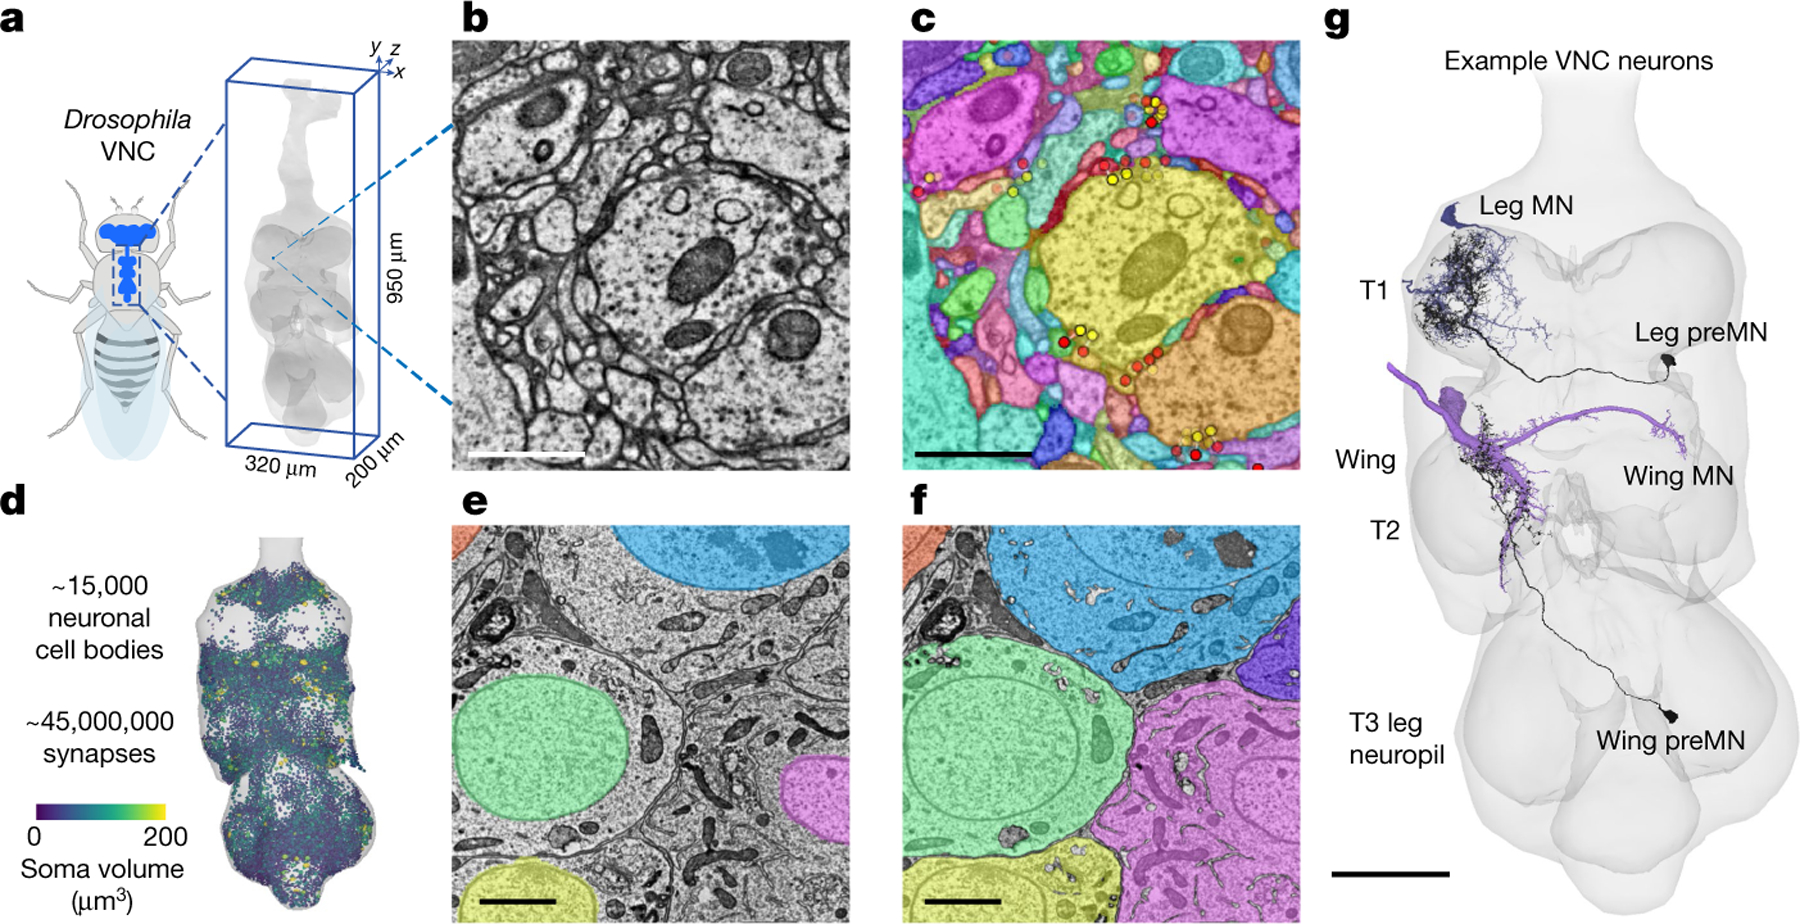
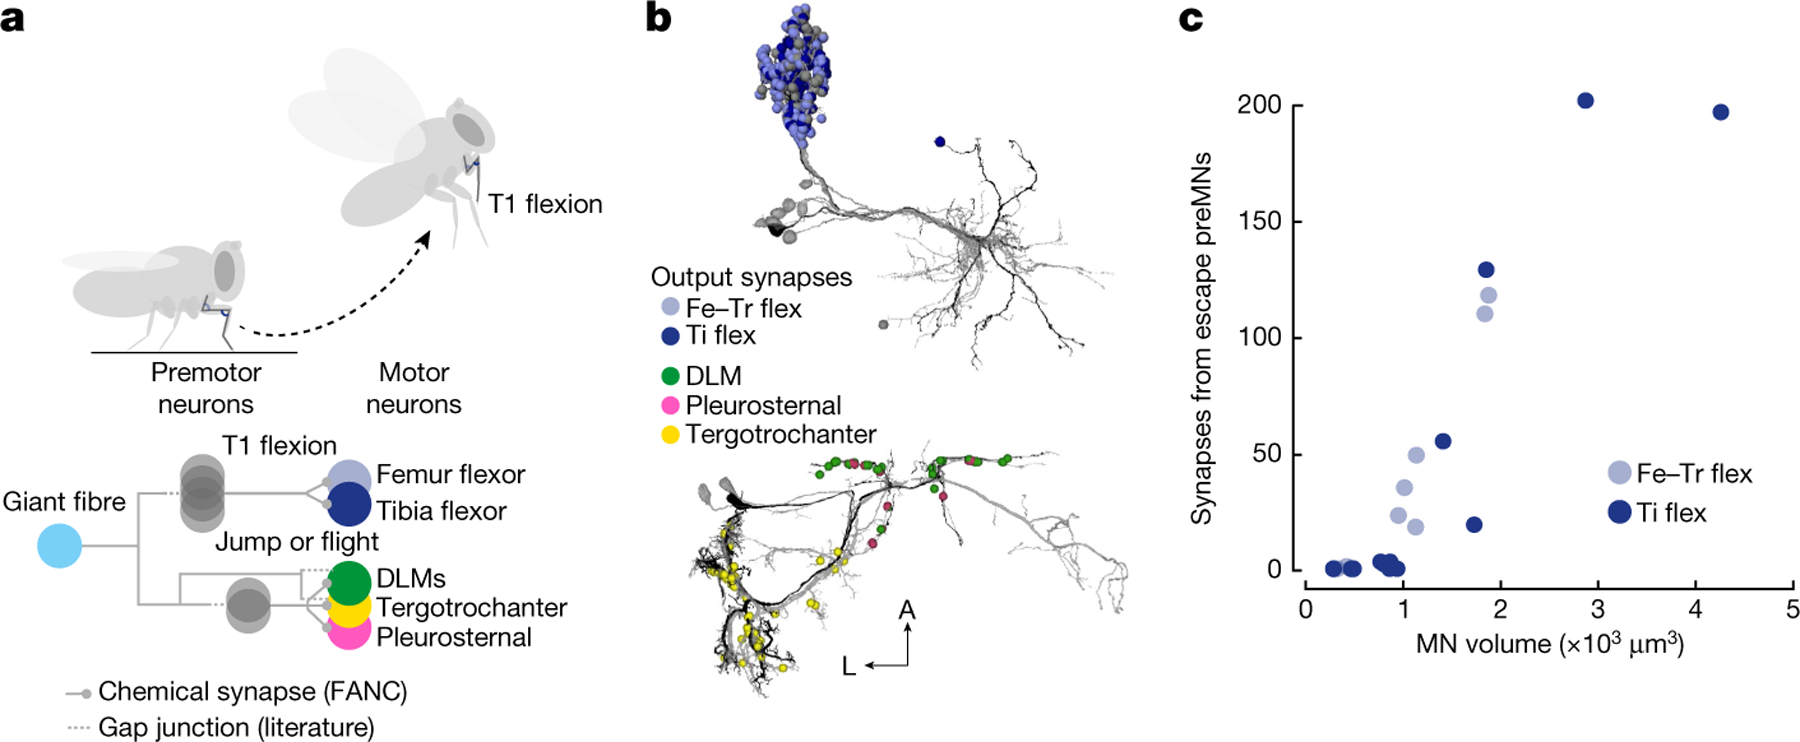
A deep understanding of how the brain controls behaviour requires mapping neural circuits down to the muscles that they control. Here, we apply automated tools to segment neurons and identify synapses in an electron microscopy dataset of an adult female Drosophila melanogaster ventral nerve cord (VNC)1, which functions like the vertebrate spinal cord to sense and control the body. We find that the fly VNC contains roughly 45 million synapses and 14,600 neuronal cell bodies. To interpret the output of the connectome, we mapped the muscle targets of leg and wing motor neurons using genetic driver lines2 and X-ray holographic nanotomography3. With this motor neuron atlas, we identified neural circuits that coordinate leg and wing movements during take-off. We provide the reconstruction of VNC circuits, the motor neuron atlas and tools for programmatic and interactive access as resources to support experimental and theoretical studies of how the nervous system controls behaviour.


Conflict of interest statement

Competing interests H.S.S. declares financial interests in Zetta AI. The remaining authors declare no competing interests.

Figures

Extended Data Fig. 1 |
Extended Data Fig. 1 |. Soma segmentation in FANC.
a, Size distribution of all 17,076 putative nuclei. We manually inspected each putative nucleus and found 14621 neurons (85.6%), 2030 glia (11.9%), 410 false positives (2.4%), and 15 fragments of neuron nuclei detected twice (Duplicated neurons, 0.1%). Volume size is calculated based on the number of voxels within each detected objects. Inset: example of a large diameter axons that was falsely predicted as a putative nucleus. b, Violin plot showing the size distribution of three major neuronal cell types that have cell bodies in VNC: interneurons (n = 12,468), ascending neurons (n = 1,668), and motor neurons (n = 485). (χ2 = 1760.7, p < 0.001, Kruskal-Wallis test.) VNC neurons with arbors projecting to the neck connective were labeled as ascending neurons. Motor neurons include haltere motor neurons (n = 32), leg motor neurons (all T1, T2, and T3, n = 371), neck motor neurons (n = 24), and wing motor neurons (ADMN, PDMN, and MesoAN, n = 58). Haltere, leg, and neck motor neurons were identified based on their skeleton nodes previously reported in CATMAID. c, Comparison of volume size between four motor neurons: haltere motor neurons, leg motor neurons, neck motor neurons, wing motor neurons. (χ2 = 84.816, p < 0.001, Kruskal-Wallis test, ***p < 0.001, post-hoc Benjamini–Hochberg procedure-corrected Dunn’s test for multiple comparisons).
Extended Data Fig. 2 |
Extended Data Fig. 2 |. Summary of FANC software tools for cell proofreading.
a, Proofreading of cell morphology in Neuroglancer via ChunkedGraph, b, cell type annotation, c, identification, d, cellular and circuit analysis, and e, identification of genetic driver lines.
Extended Data Fig. 3 |
Extended Data Fig. 3 |. Comparison of automatic synapse prediction with manually annotated ground truth.
a, Example synapses from the EM volume. Pink blobs indicate predicted postsynaptic sites. The arrowhead in the inset indicates the “T-bar” at the presynaptic site. b, Average distance manual to predicted synapses (M-P), and from predicted to manual synapses (P-M) for the four MNs shown in Fig. 2. The larger predicted-to-manual distances are consistent with larger numbers of predicted synapses (Fig. 2e). c, Distributions of manual vs. predicted synapse annotations along the medial/lateral axis (top) and the anterior/posterior axis (bottom) for the posterior rotator MN, shown in Fig. 2b. Note, ~50% more synapses are predicted compared to manual annotations for this neuron (Fig. 2e). d, Synapse distributions along the dorsal/ventral axis, aligned to the neuron and the synapses below. The distributions are significantly different (Mann-Whitney AUC = 0.56, p < 10−7), with a small increase in the peak of the distribution of predicted synapses. e, An example dendrite in the synapse rich region of the dorsal/ventral distribution in d. Five synapses are predicted, but only one annotated (#6). f, Predicted synapses appear in a region that was not manually traced. We conclude that comparing manual annotation with automatic synapse prediction in these synapse dense reconstructions includes four sources of noise: 1) completeness of manual tracing of fine branches, 2) completeness of manual synapse annotation, 3) completeness/accuracy of segmentation, and 4) accuracy of synapse prediction. Here, we have ensured that all the manually traced dendrites are proofread and reattached to the segmented reconstructed, thus limiting the third source of noise. Thus, we reiterate our statement in the text to say that the appropriate level of proofreading is likely dictated by the degree to which conclusions based on connectomes would be affected by these sources of noise. In Fig. 2f, we show that for the four neurons we examine here, most of the synapses are from a small number of partners, and those partners are largely correctly identified from both the manual and predicted synapses.
Extended Data Fig. 4 |
Extended Data Fig. 4 |. MNs in T1R have half as many input sites as MNs in T1L, likely due to rough dissection of the right T1 leg nerves.
a, The number of synapses onto the right T1 MN (y-axis) vs. onto the paired left T1 MN (x-axis). Colors indicate MN pairs in b-d. The slope of the relationship is 0.51, with a Pearson’s correlation coefficient of 0.89, p < 10−22. b, Left and right SETi MNs. The right T1 neurons tend to appear smoother, with fewer fine twigs. c, Left and right main tibia flexor MNs (Fast flexor). d, Left and right pleural coxa promotor MNs. Even though the axons exit the PrDN, rather than the ProLN, many of the dendrites of the right T1 neuron run through the damaged regions. Blebby boutons can be seen (white arrow). e, EM image of the damaged area of right T1. f, Magnified view of the damaged area. g, Magnified view of branches of MNs (colors) near the damaged area, including a bleb (arrow) in the pleural promotor MN (magenta). The bleb diameter is on the order of the primary neurite of the largest cell in the T1 neuromeres (blue). h, For comparison, the right side mesoAN is clearly damaged while the right side ADMN and PDMN are intact. Left and right pairs of wing MNs in the ADMN and PDMN have similar numbers of postsynaptic sites, but the right side mesoAN MNs have fewer synapses than the left side mesoAN MNs.
Extended Data Fig. 5 |
Extended Data Fig. 5 |. FANC efferent neurons with axons in the ADMN or PDMN that are not wing MNs.
a, MNs that innervate the T2 tergotrochanter leg muscle send axons through the PDMN. The two small neurons have not been identified previously. We identify them as TT MNs here based on their fasciculation with the main TT MN. We predict that they also innervate the main TT muscle, or the intracoxal depressor and levator, respectively (muscles 67 and 68 according to ref. 79). b, The peripherally synapsing interneuron (PSI) sends an axon into the PDMN and synapses onto DLM axons but does not innervate muscles. c, Four other unidentified neurons have axons in the ADMN or PDMN. Their dendrites are thinner than any other motor neurons, and not like anything previously shown using light microscopy. One has an ascending process (indicated with an arrow), and its projection into PDMN does not travel to the end of the dissection so it is not an MN. One (right-most) shares a majority of its input with pleurosternal MNs, and is likely neuromodulatory or may play a similar role to the tpn MN. d, DLM MNs are the only MNs we observed with output synapses, and they synapse onto each other. e, Recently collected XNH images of the wing and wing hinge were used to help inform the anatomical cartoon schematics.
Extended Data Fig. 6 |
Extended Data Fig. 6 |. Proofreading of motor neurons.
a, Overview of how proofreading affected the number of input synapses to each MN. Many of the MN meshes changed substantially, some increased in size as objects were merged (# of synapses before vs. after <1), and some decreased in size as objects were split (# of synapses before vs. after >1). Leg MNs underwent larger changes than wing MNs, relative to starting volume. b, Example leg MNs before and after proofreading. Left) An example MN that was initially merged with glia and other neurons (blue, extra somas are visible). Right) An example MN that required branches to be merged across knife marks.
Fig. 1 |
Fig. 1 |. Connectomic reconstruction of neural circuits in the Drosophila VNC.
a, We aligned, segmented and analysed a serial-section electron microscopy dataset of a Drosophila VNC. b, An example section of raw electron microscopy image data from the FANC dataset. Scale bar, 1 μm. c, Neuron segmentation and synapse prediction. We automatically segmented neurons using CNNs. Each segmented cell is shaded with a different colour. We applied automated methods for synapse prediction across the entire FANC dataset. Example presynaptic sites are labelled with yellow dots and postsynaptic sites are labelled with red dots. Scale bar, 1 μm. df, We counted the total number of neurons in FANC (d) by automatically detecting cell nuclei (e) and segmenting cell bodies (f). Scale bars, 2 μm. g, Example leg (navy) and wing MNs (purple) and preMNs (black). Scale bar, 100 μm.
Fig. 2 |
Fig. 2 |. Validation of automated methods for segmentation and synapse prediction.
a, To validate the accuracy of the segmentation, we compared automated and manual reconstruction for four leg motor neurons (MNs) innervating the front (T1) leg; three were from the right T1 neuromere and one was from the left. Neurons were manually traced using CATMAID. Segmented neurons were initially proofread in Neuroglancer without knowledge of the manual ‘ground truth’. L, left; R, right. b, Comparison of automated (auto) and manual reconstruction for the sternal posterior rotator MN. Scale bar, 10 μm. c, Comparison of automated synapse prediction and manual synapse annotation for the sternal posterior rotator MN. Note that manual synapse annotation identified additional neurites that had to be merged in the proofread reconstruction. Examples are indicated by blue arrowheads (compare with b). Scale bars: 10 μm (main image), 2 μm (inset). d, The automated reconstruction effectively segmented 75 ± 8% of the dendritic cable for all 4 MNs. The exceptions were typically fine dendritic branches, as illustrated in b. e, Input synapse counts from automated synapse prediction compared with manual annotation for all four MNs. f, Precision and recall of top presynaptic partners for each automatically reconstructed MN, for connections of three or more synapses. Dark shades indicate connections of more than three synapses and light shades indicate connections with three synapses. Colours indicate MN identity as in a. For example, 80% of the top predicted presynaptic partners with more than 3 synapses onto the left accessory tibia flexor (dark green) are also partners according to the manual annotations (precision), and 80% of the ground truth partners are found (recall). Inset, precision and recall of the top 250 presynaptic partners for the larger MNs.
Fig. 3 |
Fig. 3 |. Matching MNs in the connectome to leg muscle targets.
a, Schematic of spatial resolution versus coverage of anatomical tools. EM, electron microscopy. b, XNH cross-section of the femur, false-coloured to indicate anatomy. Orange, tibia extensor muscle fibres; blue, tibia flexor muscle fibres; yellow, LTM fibres; pink, femoral chordotonal organ. Inset, magnified view of axons passing through a fascia membrane (arrows). Scale bars: 50 μm (main image), 5 μm (inset). c, Left, tibia extensor MNs, SETi (light) and FETi (dark), reconstructed in FANC. Centre, depth-coloured maximum-intensity projection of a single MN labelled by MCFO (VT017399). Right, GFP expression in the femur, driven by VT017399 (green, projection), with phalloidin staining of the muscle (single section), schematized at right. Scale bars, 50 μm. d, Left, XNH cross-section through the coxa. Arrowheads indicate the trochanter flexor tendon. The trochanter flexor tendon separates the anterior muscle fibres (light blue; A) from posterior fibres (dark; P), with proximal fibres (pale blue) inserting at the proximal tip of the tendon (not shown). Scale bar, 50 μm. Right, annotated trochanter flexor muscle fibres in XNH. Scale bar, 100 μm. D, dorsal; M, medial. e, Projected 3D view along the long axis of the coxa. Three MNs leave the VProN to innervate the posterior fibres (right inset; scale bar, 10 μm). Five MNs leave the ProAN to innervate the anterior fibres (left inset; scale bar, 10 μm); two traced MNs in ProAN innervating proximal fibres are indicated with blue arrows. Scale bar, 50 μm. f, Two of six FANC MNs with characteristic morphology, 1 of 3 that exit via ProAN, and 1 of 3 that exit via VProN. MCFO clones and GAL4-driven GFP in coxa (VT063626). Scale bars, 50 μm. g, Two FANC MNs with small posterior somas. MCFO clones and GAL4-driven GFP in coxa (VT025963) provide evidence that at least one MN with a posterior soma innervates the proximal fibres of the trochanter flexor muscle. Scale bars, 50 μm.
Fig. 4 |
Fig. 4 |. Identification of the specific muscle innervated by each left front leg MN in FANC.
a, Counts of fibres in each leg muscle from the XNH volume. The colour code for muscles is shown in c. b, Schematic of musculature, separated into muscle groups that drive the leg to swing forward or reach (orange) versus muscles that push the body forward (blue). Inset, joint angles measured from a fly walking on a spherical treadmill (data from ref. 26). c, MNs reconstructed from electron microscopy data, grouped by leg segment (rows, labelled at right) and by muscle target (each square). Grey scale indicates different MNs, orange versus blue indicates swing versus stance. The femur reductor MNs that target the trochanter, whose function is unknown, are indicated by a red square. Acc, accessory; Fe, femoral; Pl, pleural; Sternotr., sternotrochanter; Ta, tarsal; Tergotr., tergotrochanter; Ti, tibial; Tr, trochanter. Scale bar, 50 μm. d, Left, schematic of the LTM, a multi-joint muscle with fibres in both the femur (ltm2) and tibia (ltm1) that insert onto the same long tendon (retractor unguis, dark gold line in the schematic) and control the tarsal claw. Right, four LTM MNs have extensive medial branches; two target ltm2, two target ltm1. The specific targets of four smaller LTM MNs cannot be resolved from the XNH volume.
Fig. 5 |
Fig. 5 |. Identification of wing MNs in FANC.
a, Schematic showing muscles that power and finely control wing motion. Indirect power muscles (green) span the thorax along the anterior–posterior and dorsal–ventral axes; their antagonistic contractions resonate the thorax at high frequencies and cause the wings to move back and forth during flight. Direct muscles attach directly to sclerites of the wing hinge and finely adjust the wing motion. Tension muscles attach to the inner wall of the thorax and internal apodemes, and their contractions are thought to alter the tension of the thorax, thus modifying the oscillations generated by the indirect power muscles. Also pictured is the VNC, with the nerves that carry MN axons to wing muscles (PDMN, ADMN and MesoAN). b, Electron microscopy image from FANC showing a cross-section of the ADMN. MN axons are coloured according to the key in a. MNs that innervate muscles with similar attachment points often fasciculate together in the nerve. Horizontal black lines are due to missing slices from the serial-sectioned reconstructed volume. Scale bar, 5 μm. c, Segmented and proofread MNs from FANC that innervate indirect MNs. We could not differentiate the MNs that innervate individual DVM fibres within each muscle (DVM1, DVM2 or DVM3), so they share a common label (that is, DVM1a–c refers to all three MNs that innervate DVM1). See methods for details on identification for ce. d, Segmented and proofread MNs from FANC that innervate direct muscles. e, Segmented and proofread MNs from FANC that innervate tension muscles.
Fig. 6 |
Fig. 6 |. Circuits that coordinate the wings and legs during escape take-off.
a, Schematic of a proposed circuit for escape based on prior literature and FANC connectivity predictions. The giant fibre excites wing and middle (T2) leg MNs as well as preMNs through gap junctions. In FANC, preMNs that are electrically coupled to the giant fibre target T1 tibia and trochanter–femur flexor MNs as well as MNs that innervate T2 leg tergotrochanter muscles, DLMs and thorax tension muscles (pleurosternal). b, We identified interneurons that have been previously shown to be electrically coupled to the giant fibre. Top, GFC4 preMNs from hemilineage 11A. Bottom, GFC2 preMNs from hemilineage 18B. The interneurons make synapses (spheres) onto MNs that drive jumping in the T2 legs (yellow) and flexion of the T1 legs (blue), and initiate the flight motor (green and pink). A single interneuron in each group is represented in black to show morphology. Additional colours in T1 indicate synapses onto MNs other than tibia and trochanter flexors. L, lateral. c, PreMNs that are electrically coupled to the giant fibre exclusively make chemical synapses onto the largest MNs innervating tibia and trochanter–femur flexor muscles, suggesting that this circuit motif bypasses the recruitment hierarchy to execute the fast, high-force movements necessary for escape.

References

    1. Phelps JS et al. Reconstruction of motor control circuits in adult Drosophila using automated transmission electron microscopy. Cell 184, 759–774.e18 (2021). - PMC - PubMed
    1. Meissner GW et al. A searchable image resource of Drosophila GAL4 driver expression patterns with single neuron resolution. eLife 12, e80660 (2023). - PMC - PubMed
    1. Kuan AT et al. Dense neuronal reconstruction through X-ray holographic nanotomography. Nat. Neurosci 23, 1637–1643 (2020). - PMC - PubMed
    1. Tuthill JC & Wilson RI Mechanosensation and adaptive motor control in insects. Curr. Biol 26, R1022–R1038 (2016). - PMC - PubMed
    1. Baek M & Mann RS Lineage and birth date specify motor neuron targeting and dendritic architecture in adult Drosophila. J. Neurosci 29, 6904–6916 (2009). - PMC - PubMed

MeSH terms

LinkOut - more resources