. 2024 Jul;631(8021):593-600.
doi: 10.1038/s41586-024-07613-8. Epub 2024 Jun 26.

Transposase-assisted target-site integration for efficient plant genome engineering

Affiliations

Transposase-assisted target-site integration for efficient plant genome engineering

Peng Liu et al. Nature. 2024 Jul.

Abstract

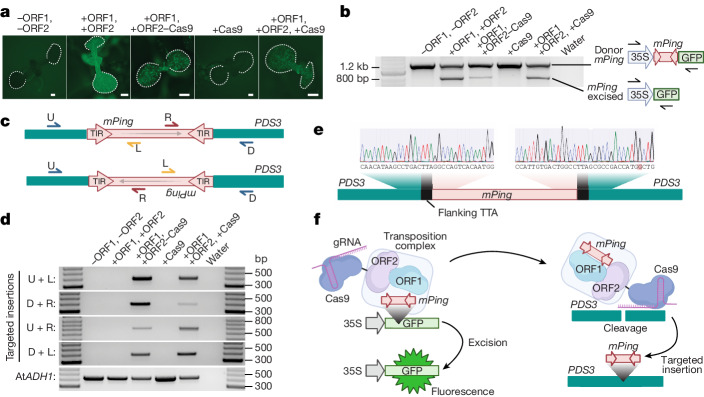
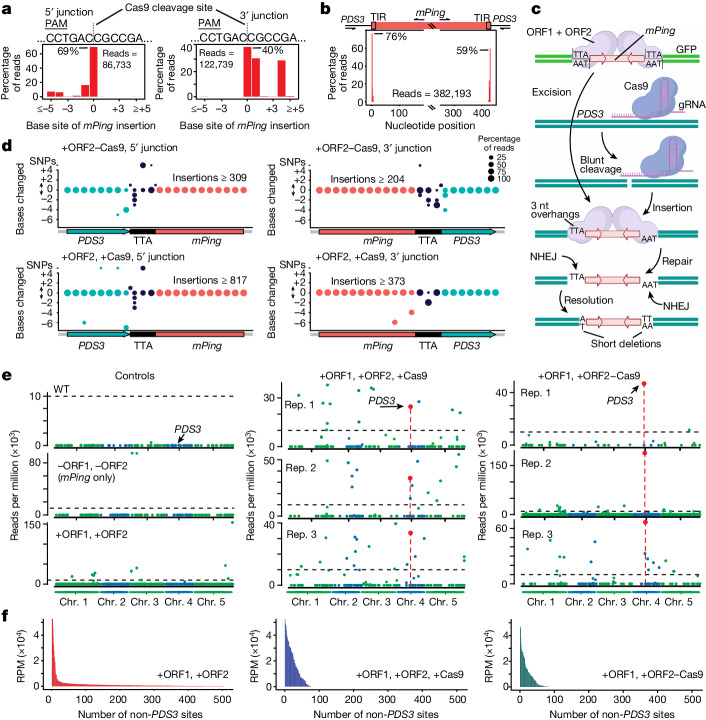
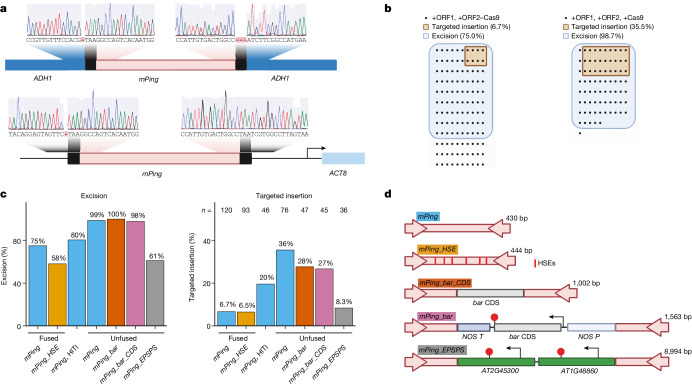
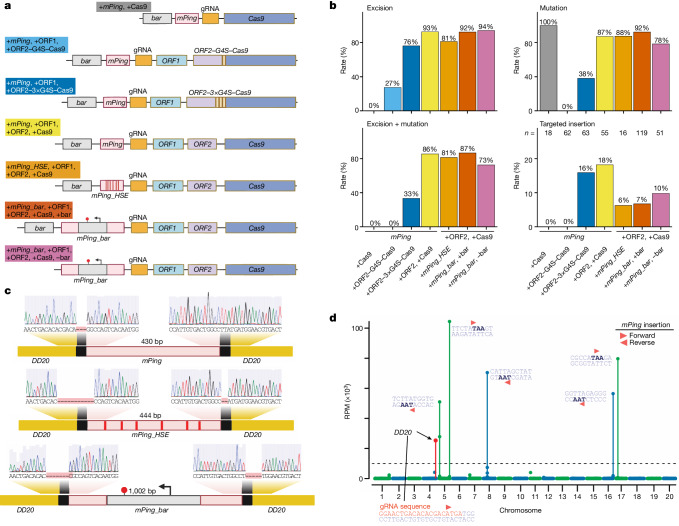
The current technologies to place new DNA into specific locations in plant genomes are low frequency and error-prone, and this inefficiency hampers genome-editing approaches to develop improved crops1,2. Often considered to be genome 'parasites', transposable elements (TEs) evolved to insert their DNA seamlessly into genomes3-5. Eukaryotic TEs select their site of insertion based on preferences for chromatin contexts, which differ for each TE type6-9. Here we developed a genome engineering tool that controls the TE insertion site and cargo delivered, taking advantage of the natural ability of the TE to precisely excise and insert into the genome. Inspired by CRISPR-associated transposases that target transposition in a programmable manner in bacteria10-12, we fused the rice Pong transposase protein to the Cas9 or Cas12a programmable nucleases. We demonstrated sequence-specific targeted insertion (guided by the CRISPR gRNA) of enhancer elements, an open reading frame and a gene expression cassette into the genome of the model plant Arabidopsis. We then translated this system into soybean-a major global crop in need of targeted insertion technology. We have engineered a TE 'parasite' into a usable and accessible toolkit that enables the sequence-specific targeting of custom DNA into plant genomes.


Conflict of interest statement

Part of the funding that supported this research in the Slotkin laboratory was provided by Bayer Crop Science. X.Y. and L.A.G. work to improve crop gene editing for the for-profit company Bayer Crop Science. Patents have been filed with inventors R.K.S. and P.L. at the Donald Danforth Plant Science Center, and the technology is licensed to Bayer Crop Science for research purposes. The following patents have been filed, with R.K.S. and P.L. listed as inventors on both: (1) “Targeted insertion via transposition”; pending application numbers, US18/282,139, EP22772096.8, CA3,212,093 and AU2022237499A1; applicant, Donald Danforth Plant Science Center. (2) “Targeted insertion via transposition”; pending application number PCT/US2023/078837; applicant, Donald Danforth Plant Science Center.

Figures

Fig. 1
Fig. 1. The combined activities of a transposase and programmable nuclease result in targeted insertion.
a, Excision of the mPing TE from a GFP reporter restores fluorescence. Arabidopsis seedlings were imaged; the cotyledons are outlined with a white dashed line. ‘ORF2–Cas9’ represents a translational fusion of these proteins. Scale bars, 500 μm. b, Excision of mPing assayed by PCR in pooled seedlings. The top band represents mPing within GFP (donor position), and the smaller band is generated after mPing excision. c, PCR primer design for detecting targeted insertions of mPing at the PDS3 locus. U and D are PDS3 primers that surround the CRISPR target site. R and L are mPing primers. TIR, terminal inverted repeat. d, PCR amplification analysis of targeted insertions of mPing at the PDS3 locus in pooled seedlings. AtADH1 was the PCR control. e, Sanger sequencing of the insertion junctions generated after mPing insertion into PDS3. The light grey bars behind the DNA-sequencing peaks represent quality scores for each base call. Bases highlighted in red are mismatches compared with the reference sequence. The flanking TTA sequence that comes with mPing from the donor site is annotated. f, Model of targeted insertion of mPing at the PDS3 locus. A functional ORF2–Cas9 fusion protein excises mPing out of the 35S–GFP donor site, cuts the PDS3 gene guided by the gRNA and mPing is inserted into the PDS3 target site. The diagram in f was created using BioRender.
Fig. 2
Fig. 2. Precision of targeted insertion events.
a, The dashed line marks the Cas9 cleavage site on the PDS3 target sequence before TE integration. Insertion sites are assayed at the 5′ (relative to PDS3) (left) or 3′ junction (right) of mPing insertions. The ‘0’ site marks insertion at the exact Cas9-cleavage site. PAM, protospacer adjacent motif. b, Sequencing analysis of targeted insertion junction points mapped to mPing indicates how much of the mPing element was delivered to the targeted insertion site. The x axis shows the nucleotide position along the mPing element. The break in the x axis represents the interior of mPing that was not assayed. c, Model mPing excision by an ORF2 transposase-generated staggered break, blunt cleavage of the target site by Cas9, then integration, repair and resolution of mPing at the target site by NHEJ. The diagram was created using BioRender. d, Nucleotide (nt) variation at the junction of mPing insertions into PDS3. The precision of each nucleotide at the insertion site was determined on the 5′ junction (left) or 3′ junction (right). The size of the circle represents the percentage of reads in which that nucleotide is as expected (y = 0), has an insertion (y ≥ 1) or deletion (y ≤ −1). The number of SNPs at the insertion site is shown at the top of the y axis. Pearson’s χ2 tests were used to test the statistical significance of the difference in polymorphism between the two protein configurations. e, mPing insertion sites in pooled seedlings. The Arabidopsis nuclear genome is displayed on the x axis. The PDS3 target site is shown with an arrow and red datapoint. The scale of each y axis was determined by the maximum datapoint. A dashed line at 10,000 reads per million (RPM) is shown for each sample. Chr., chromosome; Rep., distinct biological replicates; WT, wild type. f, Quantitative analysis of the number and read support of free-transposition sites in pooled replicates for each genotype.
Fig. 3
Fig. 3. Programmability of the insertion site and cargo.
a, Sanger sequencing analysis of the junctions of mPing-targeted insertion events in the ADH1 gene and in the non-coding region upstream of ACT8. b, Visualization of the rate of targeted insertion upstream of ACT8. Each dot represents a distinct T1 transgenic plant, and the plants with mPing excision (blue) and targeted insertion (orange) are marked. c, Measurement of the excision frequency of mPing from the donor site (left) and rate of targeted insertion (right). n is the number of T1 transgenic Arabidopsis plants analysed. The colour of each data bar corresponds to the mPing cargo colour code in d. d, The cargo of different mPing versions demonstrated to excise and undergo targeted insertion in the Arabidopsis genome. NOS P–bar–NOS T is an expression cassette that expresses a herbicide-resistance gene, and bar CDS is the protein-coding region without the promoter and terminator. mPing versions are not drawn to scale, and the size of each is indicated.
Fig. 4
Fig. 4. Targeted insertions in the soybean genome.
a, The configurations of seven different transgenes that were tested for targeted insertion. The label colour corresponds to the data bars in b. b, Rates of mPing excision (top left), Cas9-mediated mutations (SNPs) (top right), plants with both excision and mutation (bottom left) and targeted insertions (bottom right) in transgenic regenerated (R0) soybean plants. Both junctions of mPing must be found at the DD20-targeted insertion site to be counted as a positive targeted insertion event. n is the number of transgenic individuals tested. c, Sanger sequencing of the junctions of mPing, mPing_HSE and mPing_bar insertions into the soybean DD20 non-coding target site. d, Insertion-seq defines the locations of mPing in the genome of a single R0 soybean plant. The soybean nuclear genome is displayed on the x axis. Insertion is detected at the DD20 targeted insertion site (red datapoint) as well as at six other sites. These other sites do not have similarity to the gRNA sequence, but are TAA/TTA sites favoured for insertion from free transposition of mPing. The triangles denote the orientation of mPing insertion. A black dashed line at 10,000 RPM is shown.
Extended Data Fig. 1
Extended Data Fig. 1. Published data in support of the model of mPing excision.
The ORF1 and ORF2 proteins are expressed from the Pong transposon and bind the mPing element to form a transposition complex,. ORF1 is a Myb-like DNA binding protein that binds to at least 15 base pairs of the mPing terminal inverted repeat (TIR) sequence. ORF2 is the canonical transposase (TPase) with the DDE catalytic motif necessary for mPing excision and insertion,. The flanking nucleotides (TTA or TAA) that are immediately adjacent to the TIRs at the donor site are necessary for efficient mPing excision. The ORF1 and ORF2 proteins directly interact and are both required for mPing excision from the donor site,. After excision, the donor site is repaired by NHEJ using the microhomology of the staggered cut overhangs left by excision. This allows for very precise repair of the excision site, often reestablishing the coding frame of the mPing donor site,,. The transposition complex remains associated with the extra-chromosomal mPing DNA as it is also responsible for catalysing insertion.
Extended Data Fig. 2
Extended Data Fig. 2. Transposable element excision generated by Cas9-fused proteins.
a. Diagram of fusion proteins tested. Twelve different transgenes were created and transformed into Arabidopsis. Cas9 and derivative proteins were fused either to the Pong transposase ORF1 or ORF2 protein coding regions. Both N- and C-terminal translational fusions were created using the G4S flexible linker. Three different versions of Cas9 were used: double-strand cleavage Cas9, the single stranded nickase, and the catalytically dead dCas9. When a functional transposase protein is generated by expression of ORF1 and ORF2, it excises mPing out of the 35S-GFP donor location in the Arabidopsis genome, producing fluorescence. b. Excision of the mPing TE from GFP restores the plant’s ability to generate fluorescence. Images of representative Arabidopsis seedlings showing GFP fluorescence for all 12 fusion proteins. The cotyledons are outlined with a white dashed line. Size bars represent 500 μm. A subset of this experiment is shown as Fig. 1a. c. Excision of mPing assayed by PCR of pooled seedlings of the twelve different translational fusions from part a, and controls. The top band represents mPing within GFP (donor position), and the smaller band is generated upon mPing excision. The arrows indicate the pair of primers used for PCR. d. Sanger sequencing of the PCR product upon mPing excision. Grey bars behind the sequencing peaks represent quality scores for each base call.
Extended Data Fig. 3
Extended Data Fig. 3. Efficiency of ORF2-Cas9 fusion proteins.
a. High Resolution Melt (HRM) analysis to test gRNA efficiency. Mutations created by Cas9 were detected for genomic loci PDS3, ADH1, or the region upstream of ACT8. PCR product melting dynamics differed between the WT plants (pink) and Cas9 positive control lines with the indicated gRNA (purple). The melting temperature difference is caused by the generation of short indels and SNPs upon Cas9 cleavage and repair by NHEJ, verifying that all three gRNAs are functional in Arabidopsis plants. b. Representative pds3 homozygous mutant white seedling from plants with the catalytically-active Cas9 fusion protein. c. The ratio of white pds3 T2 seedlings for all Cas9 fusion proteins tested. d. Efficiency of ORF2-Cas9 fusion proteins in yeast. mPing excision frequency (blue, left Y-axis) and Cas9 mutation frequency (orange, right Y-axis) measured for unfused and fused ORF2 and Cas9 with three different protein-protein linker sequences. The ORF2 protein’s C-terminus is fused to Cas9 via a 1xG4S, 3xG4S or 16AA linker. mPing excision was measured as the number of ADE2 revertant colonies due to mPing excision per million cells. The average and standard deviation for multiple biological replicates (n = 6) are shown (blue). Cas9 mutation frequency was measured by testing the gRNA-targeted canavanine resistance of the ADE2 revertant colonies (n = 48). This experiment was performed two times independently to ensure reproducibility.
Extended Data Fig. 4
Extended Data Fig. 4. Targeted insertions of mPing at the PDS3 gRNA target site.
a. PCR assay as described in Fig. 1c for the 12 fusion proteins generated in Extended Data Fig. 2a and controls. PCR negative controls include a line lacking the Cas9, ORF1 and ORF2 proteins (-ORF1,-ORF2), a line with ORF1 and ORF2 but no Cas9 (+ORF1, + ORF2), and a no-template DNA PCR reaction (water). Among the 12 fusion proteins, only ORF2-Cas9 displays the correct size band for targeted insertions. Insertions were verified by Sanger sequencing of the PCR products. b. Western blots using the Cas9 and Actin11 antibodies, showing that the ORF2-Cas9 and ORF2-dCas9 proteins are expressed in transgenic plants as full-length fusion proteins. Upper panel shows that both ORF2-Cas9 and ORF2-dCas9 have the expected size of ~216 kDa (Cas9 is 150 kDa and ORF2 is 66 kDa). Lower panel compares the size of the unfused Cas9 with the ORF2-Cas9 fusion protein. Raw images of the Westerns are shown in Supplementary Fig. 1. c. Sanger sequencing of the junctions of targeted integration events into the PDS3 gene. PCR products from panel a were cloned into the pCR4_TOPO TA vector and 9 individual colonies were sequenced per PCR reaction. The triangle represents where Cas9 cuts in the gRNA target sequence. The flanking TTA/TAA sequence is present at some insertion junctions and absent in others. The PDS3 sequence is shown in blue, the gRNA target site is highlighted in grey, mPing is shown as red text, and the flanking TTA/TAA sequences are shown in black text.
Extended Data Fig. 5
Extended Data Fig. 5. Cas12a-mediated targeted insertions.
a. Diagram of the multiplexed vector cassette that generates two distinct Cas12a gRNAs, one that targets ADH1 and one that targets upstream of ACT8. b. PCR assay to detect excision of mPing generated by functional ORF1 and ORF2 proteins. Fusing these proteins to Cas12a does not stop excision activity. c. Diagram of the four PCR reactions to detect targeted insertions into ADH1. Arrows indicate primers used to detect targeted insertions: U + L, D + R, U + R, D + L. d. Diagram of the four PCR reactions to detect targeted insertions into the region upstream of ACT8. e. PCR assay to detect targeted insertion of mPing into ADH1. Targeted insertions are detected for both protein fusions to Cas12a as well as in the unfused configuration. f. PCR assay to detect targeted insertion of mPing into the region upstream of ACT8. Targeted insertions are detected for both protein fusions to Cas12a as well as in the unfused configuration. g. Sanger sequencing of a mPing targeted insertion into ADH1 mediated by Cas12a cleavage. h. Sanger sequencing of a mPing targeted insertion into the region upstream of ACT8 mediated by Cas12a cleavage.
Extended Data Fig. 6
Extended Data Fig. 6. mPing insertion at gRNA off-target sites.
a. Venn diagrams of mPing insertion sites (excluding PDS3) in common between biological replicates. Data is from Fig. 2e,f. b. Insertion of mPing at CRISPR/Cas9 predicted off-target sites. Data display is the same as Fig. 2e. Different from Fig. 2e, only PDS3 and the predicted CRISPR/Cas9 off-target regions of the genome are interrogated.
Extended Data Fig. 7
Extended Data Fig. 7. DNA methylation analysis and a one-component transgene system.
a. Amplicon deep sequencing of enzymatic-converted DNA methylation patterns. The average methylation level across the amplicon is shown for each cytosine context (CG, CHG, CHH (H = A,T,C)), with 95% confidence intervals calculated using the Wilson score interval method. On the left is the ADH1 insertion site before mPing insertion, broken where mPing will insert and either side of the insertion site is analysed separately. On the right is the methylation after mPing insertion. A dash line denotes the background non-conversion rate of the enzymatic reaction determined for each sample by sequencing an unmethylated region of the genome. This conversion percentage is also listed below each genotype. Biological replicates are denoted as “Rep 1” vs. “Rep 2”. n= the number of total cytosines assayed for each amplicon. b. Map of a single vector containing the mPing donor element, the gRNA and protein machinery required to obtain mPing targeted insertions (+ORF1, + ORF2-Cas9). c. PCR-based targeted insertion assay (as in Fig. 1c,d) in pooled seedlings using the one-component transgene system. Targeted insertions are detected in each reaction. d. Sanger sequencing of the junctions of a targeted insertion event in the Arabidopsis PDS3 gene generated from the single vector one-component transgene system shown in panel b.
Extended Data Fig. 8
Extended Data Fig. 8. Insertion of heat shock elements (HSEs) as mPing cargo.
a. Experimental design and generation of the synthetic 444 bp ‘mPing_HSEs’ element. b. Excision assay by PCR (as in Fig. 1b) in pooled seedlings shows the mPing_HSEs element is capable of excision. The excised product is easier to detect if the genomic DNA is digested with the SspI restriction enzyme before PCR (SspI site is in mPing_HSEs). c. PCR assay detecting targeted insertions (as in Extended Data Fig. 5d) of mPing_HSEs into the region upstream of the ACT8 gene. The ‘T2 (pooled)’ sample represents a pool of T2 seedlings, while ‘T2 #1’, ‘T2 #2’, etc… are individual T2 plants. Red arrowheads denote PCR products that were verified as targeted insertions by Sanger sequencing. d. Sanger sequencing of the junctions of a mPing_HSEs targeted insertion into the region upstream of ACT8. e. Sanger sequencing across the majority of the mPing_HSEs element and into the region upstream of ACT8 demonstrates that all six HSEs were successfully delivered to this region. The arrows on the top cartoon indicate the pair of primers used for PCR. The Sanger sequencing represents the contig of several sequencing reactions from a single TOPO TA plasmid clone of a PCR product. The sequence is annotated above, including the six HSEs as red pointed boxes.
Extended Data Fig. 9
Extended Data Fig. 9. Targeted insertion of a gene and CDS as mPing cargos.
a. Excision assay by PCR (as in Fig. 1b) in pooled seedlings shows the mPing_bar CDS and mPing_bar versions are capable of excision. Blue arrowheads indicate the expected size of the amplicon with different sized mPing versions before excision. b. PCR strategy and primer placement to detect targeted insertions of mPing_bar CDS and mPing_bar into the region upstream of ACT8. Arrows indicate primers used to detect targeted insertions: U + L, D + L. The “L” primer is the same for mPing_bar CDS and mPing_bar versions. c. PCR detecting targeted insertions of mPing_bar CDS and mPing_bar into the region upstream of the ACT8 gene. Red arrows indicate correct size PCR products that were verified as targeted insertions by Sanger sequencing. There is no PCR product in the ‘mPing’ sample because the “L” PCR primer site is in the bar CDS region (see panel b).
Extended Data Fig. 10
Extended Data Fig. 10. Targeted insertion of the intact bar gene cassette.
a. PCR strategy and primer placement to detect targeted insertions of the mPing_bar element into the region upstream of the ACT8 gene. The arrows indicate the pair of primers used for PCR. b. Sanger sequencing across the majority of the mPing_bar element and into the region upstream of ACT8 demonstrates the successful delivery of the complete bar gene cassette (including promoter and terminator) into this region. The Sanger sequencing represents the contig of several sequencing reactions from a single TOPO TA plasmid clone of a PCR product.
Extended Data Fig. 11
Extended Data Fig. 11. Targeted insertion of the intact bar CDS.
a. PCR strategy and primer placement to detect targeted insertions of the mPing_bar CDS element into the region upstream of the ACT8 gene. The arrows indicate the pair of primers used for PCR. b. Sanger sequencing across the majority of the mPing_bar CDS element and into the region upstream of ACT8 demonstrates the successful delivery of the complete bar CDS into this region. The Sanger sequencing represents the contig of several sequencing reactions from a single TOPO TA plasmid clone of a PCR product.
Extended Data Fig. 12
Extended Data Fig. 12. The mPing_bar element confers the herbicide resistance trait in soybean.
a. Transgene design and PCR primer placement for “PCR1” to “PCR6” used to genotype for the presence of the mPing_bar/gRNA/ORF1/ORF2/Cas9 parent transgene in R0 transformed soybean plants. b. PCR assay to genotype for the presence of the mPing_bar/gRNA/ORF1/ORF2/Cas9 parent transgene in R0 transformed soybean plants. “PCR1” detects both the original mPing_bar donor and its excision product. “PCR2” to “PCR6” detect different locations on the mPing_bar/gRNA/ORF1/ORF2/Cas9 transgene. GmLe1 is a control gene. The combined data demonstrates that R0 plant #1 has the full transgene in the genome, plant #2 has a partial transgene insertion that lacks the mPing_bar donor site, and plant #3 does not have the mPing_bar/gRNA/ORF1/ORF2/Cas9 transgene.

References

    1. Dong OX, Ronald PC. Targeted DNA insertion in plants. Proc. Natl Acad. Sci. USA. 2021;118:e2004834117. doi: 10.1073/pnas.2004834117. - DOI - PMC - PubMed
    1. Wurtzel ET, et al. Revolutionizing agriculture with synthetic biology. Nat. Plants. 2019;5:1207–1210. doi: 10.1038/s41477-019-0539-0. - DOI - PubMed
    1. Beall EL, Rio DC. Drosophila P-element transposase is a novel site-specific endonuclease. Genes Dev. 1997;11:2137–2151. doi: 10.1101/gad.11.16.2137. - DOI - PMC - PubMed
    1. Tang M, Cecconi C, Kim H, Bustamante C, Rio DC. Guanosine triphosphate acts as a cofactor to promote assembly of initial P-element transposase-DNA synaptic complexes. Genes Dev. 2005;19:1422–1425. doi: 10.1101/gad.1317605. - DOI - PMC - PubMed
    1. Muñoz-López M, García-Pérez JL. DNA transposons: nature and applications in genomics. Curr. Genomics. 2010;11:115–128. doi: 10.2174/138920210790886871. - DOI - PMC - PubMed

MeSH terms