. 2024 Jun;630(8018):984-993.
doi: 10.1038/s41586-024-07552-4. Epub 2024 Jun 26.

Bridge RNAs direct programmable recombination of target and donor DNA

Affiliations

Bridge RNAs direct programmable recombination of target and donor DNA

Matthew G Durrant et al. Nature. 2024 Jun.

Abstract

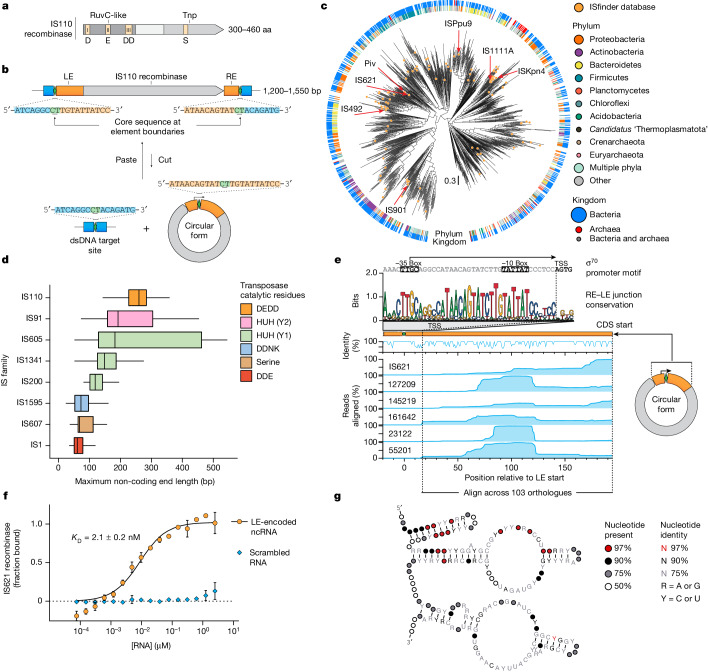
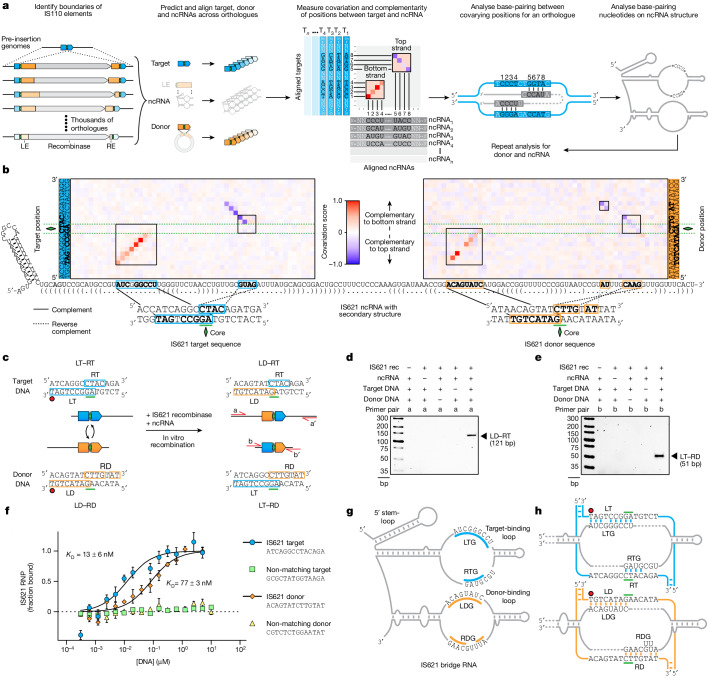
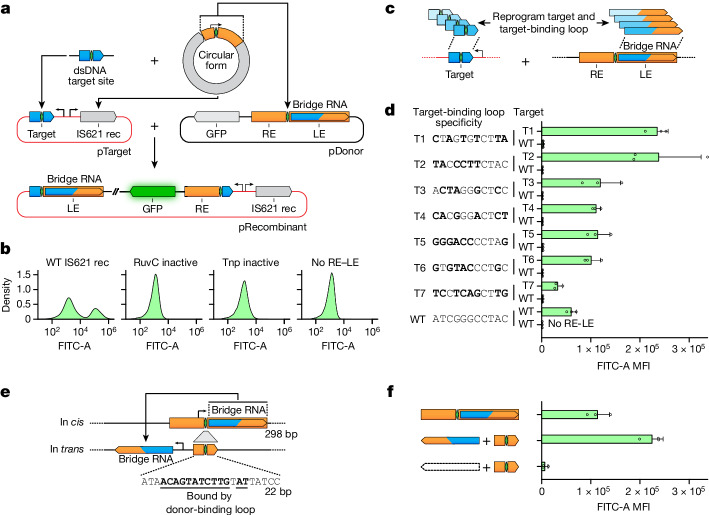
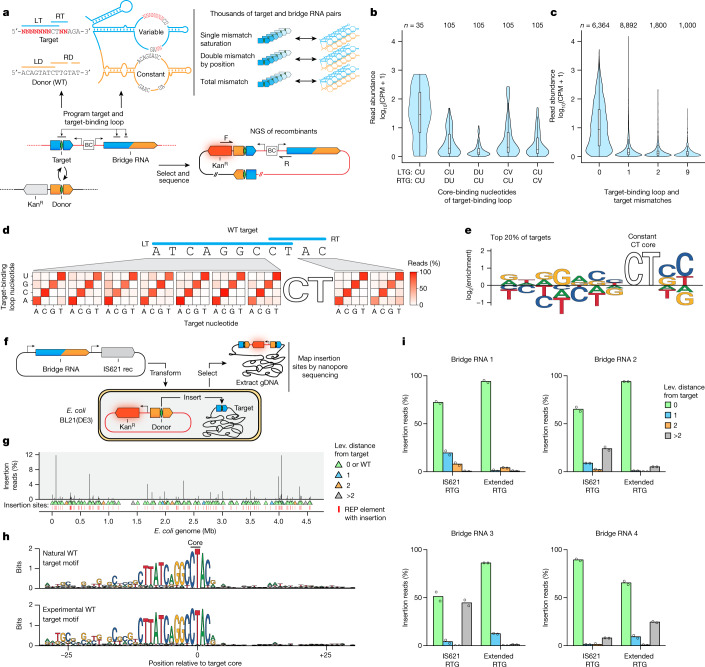
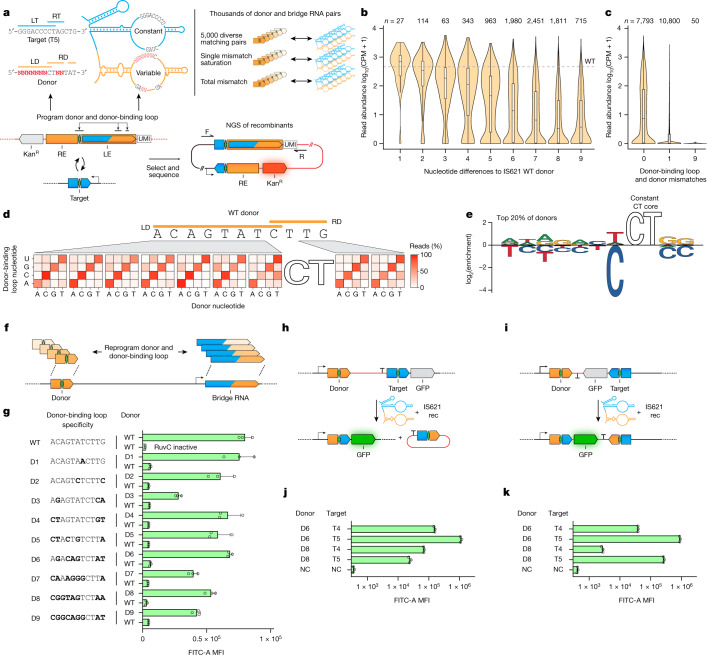
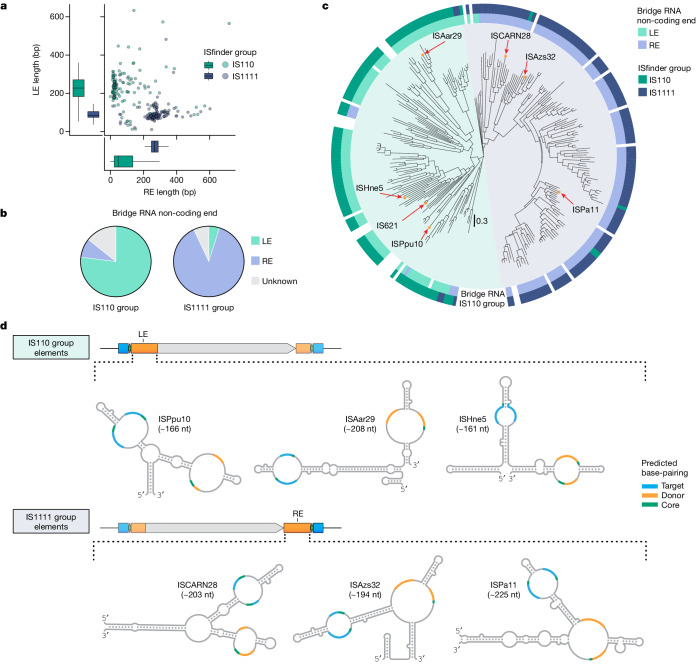
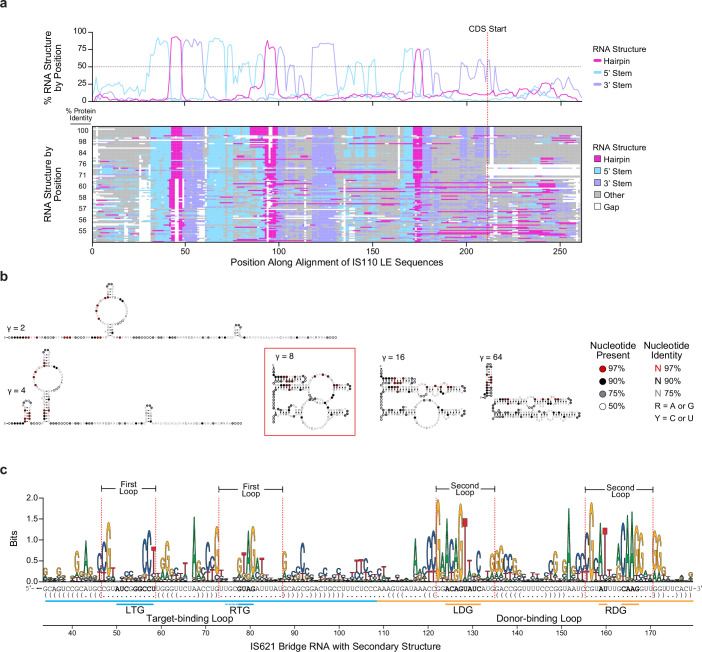
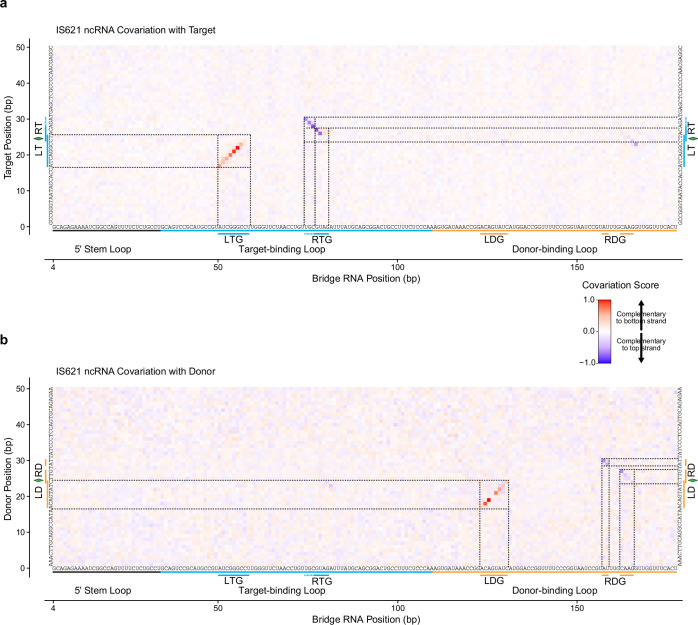
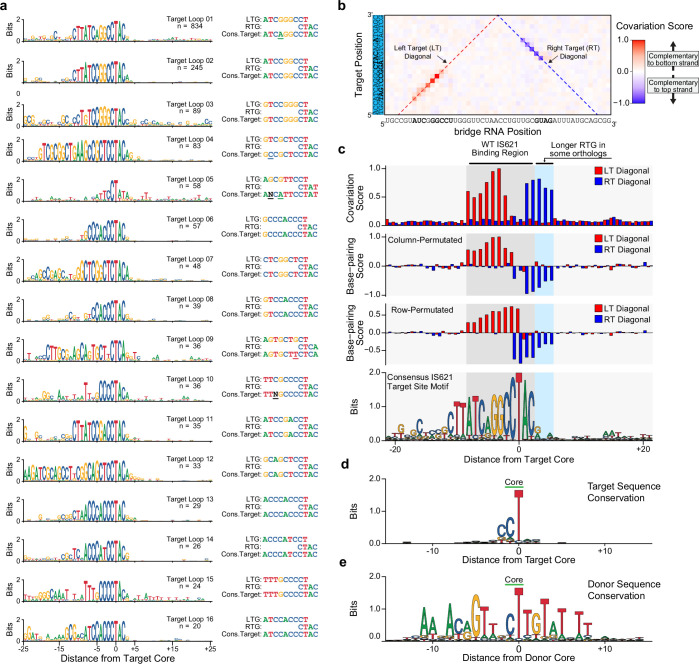
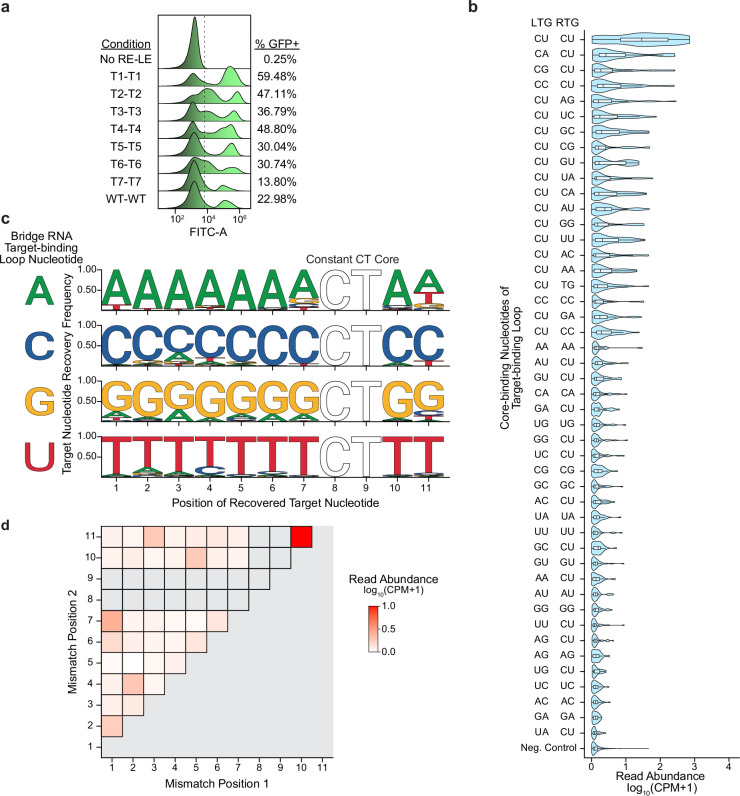
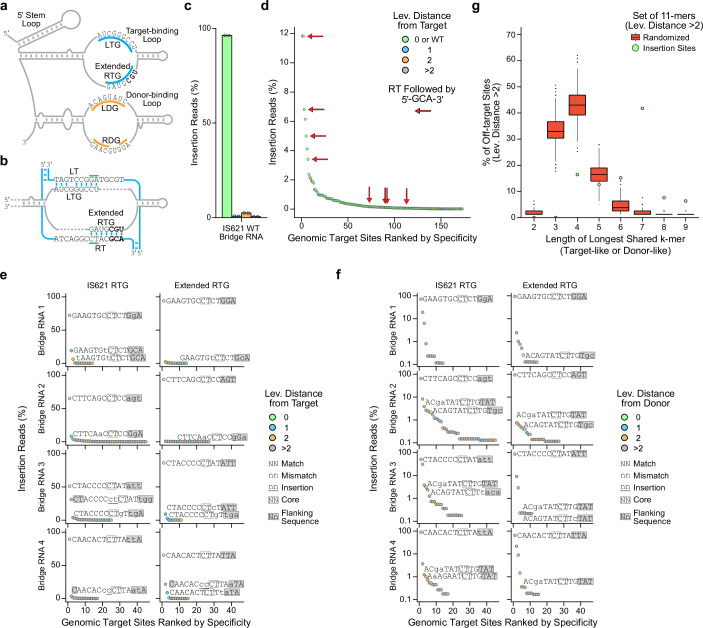
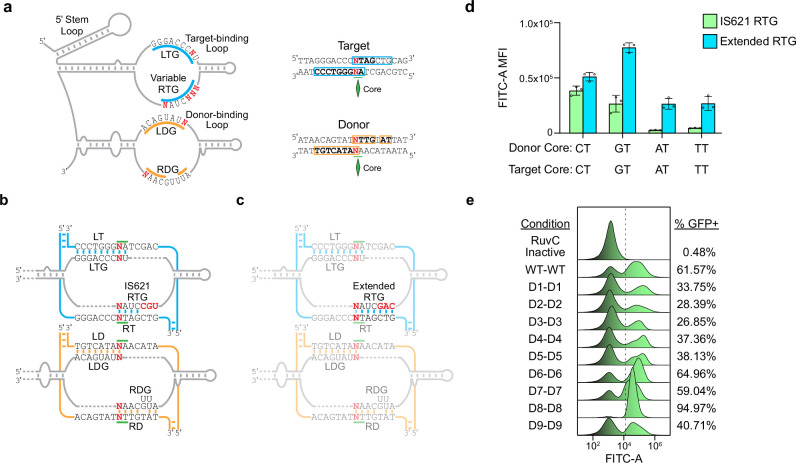
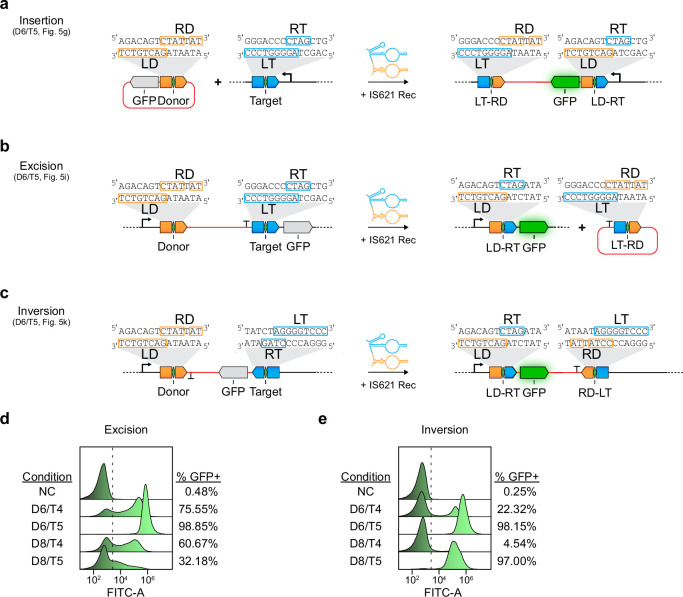
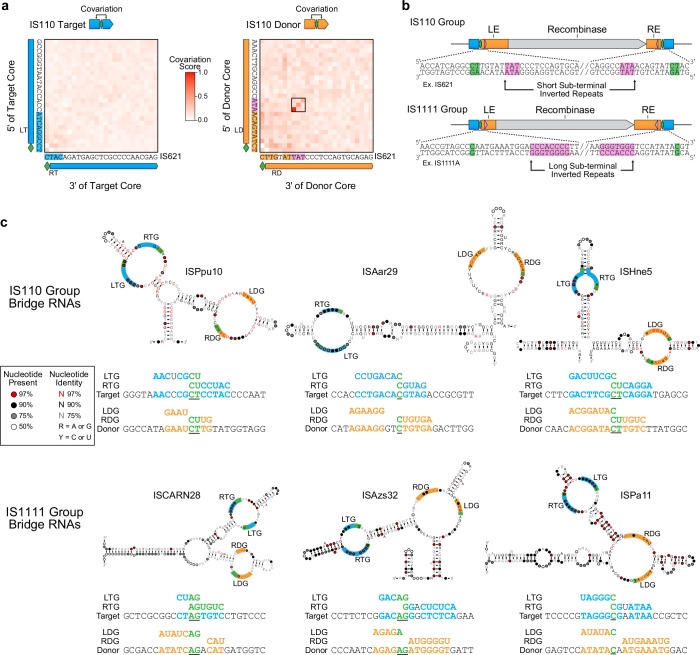
Genomic rearrangements, encompassing mutational changes in the genome such as insertions, deletions or inversions, are essential for genetic diversity. These rearrangements are typically orchestrated by enzymes that are involved in fundamental DNA repair processes, such as homologous recombination, or in the transposition of foreign genetic material by viruses and mobile genetic elements1,2. Here we report that IS110 insertion sequences, a family of minimal and autonomous mobile genetic elements, express a structured non-coding RNA that binds specifically to their encoded recombinase. This bridge RNA contains two internal loops encoding nucleotide stretches that base-pair with the target DNA and the donor DNA, which is the IS110 element itself. We demonstrate that the target-binding and donor-binding loops can be independently reprogrammed to direct sequence-specific recombination between two DNA molecules. This modularity enables the insertion of DNA into genomic target sites, as well as programmable DNA excision and inversion. The IS110 bridge recombination system expands the diversity of nucleic-acid-guided systems beyond CRISPR and RNA interference, offering a unified mechanism for the three fundamental DNA rearrangements-insertion, excision and inversion-that are required for genome design.


Conflict of interest statement

P.D.H. acknowledges outside interest in Stylus Medicine, Circle Labs, Spotlight Therapeutics, Arbor Biosciences, Varda Space, Vial Health and Veda Bio, in which he holds various roles including as co-founder, director, scientific advisory board member or consultant. M.G.D. acknowledges outside interest in Stylus Medicine. P.D.H., M.G.D., N.T.P., S.K., J.S.A., M.H. and H.N. are inventors on patents relating to this work. The remaining authors declare no competing interests.

Figures

Fig. 1
Fig. 1. IS110 mobile genetic elements express a ncRNA that is bound by its encoded recombinase.
a, Schematic representation of the IS110 recombinase protein sequence. b, Schematic representation of the structure and life cycle of an IS110 element. Core sequences are depicted as green diamonds, the genomic target site is shown in blue and the non-coding ends are orange. Sequences are from IS621. c, A midpoint-rooted phylogenetic tree constructed from 1,054 IS110 recombinase sequences. d, Distribution of non-coding end lengths across eight IS families. The maximum of the LE and RE lengths is plotted for each family. Box plots show median (centre line), interquartile range (IQR) (box edges) and 1.5 × IQR (whiskers). Outliers not shown. n = 268 for IS110; n = 18–184 for other families (Extended Data Fig. 2). e, Small RNA-seq coverage plot of the concatenated non-coding ends of IS621 and five related orthologues expressed from their endogenous promoter in E. coli. Top, sequence logo of the conservation of the σ70 promoter motif. TSS, transcription start site. f, MST of a fluorescently labelled IS621 recombinase with either WT or scrambled ncRNA to measure the equilibrium dissociation constant (KD). Mean ± s.d. of three technical replicates. g, Consensus secondary structure of ncRNAs constructed from 103 IS110 LE sequences.
Fig. 2
Fig. 2. Identification of IS621 bridge RNA binding loops with sequence-specific recognition of target and donor DNA.
a, Schematic of the computational approach to assess the base-pairing potential between the IS110 ncRNA and its cognate genomic target site or donor sequence. Covariation analysis between target–ncRNA or donor–ncRNA pairs yields a matrix in which diagonal stretches of red signal indicate ncRNA complementarity to the bottom strand of the DNA and blue stretches indicate complementarity to the top strand. b, Nucleotide covariation and base-pairing potential between the ncRNA and the target (left) and donor (right) sequences across 5,511 ncRNA–target pairs and 2,201 ncRNA–donor pairs. The IS621 ncRNA sequence is shown across the x axis, along with dot-bracket notation predictions of the secondary structure. Covariation scores are coloured according to strand complementarity, with −1 (blue) representing high covariation and a bias toward top-strand base-pairing, and 1 (red) representing high covariation and a bias toward bottom-strand base-pairing. Regions of notable covariation signal indicating base-pairing for IS621 are boxed. Complementary nucleotides within covarying regions are highlighted in bold. c, Schematic of the in vitro recombination (IVR) reaction with IS621. d,e, Gel electrophoresis of the IVR LD–RT PCR product (d) or LT–RD PCR product (e). Results are representative of three technical replicates. Rec, recombinase. f, Binding of target and donor DNA sequences by an IS621 RNP containing fluorescently labelled recombinase and ncRNA, using MST. Mean ± s.d. of three technical replicates. g, Schematic of the IS621 bridge RNA. The target-binding loop contains the LTG and RTG (blue), and the donor-binding loop contains the LDG and RDG (orange). h, Base-pairing model of the IS621 bridge RNA with cognate target and donor DNA.
Fig. 3
Fig. 3. The IS621 target site is reprogrammable and is specified by the bridge RNA.
a, Schematic representation of the plasmid recombination assay with bridge RNA in cis. b, GFP fluorescence of E. coli after DNA recombination of the plasmid reporter system using catalytic variants of the IS621 recombinase. Plots are representative of three replicates. c, Schematic of reprogrammed target and bridge RNA target-binding loop sequences. d, GFP mean fluorescence intensity (MFI) of E. coli after plasmid recombination using the indicated reprogrammed bridge RNA target-binding loop and target sequences (WT and T1–T7). Bold bases highlight differences relative to the WT target sequence. Mean ± s.d. of three biological replicates. e, Schematic of bridge RNA expression in trans. f, Comparison of recombination efficiency with bridge RNA expressed in cis and in trans. Mean ± s.d. of three biological replicates.
Fig. 4
Fig. 4. High-throughput characterization of IS621 target specificity shows flexible programmability.
a, Schematic representation of the target specificity screen. Successful recombination enables the survival of E. coli through the expression of a kanamycin resistance cassette (KanR). The target sequence and bridge RNA are separated by a 12-nt barcode (BC). NGS, next-generation sequencing. b, Mismatch tolerance of the core dinucleotide. Core-binding nucleotides of the target-binding loop are summarized by IUPAC codes, including D (not C) and V (not U). Average counts per million (CPM) of two biological replicates. Box plots show median (centre line), IQR (box edges) and 1.5 × IQR (whiskers). c, Mismatch tolerance between non-core sequences of the target and target-binding loop. Average CPM of two biological replicates. Box plots show median (centre line), IQR (box edges) and 1.5 × IQR (whiskers). d, Mismatch tolerance between target and target-binding loop, as indicated by the percentage of total detected recombinants carrying each nucleotide at each position. Average of two biological replicates. e, Nucleotide enrichment among the top 20% most efficient matched pairs of targets and target-binding loops. f, Schematic of the genome insertion assay in E. coli. g, Genome-wide mapping of insertions mediated by the WT IS621 bridge RNA. The percentage of total reads mapped to each insertion site is depicted and binned by the number of differences from the intended sites as measured by Levenshtein distance. Average of two biological replicates. h, Target site preference of IS621. Sequence logos depict the target site motifs among natural (top, Methods) and experimentally observed (bottom, Fig. 4g) IS621 target sites. i, Genomic specificity profile of four reprogrammed bridge RNAs. Two biological replicates.
Fig. 5
Fig. 5. Bridge RNA donor recoding enables fully programmable insertion, inversion and excision.
a, Schematic representation of the donor specificity screen. A unique molecular identifier (UMI) identifies each paired donor and donor-binding loop. b, Reprogrammability of donor sequences by the number of nucleotide differences from the WT donor. WT donor abundance is indicated by the dashed line. Average CPM of two biological replicates. Box plots show median (centre line), IQR (box edges) and 1.5 × IQR (whiskers). c, Mismatch tolerance between non-core sequences of the donor-binding loop and donor. Average CPM of two biological replicates. Box plots show median (centre line), IQR (box edges) and 1.5 × IQR (whiskers). d, Mismatch tolerance between bridge RNA donor-binding loop and donor by position, as measured by the percentage of total detected recombinants with each indicated mismatch. Average of two biological replicates. e, Nucleotide enrichment among the top 20% most efficient matched pairs of donors and donor-binding loops. f, Schematic representation of the paired reprogramming of the donor and the donor-binding loop. g, Specific recombination using reprogrammed donor and donor-binding loop sequences. Donor sequences are listed on the left, and the bridge RNA is reprogrammed to base-pair with the indicated sequence. Bold bases highlight differences relative to the WT donor sequence. Mean ± s.d. of three biological replicates. h, Schematic representation of the programmable excision assay. i, Schematic representation of the programmable inversion assay. j, Efficient programmable excision of DNA. Pairs of donor and target are denoted. k, Efficient programmable inversion of DNA. Pairs of donor and target are denoted. In j,k, negative control (NC) expresses the reporter and recombinase but no bridge RNA; and data are MFI ± s.d. of three biological replicates.
Fig. 6
Fig. 6. IS110 subfamilies encode distinct and diverse bridge RNA secondary structures in different non-coding end sequences.
a, Non-coding end length distribution for IS110 and IS1111 group elements. Box plots show median (centre line), IQR (box edges) and 1.5 × IQR (whiskers). b, Location of predicted bridge RNA for IS110 and IS1111 group elements. c, Phylogenetic tree of the 274 IS110 recombinases catalogued by ISfinder. d, Bridge RNA consensus structures from six diverse IS110 elements. Secondary structures are shown with internal loops coloured according to the sequence that they complement: target (blue), donor (orange) or core (green).
Extended Data Fig. 1
Extended Data Fig. 1. Conserved residues in the RuvC-like and Tnp domains of IS110.
a, Sequence logo of 213,171 aligned RuvC-like domains identified in IS110 protein sequences. The RuvC-like and Tnp domains shown here were identified using hmmsearch and Pfam models DEDD_Tnp_IS110 (PF01548.19) and Transposase_20 (PF02371.18), respectively. RuvC-like domains were aligned using hmmalign, and these alignments were visualized to identify conserved residues. The conserved residues of the characteristic DEDD motif are highlighted with an arrowhead. The y-axis indicates entropy at each position as measured in bits, with log220 ≈ 4.32 bits being maximally conserved. b, Sequence logo of 208,634 aligned Tnp domains identified in IS110 protein sequences. The Tnp domains were identified, extracted, and analysed using the same procedure as for the RuvC-like domain. A highly conserved serine residue is highlighted with an arrowhead. The y-axis indicates entropy at each position as measured in bits, with log220 ≈ 4.32 bits being maximally conserved.
Extended Data Fig. 2
Extended Data Fig. 2. Maximum non-coding end length distribution of 28 IS families.
Distribution of non-coding end lengths across different IS families. Box plot depicting the distribution of non-coding end lengths across IS families, calculated using maximum RE–LE length of 90% identity clusters. Box plots show median (centre line), IQR (box edges) and 1.5 × IQR (whiskers). Outliers not shown.
Extended Data Fig. 3
Extended Data Fig. 3. Secondary structure alignment of IS621 non-coding ends and consensus secondary structure prediction.
a, Secondary RNA structure alignment of the LE of 103 orthologues of IS621. Secondary RNA structures of the LE of 103 orthologues are predicted and aligned by cluster identity. The percentage of each position corresponding to a 5′ stem, hairpin, or 3′ stem are plotted with a dotted line indicating structures that are conserved in over 50% of sequences. For LE sequences shown along the y-axis, the similarity of their cognate proteins relative to the IS621 recombinase is indicated. This type of visualization was often used throughout the study to determine the presence or absence of a structured ncRNA sequence in the flanks of IS110 recombinase ORFs. b, RNA structures predicted from the LE sequence alignment in a. RNA structures were predicted using ConsAliFold, which uses a parameter γ to control the prediction balance between positive values (or sequence alignment column base-pairings) and negative values (or unpaired sequence alignment columns). Higher values of γ result in more predicted base-pairing. Showing structures resulting from γ = 2, γ = 4, γ = 8, γ = 16, and γ = 64. The value γ = 8 was used for the initial IS621 ncRNA model in this study. c, Nucleotide conservation across the predicted ncRNA. 2,715 ncRNA orthologue sequences were identified using an iterative search with the original IS621 model, and then aligned with cmalign. The x-axis indicates conservation of nucleotides as measured in bits, quantifying entropy. Highlighting the regions within the prominent internal loops with dotted red lines, with dot-bracket RNA secondary structure notation along the x-axis. The first loop has low sequence conservation (average information content = 0.48 ± 0.09), while the second one is much more conserved (average information content = 0.93 ± 0.11). Sequence features of the bridge RNA are highlighted for clarity.
Extended Data Fig. 4
Extended Data Fig. 4. Full ncRNA, target and donor sequence covariation analysis.
a, Expanded schematic of the target–ncRNA covariation data, zoomed out to include the full target and ncRNA sequences used in the analysis. The corresponding IS621 ncRNA sequence and target used in this study is projected along the x-axis. Covariation scores are coloured according to the sign (+1 or −1) of the column-permuted base-pairing score to better visualize base-pairing patterns. Key features of the bridge RNA are highlighted for clarity. b, Expanded schematic of the donor–ncRNA covariation data, zoomed out to include the full donor and ncRNA sequences used in the analysis. Features of the bridge RNA are highlighted for clarity.
Extended Data Fig. 5
Extended Data Fig. 5. Further details of IS110 covariation and sequence analysis.
a, Target sequence motifs associated with 16 distinct bridge RNA target-binding loop guide sequences. All unique guides with 20 or more associated target sequences were retained. For each guide, an 11 bp consensus target sequence was constructed by taking the most abundant nucleotide at each position. If two sequences tied as the most abundant nucleotide, they were represented using ambiguous IUPAC code N. Highlighting the mismatching positions between the target guide and the consensus target. b, Schematic of the target-bridge RNA covariation analysis presented in Fig. 2b with annotations to indicate the left target (LT) diagonal and the right target (RT) diagonal. The values of different metrics along these diagonals are shown in c. c, Boundaries of the programmable positions in the target sequence. The top panel indicates the covariation scores along the LT and RT diagonals as generated by CCMpred, which are normalized between 0 and 1. The second panel shows the column-permuted base-pairing score, which is an additional statistic that can be used to identify nucleotide covariation signals while considering both top- and bottom-strand base-pairing. The sign of this score (+1/−1) is multiplied by the covariation score to generate the covariation signals shown in Fig. 2b and Extended Data Fig. 4. The third panel shows the row-permuted base-pairing score. The bottom panel shows a sequence logo for all identified IS621 insertion sites. All these panels are aligned with respect to the core of the target sequence. d,e, A sequence logo of 5,485 diverse IS621 target (d) and donor (e) sequences. All unique target and donor sequences that were used as input in the covariation analysis are shown here.
Extended Data Fig. 6
Extended Data Fig. 6. Extended results of RNA target-binding loop and target reprogramming.
a, DNA recombination in E. coli with reprogrammed bridge RNAs. The distribution of FITC-A signal for the cell population is shown, with a representative gating strategy for evaluating the percentage of GFP+ cells. T1-T1, T2-T2, etc., represents bridge RNA specificity and provided target, respectively. Plots are representative of 3 replicates featured in Fig. 3d. b, Read abundance of oligos with bridge RNA target-binding loop mutations at the positions that bind to the core sequence. The 2 base-pair nucleotides predicted to bind the core in the target-binding loop LTG and RTG were mutated while holding the target and donor CT cores constant and varying the 9 other programmable positions. All tested core mutation combinations shown were tested for 35 different targets, along with a negative control set (n = 1,000) of 9 mismatch target/target-binding loop combinations. c, Mismatch tolerance at each position of the 11 bp target sequence. The x-axis shows the target position, with the CT core held constant. The top panel shows the target nucleotide recovery frequency when the target-binding loop contains an A at each guide position, the second panel shows the same but when the target-binding loop contains a C at each position, etc. as a percentage of recovered recombinants at each position. d, Double-mismatch tolerance for combinations of positions within the target and target-binding loop. Each cell indicates the average read abundance of oligos that contain double mismatches at the two corresponding positions. The core was held constant. n = 800 double-mismatch combinations measured.
Extended Data Fig. 7
Extended Data Fig. 7. Effect of extended RTGs on the specificity of genome insertion by IS621 bridge RNA and recombinase.
a, Schematic indicating the bases of the WT bridge RNA which may represent an extended RTG. b, Schematic indicating how the target-binding loop of the WT bridge RNA can form more base pairs with a WT 11 bp target sequence flanked on the 5′ end by 5′-GCA-3′. c, Genomic specificity profile of the IS621 WT bridge RNAs. Colour indicates the number of differences from the intended sites as measured by Levenshtein distance. Data represent sums of all insertion sites with 0 or WT (ATCAGGCCTAC), 1, 2 or >2 differences from the expected target. d, Insertion sites into the E. coli genome ranked by abundance. Insertion sites where the RTG flanking bases match the RT flanking bases are indicated with red arrows. e, Genomic insertion sites for reprogrammed bridge RNAs displayed in rank order. High frequency insertion sites are highlighted by descriptions of similarity to the intended target sequence. Colour indicates the number of differences from the expected sites as measured by Levenshtein distance. f, Genomic insertion sites in e recoloured to represent similarity to the WT donor sequence. g, Similarity of off-target sites (Lev. distance > 2 from expected target and donor) to the expected target and donor sequences as measured by the length of the longest shared k-mer. For comparison, off-target sites were randomly shuffled and the procedure was repeated 1,000 times to generate a null distribution (box plots; showing median (centre line), IQR (box edges), 1.5 × IQR (whiskers) and outliers as points). Observed values are shown as blue points.
Extended Data Fig. 8
Extended Data Fig. 8. Dual donor and target reprogramming enables core reprogramming and robust DNA recombination.
a, Schematic representation of core reprogramming with or without RTG extension. The four positions in the guide loops which bind the first base of the core were mutated along with the first base of the core in the target/donor sequences to test if the core sequence can be reprogrammed. The RTG was programmed to allow 7 base binding with the RT or kept as the WT. b, Schematic representation of base-pairing between a target-binding loop with the WT IS621 RTG. c, Schematic representation of base-pairing between a target-binding loop with a reprogrammed and extended RTG. d, Plasmid recombination GFP reporter assay to assess the impact of extended RTG on core programmability. The canonical CT core was mutated to GT, AT, and TT, and tested with the IS621 WT RTG (4 bp) and with an extended RTG (7 bp). MFI ± SD for three biological replicates shown. e, DNA recombination in E. coli with reprogrammed bridge RNAs. The distribution of FITC-A signal for the cell population is shown, with a representative gating strategy for evaluating the percentage of GFP+ cells. D1-D1, D2-D2, etc., represents bridge RNA specificity and provided donor, respectively. Plots are representative of 3 replicates featured in Fig. 5g.
Extended Data Fig. 9
Extended Data Fig. 9. Insertion, excision and inversion using the IS621 bridge recombination system.
a, Schematic of the insertion reaction. Insertion takes place when the target and donor sequences are on different DNA molecules. The orientation of the insertion can be controlled by the strand placement of the target and the donor. b, Schematic of the excision reaction. Excision can occur when the target and donor sequences exist on the same molecule and in the same orientation (i.e. LD and LT are on the same strand). c, Schematic of the inversion reaction. Inversion can be catalysed when the target and donor sequences exist on the same molecule, but in the opposing orientation (i.e. on opposite strands). d, DNA excision in E. coli with reprogrammed bridge RNAs. The distribution of FITC-A signal for the cell population is shown, with a representative gating strategy for evaluating the percentage of GFP+ cells. The donor-target pair is given. Negative control (NC) expresses the reporter with no target or donor, the recombinase, and no bridge RNA. Plots are representative of 3 replicates featured in Fig. 5j. e, DNA inversion in E. coli with reprogrammed bridge RNAs. The distribution of FITC-A signal for the cell population is shown, with a representative gating strategy for evaluating the percentage of GFP+ cells. The donor-target pair is given. Negative control (NC) expresses the reporter with no target or donor, the recombinase, and no bridge RNA. Plots are representative of 3 replicates featured in Fig. 5k.
Extended Data Fig. 10
Extended Data Fig. 10. Detailed analysis of diverse bridge RNA sequences and their predicted target and donor binding patterns.
a, Covariation analysis of IS110 donor sequences identifies a short STIR. Target and donor sequences were analysed using the same covariation analysis introduced in Fig. 2b. Target sequences have no notable covariation signal while donor sequences have a prominent 3-base covariation signal that corresponds with an LT-flanking ATA tri-nucleotide and a RD-flanking TAT tri-nucleotide. b, Schematic depicting sequence features of IS110 and IS1111 group elements. IS110 are characterized by long LEs, short REs, and short STIRs. IS1111 are characterized by short LEs, long REs, and long STIRs. c, Six diverse bridge RNAs and their predicted binding patterns. The bridge RNA consensus structures shown are the same as those presented in Fig. 6d, but with more detail. Secondary structures are shown with internal loops coloured according to the sequence that they complement - target (blue), donor (orange), or core (green). Three members of each IS110 group are shown. For each of the six sequence elements catalogued in ISfinder - ISPpu10, ISAar29, ISHne5, ISCARN28, ISAzs32, and ISPa11 - IS element boundaries were inspected to identify possible base-pairing between the loops, the targets, and the donors. Under each structure, the predicted LTG, RTG, target, LDG, RDG and donor are all shown and aligned with respect to the core (underlined in black).

Update of

References

    1. McClintock, B. The origin and behavior of mutable loci in maize. Proc. Natl Acad. Sci. USA36, 344–355 (1950). - PMC - PubMed
    1. Siguier, P., Gourbeyre, E. & Chandler, M. Bacterial insertion sequences: their genomic impact and diversity. FEMS Microbiol. Rev.38, 865–891 (2014). - PMC - PubMed
    1. Tonegawa, S. Somatic generation of antibody diversity. Nature302, 575–581 (1983). - PubMed
    1. Hoess, R. H., Ziese, M. & Sternberg, N. P1 site-specific recombination: nucleotide sequence of the recombining sites. Proc. Natl Acad. Sci. USA79, 3398–3402 (1982). - PMC - PubMed
    1. Russell, J. P., Chang, D. W., Tretiakova, A. & Padidam, M. Phage Bxb1 integrase mediates highly efficient site-specific recombination in mammalian cells. Biotechniques40, 460–464 (2006). - PubMed