. 2024 Jun;630(8018):994-1002.
doi: 10.1038/s41586-024-07570-2. Epub 2024 Jun 26.

Structural mechanism of bridge RNA-guided recombination

Affiliations

Structural mechanism of bridge RNA-guided recombination

Masahiro Hiraizumi et al. Nature. 2024 Jun.

Abstract

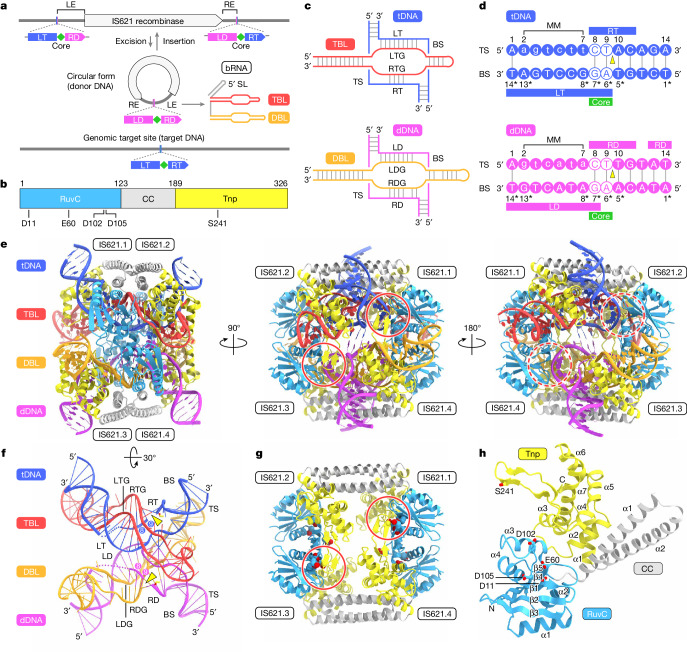
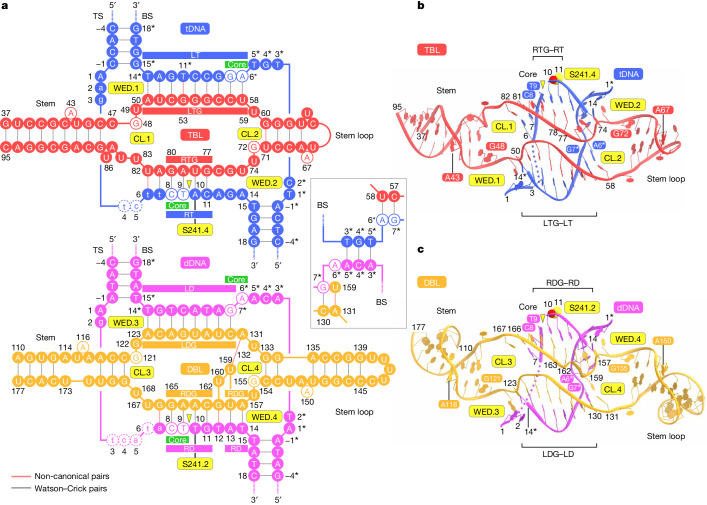
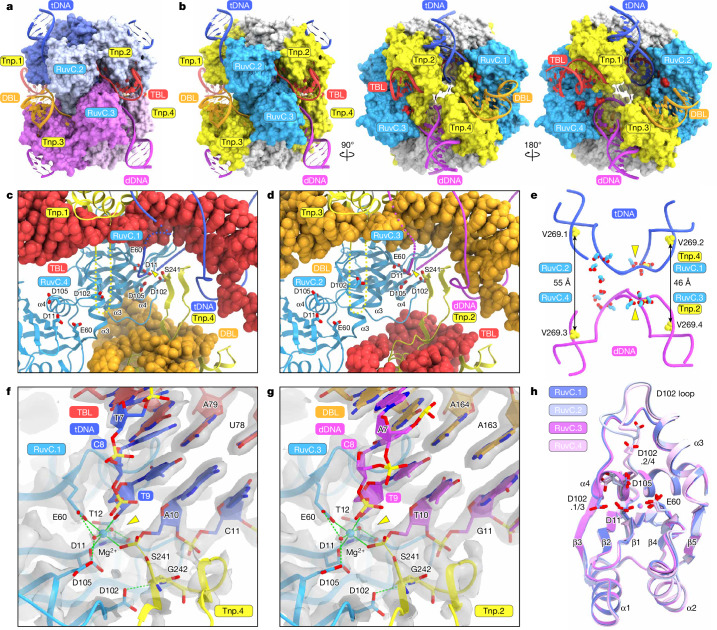
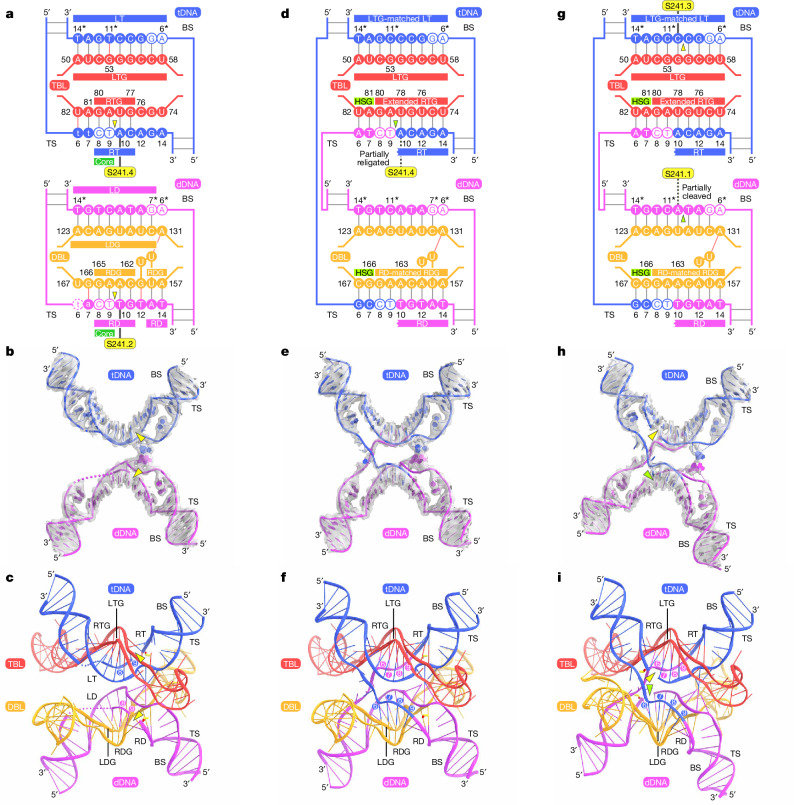
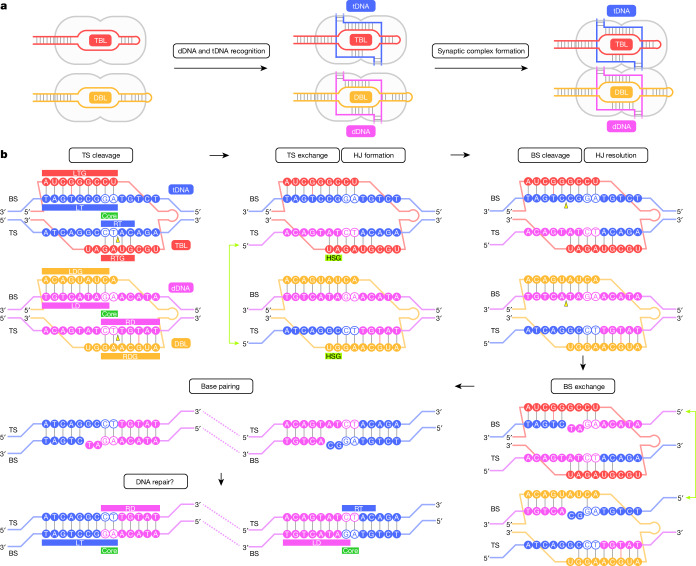
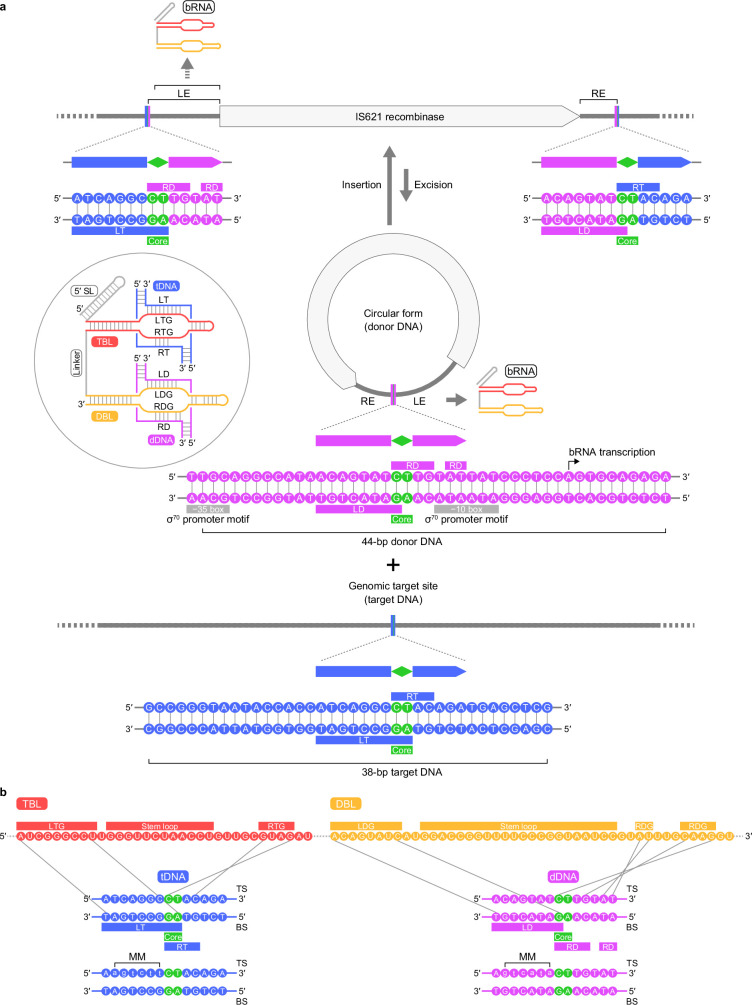
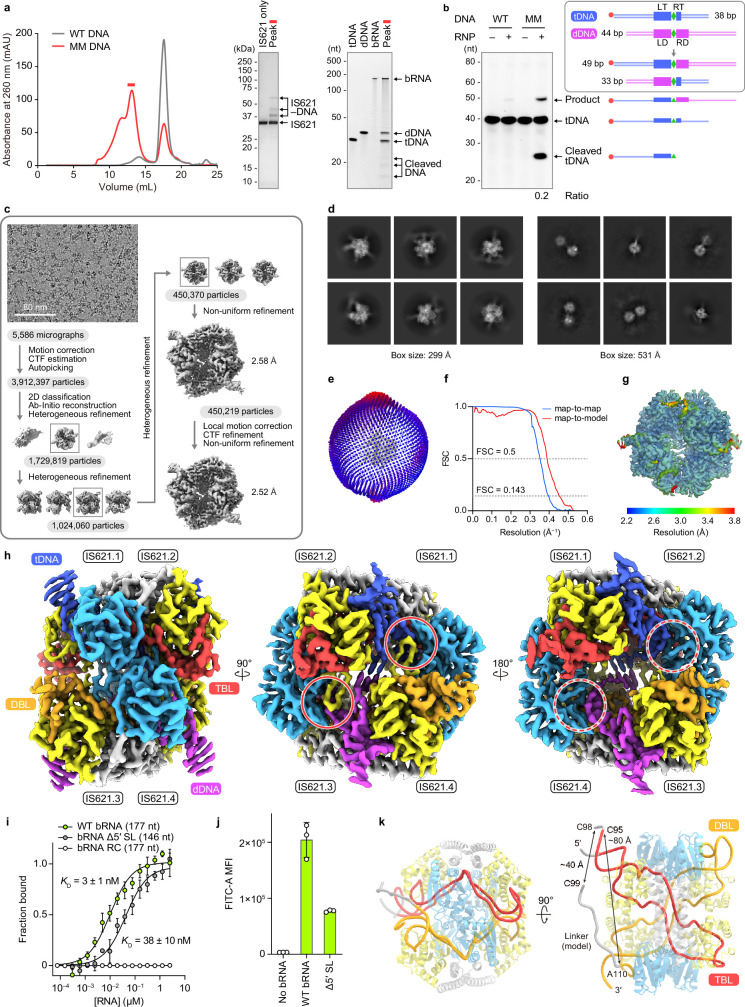
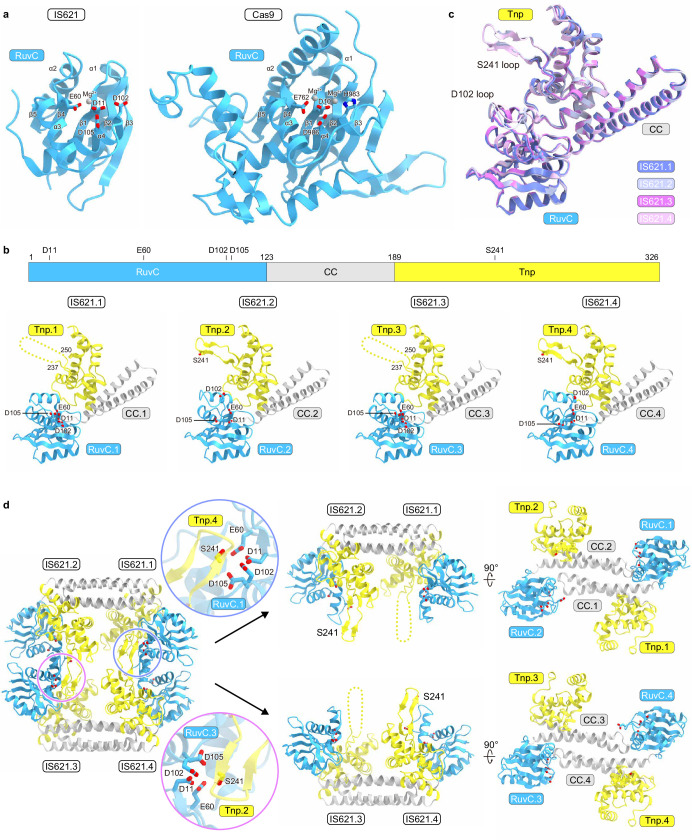
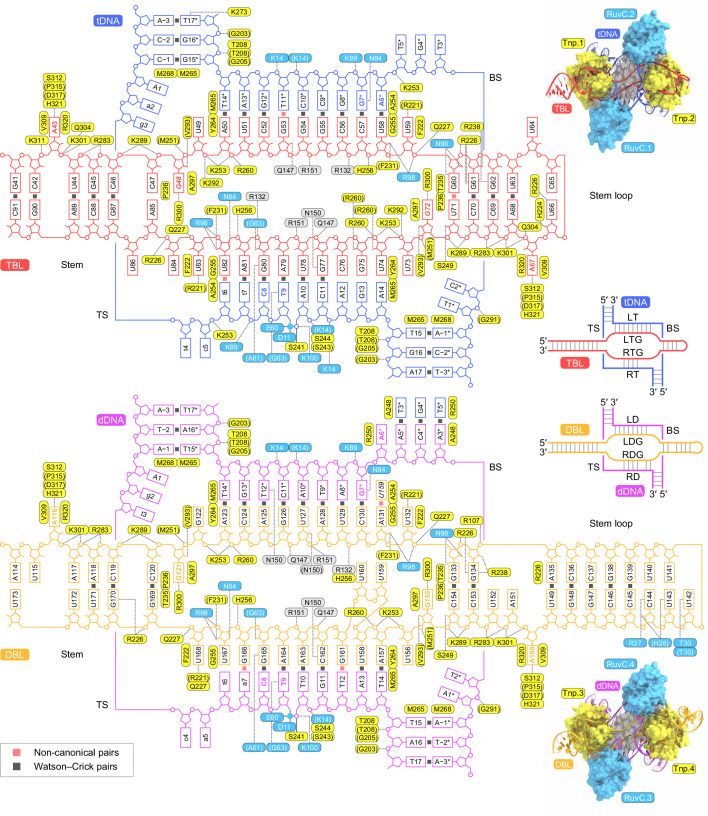
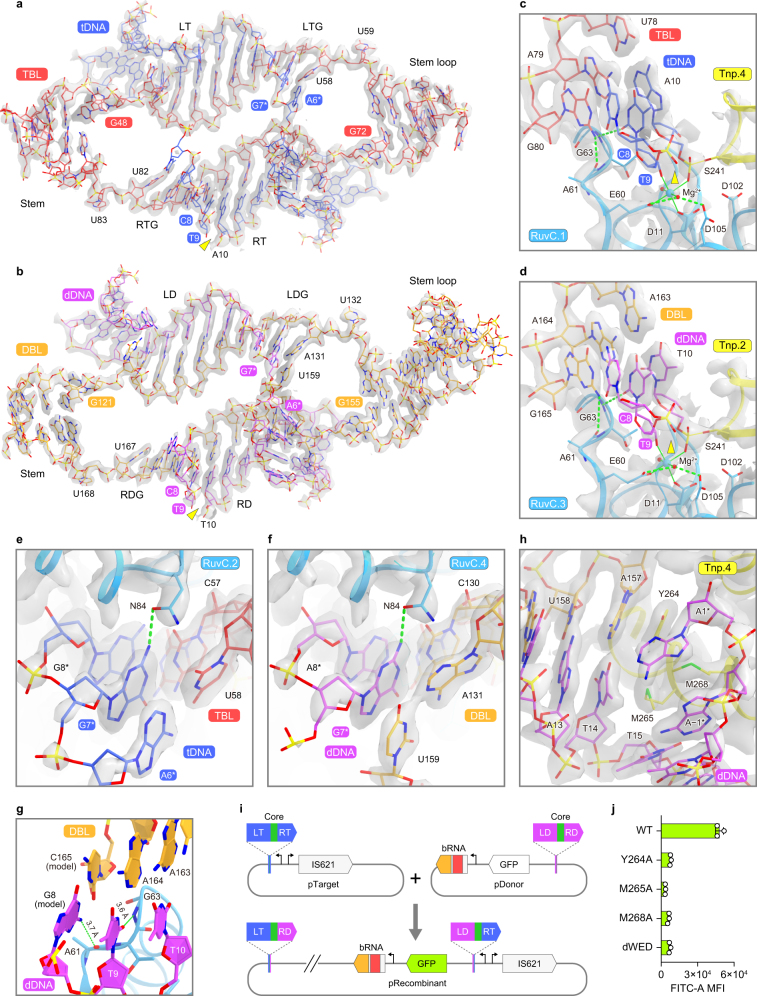
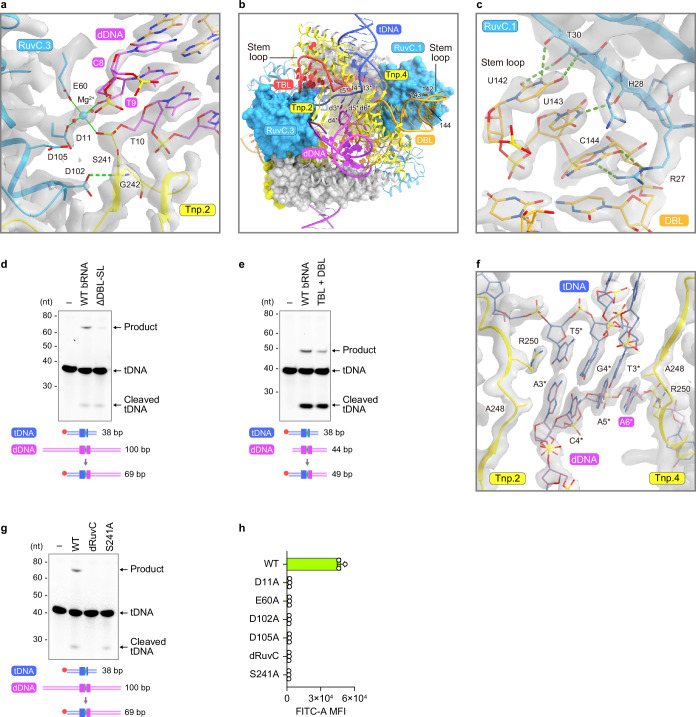
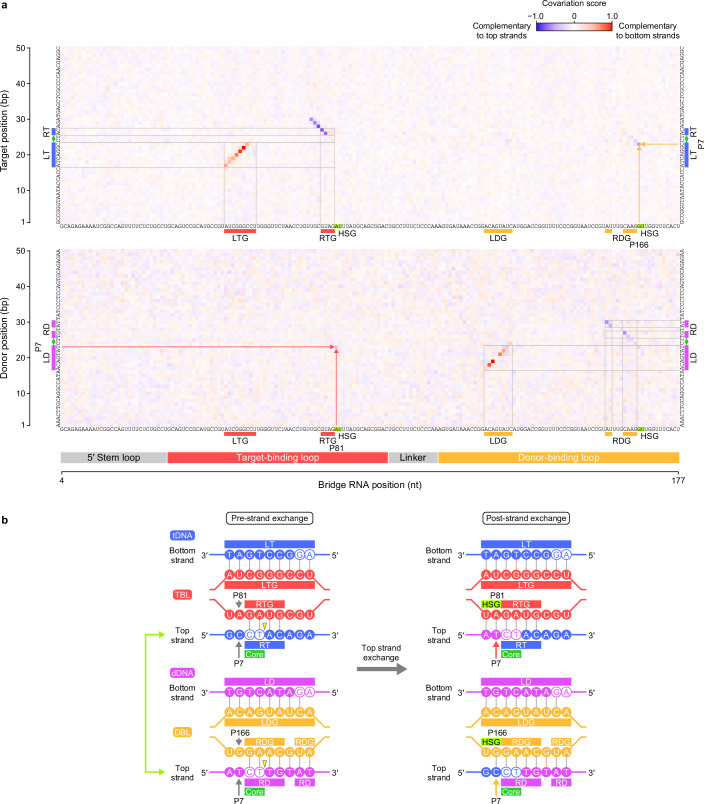
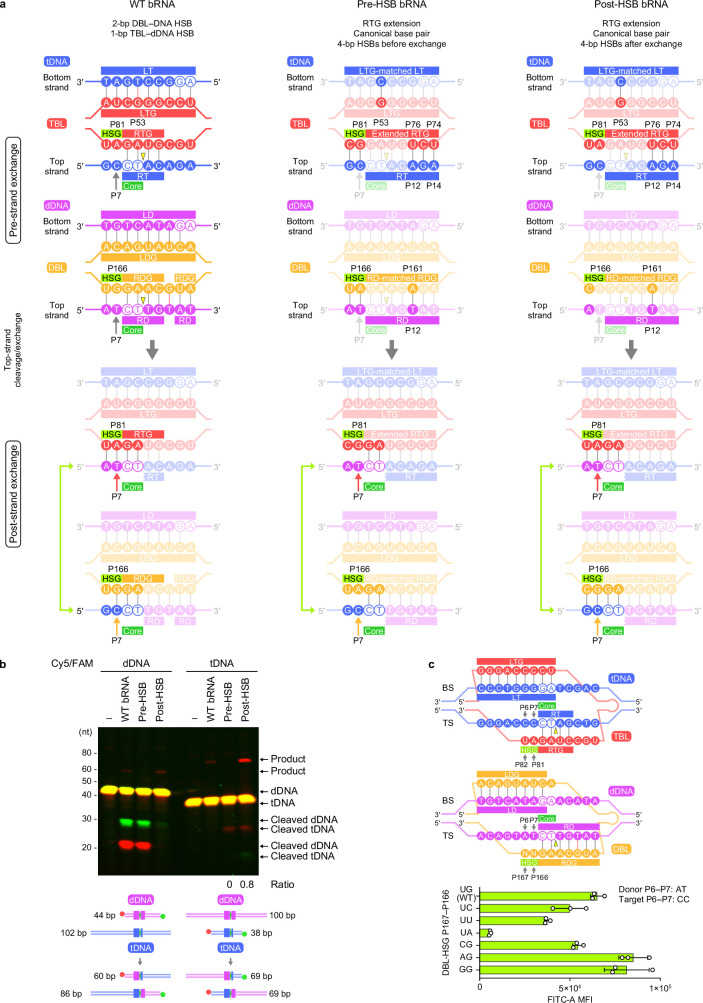
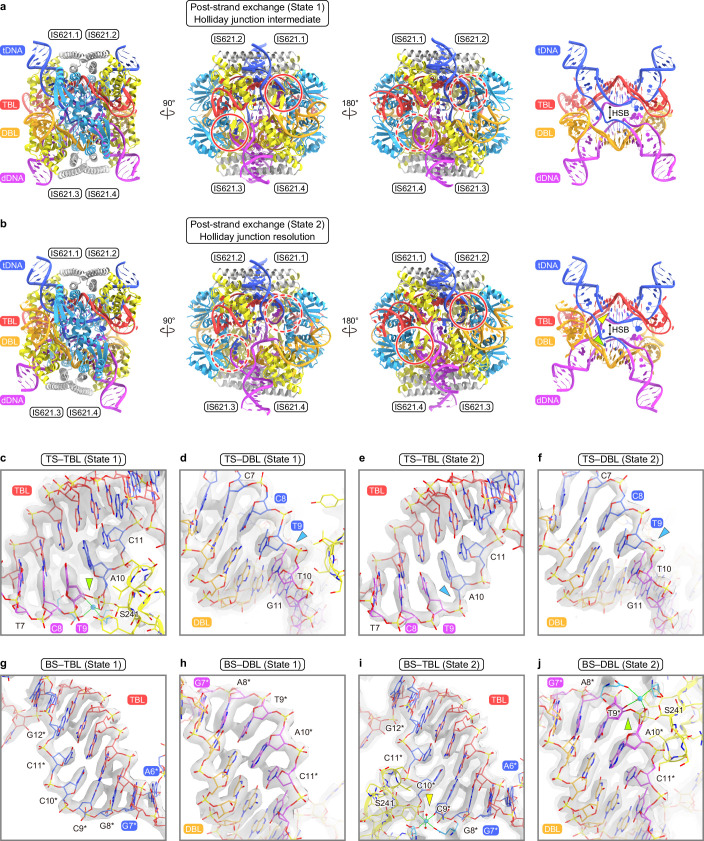
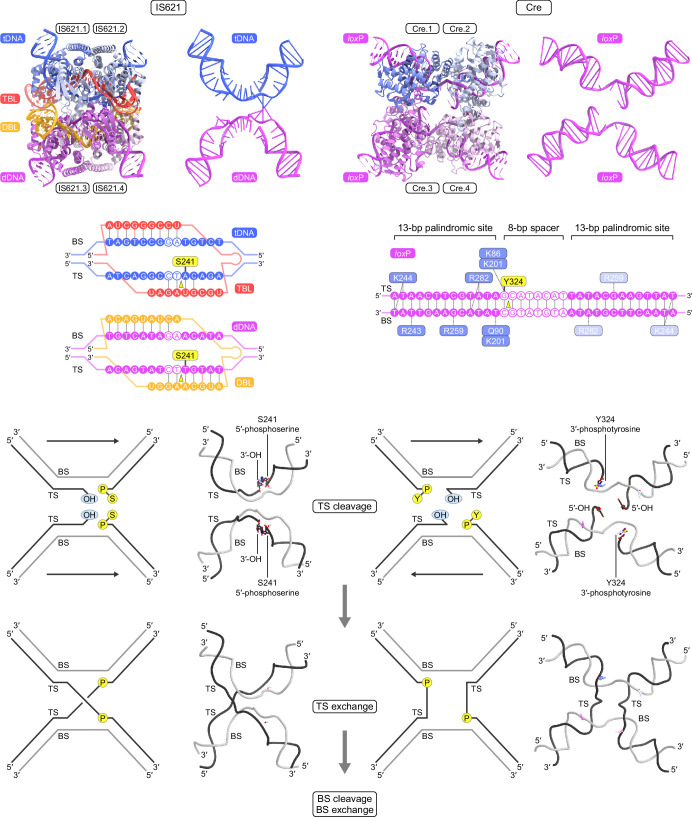
Insertion sequence (IS) elements are the simplest autonomous transposable elements found in prokaryotic genomes1. We recently discovered that IS110 family elements encode a recombinase and a non-coding bridge RNA (bRNA) that confers modular specificity for target DNA and donor DNA through two programmable loops2. Here we report the cryo-electron microscopy structures of the IS110 recombinase in complex with its bRNA, target DNA and donor DNA in three different stages of the recombination reaction cycle. The IS110 synaptic complex comprises two recombinase dimers, one of which houses the target-binding loop of the bRNA and binds to target DNA, whereas the other coordinates the bRNA donor-binding loop and donor DNA. We uncovered the formation of a composite RuvC-Tnp active site that spans the two dimers, positioning the catalytic serine residues adjacent to the recombination sites in both target and donor DNA. A comparison of the three structures revealed that (1) the top strands of target and donor DNA are cleaved at the composite active sites to form covalent 5'-phosphoserine intermediates, (2) the cleaved DNA strands are exchanged and religated to create a Holliday junction intermediate, and (3) this intermediate is subsequently resolved by cleavage of the bottom strands. Overall, this study reveals the mechanism by which a bispecific RNA confers target and donor DNA specificity to IS110 recombinases for programmable DNA recombination.


Conflict of interest statement

P.D.H. acknowledges outside interests in Stylus Medicine, Spotlight Therapeutics, Circle Labs, Arbor Biosciences, Varda Space, Vial Health, Serotiny and LabSimply, where he holds various roles as co-founder, director, scientific advisory board member or consultant. M.G.D. acknowledges outside interest in Stylus Medicine. M.H., N.T.P., M.G.D., J.S.A., S.K., P.D.H. and H.N. are listed as co-inventors on patent applications related to the structure-based engineering of IS110 systems, filed by Arc Institute, The University of Tokyo and the University of California. All other authors declare no competing interests.

Figures

Fig. 1
Fig. 1. IS621 synaptic complex structure.
a, Schematic of the IS621 insertion sequence element. LD, left donor; RD, right donor; LE, left end; RE, right end, LT, left target; RT, right target; SL, stem loop. b, Domain structure of the IS621 recombinase. CC, coiled-coil domain. c, Schematics of bRNA-guided dDNA and tDNA recognition. The 5′ stem loop and the linker region in the bRNA are omitted, as the TBL and DBL in a single synaptic complex are derived from two different bRNA molecules. BS, bottom strand; TS, top strand. d, Nucleotide sequences of the bRNA-complementary regions in the tDNA and dDNA. Mismatched (MM) nucleotides introduced to the top strands for the structural analysis are shown as lowercase letters. Bottom strands are indicated by asterisks. e,f, Structures of the IS621–bRNA–dDNA–tDNA synaptic complex (e) and the bRNA–dDNA–tDNA complex (f). Disordered regions are indicated by dotted lines, and the CT core dinucleotides (positions 8 and 9) are numbered. In f, the S241 residues are shown as stick models. g,h, Structures of the tetramer (g) and monomer (h) of the IS621 recombinase. The catalytic residues are shown as space-filling (g) and stick (h) models. In h, the core α-helices and β-strands in each domain are numbered. In d,f, DNA cleavage sites are indicated by yellow triangles. In e,g, the active sites with the ordered and disordered S241 residues are indicated by red solid and dashed circles, respectively.
Fig. 2
Fig. 2. bRNA architecture.
a, Schematics showing base pairing between the bRNA and tDNA (top) and bRNA and dDNA (bottom). The covalent 5′-phosphoserine–DNA linkages are indicated by grey lines. Non-canonical base pairing is indicated by red lines. Disordered nucleotides are indicated by dashed circles. The 5′ stem loop and the linker region are omitted. CL, catalytic loop; WED, hydrophobic wedge. b,c, Structures of TBL–tDNA (b) and DBL–dDNA (c). Disordered regions are indicated by dotted lines. The S241 residues are depicted as space-filling models. In ac, DNA cleavage sites are indicated by yellow triangles.
Fig. 3
Fig. 3. Synaptic complex formation.
a,b, Surface representations of the IS621 synaptic complex, coloured according to the protomers (a) and domains (b). In b, the catalytic residues are coloured in red. c,d, Active sites formed by RuvC.1 and Tnp.4 (c) and RuvC.3 and Tnp.2 (d). The TBL and DBL are shown as space-filling models. DNA cleavage sites are indicated by yellow triangles. Disordered regions are indicated by dotted lines. e, Locations of the active sites relative to the tDNA and dDNA. f,g, Close-up views of the active sites formed by RuvC.1 and Tnp.4 (f) and RuvC.3 and Tnp.2 (g). Cryo-EM density maps are shown as grey semi-transparent surfaces. The Mg2+ ions and water molecules are depicted as cyan and red spheres, respectively. Hydrogen and coordinate bonds are shown as green dashed and solid lines, respectively. DNA cleavage sites are indicated by yellow triangles. h, Superimposition of the RuvC domains in the four IS621 protomers. The Mg2+ ions are depicted as spheres.
Fig. 4
Fig. 4. Strand exchange mechanism.
ai, Schematics of TBL–tDNA and DBL–dDNA and the structures of tDNA and dDNA, and TBL–tDNA and DBL–dDNA, in the IS621 synaptic complexes in the pre-strand exchange state (the complex with the WT bRNA for comparison) (ac); the post-strand exchange, Holliday junction intermediate state (state 1) (df); and the post-strand exchange, Holliday junction resolution state (state 2) (gi). DNA cleavage sites are indicated by yellow triangles, whereas partial cleavage and religation are indicated by green triangles. In b,e,h, cryo-EM density maps are shown as grey semi-transparent surfaces. In b,c, disordered regions are indicated by dotted lines. In c,f,i, positions 6–9 in the dDNA and tDNA are numbered.
Fig. 5
Fig. 5. Bridge recombination mechanism.
a,b, Proposed mechanisms of the IS621 synaptic complex formation (a) and the IS621-mediated DNA recombination (b). Two IS621 recombinase molecules bind to the TBL and DBL from two different bRNA molecules to form the IS621–TBL and IS621–DBL dimeric complexes, respectively. IS621–TBL and IS621–DBL recognize tDNA and dDNA, respectively, and then IS621–TBL–tDNA and IS621–DBL–dDNA form the tetrameric synaptic complex. In the synaptic complex, the top strands of tDNA and dDNA are cleaved at the RuvC–Tnp active sites, with the catalytic S241 residues forming covalent 5′-phosphoserine intermediates. The top strands are then exchanged and religated to form a Holliday junction (HJ) intermediate, which is resolved by the cleavage of the bottom strands at the RuvC–Tnp active sites. It is possible that the bottom strands are exchanged, and mismatched nucleotides are excised and repaired in E. coli cells, thereby completing the recombination. DNA cleavage sites are indicated by yellow triangles. Canonical and non-canonical base pairs are indicated by grey and red lines, respectively.
Extended Data Fig. 1
Extended Data Fig. 1. IS621 insertion sequence element.
(a) Transposition cycle of the IS621 insertion sequence element. The IS621 elements consist of the left end (LE), the recombinase-coding sequence, and the right end (RE), flanked by the CT core dinucleotide sequences at both ends. The transposition cycle of the IS621 elements consists of excision (generation of a circular form) and insertion (recombination between the circular form and genomic target sites) steps. In the excision step, recombination would occur between the 5′ left target (LT)–core–right donor (RD) region and the 3′ left donor (LD)–core–right target (RT) region in the IS621 locus, resulting in the LT–core–RT region in the original genomic site and the LD–core–RD region at the RE–LE junction in the circular form. Importantly, the RE–LE junction contains the reconstituted σ70-like promoter sequence, since RE and LE contain a −35 box and a −10 box, respectively. Thus, the bRNA encoded in the LE is expressed downstream of the core sequence at the RE–LE junction in the circular intermediate. However, it remains unclear whether the excision is mediated by the IS621–bRNA complex and, if so, how the IS621–bRNA complex accomplishes both excision and insertion reactions. For our cryo-EM analysis, we used the 44-bp donor DNA (the RE–LE junction with the LD–core–RD sequence in the circular form) and the 38-bp target DNA (the genomic target site with the LT–core–RT sequence) from the natural IS621 element found in E. coli, with the indicated minor modifications to assist structural analysis. 5′ SL, 5′ stem loop; TBL, target-binding loop; DBL, donor-binding loop; LTG, left target guide; RTG, right target guide; LDG, left donor guide; RDG, right donor guide; TS, top strand; BS, bottom strand. (b) Schematics showing base-pairing between the bRNA and tDNA/dDNA. Mismatched (MM) nucleotides introduced to the top strands for the structural analysis are shown as lower-case letters.
Extended Data Fig. 2
Extended Data Fig. 2. Cryo-EM analysis of the IS621 synaptic complex.
(a) Preparation of the IS621–bRNA–dDNA–tDNA synaptic complex. The IS621 recombinase, bRNA, and dDNA/tDNA (containing no mismatch (WT) or 6-nt mismatches (MM) at positions 2–7 in dDNA and tDNA) were mixed, and then purified by a Superose 6 Increase 10/300 column. The peak fraction of the synaptic complex with the mismatched DNA (indicated by a red line) was analyzed by SDS-PAGE (10–20%) and TBE–urea PAGE (15%). The proteins and nucleic acids were visualized with CBB and SYBR Gold, respectively. We observed three slower-migrating bands that may correspond to covalent IS621–DNA intermediates during recombination (probably IS621–dDNA, IS621–tDNA, and IS621–dDNA–tDNA). Experiments were repeated at least three times with similar results. (b) In vitro DNA recombination experiments. The 38-bp tDNA and 44-bp dDNA substrates (containing no mismatch (WT) or 6-nt mismatches (MM) at positions 2–7 in their top strands) were incubated with the IS621–bRNA complex at 37 °C for 1 h, and then the reaction was analyzed using an 18% TBE–urea gel. The tDNA was labeled with Cy5 at the 5′ end of the top strand. The band intensities of the product and cleaved DNAs were quantified, and the recombination ratios (product DNA / product DNA + cleaved DNA) were calculated. Experiments were repeated at least three times with similar results. (c) Single-particle cryo-EM image processing workflow. (d) Representative 2D averaged class images. (e) Angular distribution of particles in the final reconstruction. (f) Fourier shell correlation (FSC) curves. The map-to-map FSC curve was calculated between the two independently refined half-maps after masking (blue line), and the overall resolution was determined by the gold standard FSC = 0.143 criterion. The map-to-model FSC curve was calculated between the refined atomic model and the full map (red line). (g, h) Cryo-EM density maps, colored according to the local resolution (g) and the protein domains (h). In (h), the active sites with the ordered and disordered S241 residues are indicated by red solid and dashed circles, respectively. (i) Effects of 5′ SL deletion on bRNA binding to the IS621 recombinase. Binding of the purified IS621 recombinase to the bRNA, its reverse complement (RC), or the bRNA lacking the 5′ SL (nucleotides A1–U33) (Δ5′ SL) was analyzed using microscale thermophoresis. Data are shown as mean ± SEM for three technical replicates. (j) Effects of 5′ SL deletion on IS621-mediated recombination in E. coli. Data are shown as mean ± SD for three biological replicates. (k) Distance between TBL and DBL. Nucleotides U96–A109 are disordered in the present structure. Modeling of nucleotides U96–A109 (colored grey) suggests that C98 and C99 are ~40-Å apart, indicating that the TBL and DBL in the synaptic complex structure are derived from two different bRNA molecules.
Extended Data Fig. 3
Extended Data Fig. 3. IS621 recombinase structure.
(a) Structural comparison of the RuvC domains of IS621 and Cas9 (PDB: 7S4X). The catalytic residues are shown as stick models. The core α-helices and β-strands are labeled. The RuvC active site of IS621 plays a role in coordinating a Mg2+ ion that stabilizes the 5′-phosphoserine DNA intermediates, thereby facilitating DNA cleavage and religation. In contrast, most RuvC domains, such as that of Cas9, bind two Mg2+ ions and catalyse the DNA cleavage reaction (i.e., the nucleophilic attack of an activated water molecule on the scissile phosphodiester bond in a substrate DNA). (b) Structures of the four IS621 protomers. The disordered S241 loops in IS621.1 and IS621.3 are indicated by dotted lines. (c) Superimposition of the RuvC domains in the four IS621 protomers. (d) Structure of the IS621 tetramer. The active sites formed by RuvC.1–Tnp.4 and RuvC.3–Tnp.2 are indicated by blue and magenta circles, respectively.
Extended Data Fig. 4
Extended Data Fig. 4. Schematic of interactions between IS621 and nucleic acids.
A43/A67/A116/A150 and G48/G72/G121/G155, common structural features in the TBL and DBL, and the core nucleotides (tC8/tT9/tA6*/tG7* and dC8/dT9/dA6*/dG7*) are highlighted in bold. G48/G72/G121/G155 and U159, which adopt the syn conformation, are shown in italics. The Mg2+ ions are depicted as cyan circles. Non-canonical base-pairs are indicated by red squares. The IS621 residues that interact with the nucleic acids through their main chains are shown in parentheses.
Extended Data Fig. 5
Extended Data Fig. 5. DNA recognition mechanism.
(a, b) Structures of TBL–tDNA (a) and DBL–dDNA (b). (c, d) Recognition of the CT core sequences in tDNA (c) and dDNA (d). (e, f) Recognition of the CT core-complementary sequences in tDNA (e) and dDNA (f). (g) Modeling of dG8 into the dDNA as part of the core dinucleotide. (h) Interaction between the DNA and the hydrophobic wedge. Similar interactions are observed in the four protomers. In (af) and (h), cryo-EM density maps are shown as grey semi-transparent surfaces. (i) Schematic of the bacterial recombination assays. Successful recombination between pTarget and pDonor places the gene encoding green fluorescent protein (GFP) downstream of the synthetic promoter, resulting in fluorescence. IS621, the IS621 recombinase. (j) DNA recombination activities of the WT IS621 and the hydrophobic-wedge mutants in the bacterial recombination assays. Data are shown as mean ± SD for three biological replicates. dWED, Y264A/M265A/M268A.
Extended Data Fig. 6
Extended Data Fig. 6. Synaptic complex formation.
(a) Interactions between RuvC.3 and Tnp.2. Similar interactions are observed between RuvC.1 and Tnp.4. (b) Interface between the IS621–TBL–tDNA and IS621–DBL–dDNA dimeric complexes. Nucleotides tT3*–tT5* in the target DNA and nucleotides dA3*–dA6* in the donor DNA are labeled as t3*–t5* and d3*–d6*, respectively. (c) Interactions between RuvC.1 and DBL-SL. (d) In vitro DNA recombination activities of IS621 in complex with the WT bRNA or the ΔDBL-SL bRNA mutant, in which nucleotides C137–G147 were replaced with GAAA. The tDNA (38 bp) substrate was labeled with Cy5 at the 5′ end of the top strand. The Cy5-tDNA (38 bp) and non-labeled dDNA (100 bp) were incubated with the IS621–bRNA complex at 37 °C for 1 h, and then the reaction was analyzed using an 18% TBE–urea gel. Recombination between the Cy5-tDNA and dDNA yields a 69-bp Cy5-labeled product. Experiments were repeated at least three times with similar results. (e) In vitro DNA recombination activities of IS621 in complex with the WT bRNA or separated TBL (nucleotides 31–104) and DBL (nucleotides 99–177). The tDNA (38 bp) substrate was labeled with Cy5 at the 5′ end of the top strand. The Cy5-tDNA (38 bp) and non-labeled dDNA (44 bp) (containing 6-nt mismatches in their top strands) were incubated with the IS621–bRNA complex at 37 °C for 1 h, and then the reaction was analyzed using an 18% TBE–urea gel. Recombination between the Cy5-tDNA and dDNA yields a 49-bp Cy5-labeled product. Experiments were repeated at least three times with similar results. (f) Base-pairing between tDNA and dDNA. In (a), (c), and (f), cryo-EM density maps are shown as grey semi-transparent surfaces. (g) DNA recombination activities of the WT IS621 and the active-site mutants in the in vitro recombination assays. The tDNA (38 bp) substrate was labeled with Cy5 at the 5′ end of the top strand. The Cy5-tDNA (38 bp) and non-labeled dDNA (100 bp) were incubated with the IS621–bRNA complex at 37 °C for 1 h, and then the reaction was analyzed using an 18% TBE–urea gel. Recombination between the Cy5-tDNA and dDNA yields a 69-bp Cy5-labeled product. Experiments were repeated at least three times with similar results. dRuvC, D11A/E60A/D102A/D105A. (h) DNA recombination activities of the WT IS621 and the active-site mutants in the bacterial recombination assays. Data are shown as mean ± SD for three biological replicates.
Extended Data Fig. 7
Extended Data Fig. 7. Covariation analysis.
(a) Nucleotide covariation and base-pairing potential between bRNAs and their target (top) and donor (bottom) sequences, calculated from 5,511 bRNA–target pairs and 2,201 bRNA–donor pairs, as described previously. The IS621 bRNA sequence is shown across the x-axis. Covariation scores calculated from thousands of IS110 orthologues are colored according to strand complementarity, with −1 (blue) representing high covariation and a bias toward top strand base-pairing, 1 (red) representing high covariation and a bias toward bottom strand base-pairing, and 0 indicating no detectable covariation. Regions with substantial covariation signals indicating base-pairing for IS621 are boxed. These data indicated base-pairing potential between TBL-HSG P81 and dDNA P7 (red arrow) and DBL-HSG P166 and tDNA P7 (orange arrow) in IS621, suggesting the functional importance of the base-pairing at these positions across the IS110 orthologues. HSG, handshake guide. (b) Schematic of the predicted TBL–tDNA and DBL–dDNA base-pairing patterns before and after the strand exchange.
Extended Data Fig. 8
Extended Data Fig. 8. Effects of handshake base-pairing.
(a) Schematics of the TBL/DBL and tDNA/dDNA sequences used for cryo-EM analysis and in vitro recombination assays. The pre- and post-HSB (handshake base-pairing) bRNAs stabilize the synaptic complex in the pre- and post-strand exchange states, respectively. Mutated nucleotides in the pre- and post-HSB bRNAs and their complementary DNA nucleotides are highlighted. (b) Effects of handshake base-pairing on in vitro DNA activity of IS621. Three bRNAs with different HSGs, A81/U82/G166/U167 (WT), G81/C82/A166/U167 (pre-HSB) or A81/U82/G166/C167 (post-HSB), were used for the in vitro DNA recombination experiments. The tDNA (38 bp) and dDNA (44 bp) substrates were labeled with Cy5 and FAM at the 5′ ends of the top and bottom strands, respectively. The Cy5/FAM-tDNA (38 bp) and Cy5/FAM-dDNA (44 bp) were mixed with the non-labeled dDNA (100 bp) and tDNA (102 bp), respectively. The DNA substrates were incubated with the IS621–bRNA complex at 37 °C for 1 h, and the reaction was then analyzed using an 18% TBE–urea gel. Recombination between the Cy5/FAM-dDNA and tDNA and between the Cy5/FAM-tDNA and dDNA yields 60- and 69-bp Cy5-labeled products, respectively. For the results with the labeled tDNA and pre- and post-HSB bRNAs, the band intensities of the product and cleaved DNAs were quantified, and the recombination ratios (product DNA / product DNA + cleaved DNA) were calculated. Experiments were repeated at least three times with similar results. (c) Effects of handshake base-pairing between the DBL-HSG and dDNA on IS621-mediated DNA recombination in E. coli. Data are shown as mean ± SD for three biological replicates.
Extended Data Fig. 9
Extended Data Fig. 9. Structures of the IS621 synaptic complexes in the post-strand exchange states.
(a, b) Structures of the IS621 synaptic complexes in the post-strand exchange states (state 1) (a) and (state 2) (b). The active sites with the ordered and disordered S241 residues are indicated by red solid and dashed circles, respectively. (cj) Close-up views of TS–TBL (state 1) (c), TS–DBL (state 1) (d), TS–TBL (state 2) (e), TS–DBL (state 2) (f), BS–TBL (state 1) (g), BS–DBL (state 1) (h), BS–TBL (state 2) (i), and BS–DBL (state 2) (j). Cryo-EM density maps are shown as grey semi-transparent surfaces. The Mg2+ ions are depicted as cyan spheres. In (c), (d), (i), and (j), the density maps are contoured at two different levels. The top strand is partially religated at the RuvC.1–Tnp.4 active site in state 1 (green arrow) (c), whereas the top strand is fully religated at the RuvC.1–Tnp.4 active site in state 2 (cyan arrow) (e). The top strands are fully religated at the RuvC.3–Tnp.2 active site in states 1 and 2 (cyan arrows) (d, f). The bottom strands of tDNA and dDNA are not cleaved in state 1 (g, h). The bottom strand of tDNA is fully cleaved at the RuvC.2–Tnp.3 active site in state 2 (yellow arrow) (i), whereas that of dDNA is partially cleaved at the RuvC.4–Tnp.1 active site in state 2 (green arrow) (j). TS, top strand; BS, bottom strand.
Extended Data Fig. 10
Extended Data Fig. 10. Comparison of IS621 and Cre.
Comparison of the synaptic complex structures, DNA recognition mechanisms, and DNA recombination mechanisms between IS621 and Cre (PDB: 1CRX and 3CRX). In the recombination reactions catalysed by IS621 and Cre, the top strands in two DNA molecules are cleaved, forming covalent protein–DNA intermediates. DNA cleavage sites are indicated by yellow triangles. Note that the relative angles between the two DNA molecules differ by ~180° between the synaptic complexes of IS621 and Cre, resulting in the opposite orientations of their HJ intermediates (parallel for IS621 and antiparallel for Cre). The orientations of the two DNA molecules are indicated by arrows. TS, top strand; BS, bottom strand.

References

    1. Siguier, P., Gourbeyre, E., Varani, A., Ton-Hoang, B. & Chandler, M. Everyman’s guide to bacterial insertion sequences. Microbiol. Spectr.3, MDNA3-0030-2014 (2015). - PubMed
    1. Durrant, M. G. et al. Bridge RNAs direct modular and programmable recombination of target and donor DNA. Nature (in the press). - PMC - PubMed
    1. Curcio, M. J. & Derbyshire, K. M. The outs and ins of transposition: from Mu to Kangaroo. Nat. Rev. Mol. Cell Biol.4, 865–877 (2003). - PubMed
    1. Hickman, A. B. & Dyda, F. Mechanisms of DNA transposition. Microbiol. Spectr.3, MDNA3-0034-2014 (2015). - PMC - PubMed
    1. Perkins-Balding, D., Duval-Valentin, G. & Glasgow, A. C. Excision of IS492 requires flanking target sequences and results in circle formation in Pseudoalteromonas atlantica. J. Bacteriol.181, 4937–4948 (1999). - PMC - PubMed