. 2024 Jul;16(7):1533-1559.
doi: 10.1038/s44321-024-00090-6. Epub 2024 Jun 26.

FADS1/2 control lipid metabolism and ferroptosis susceptibility in triple-negative breast cancer

Affiliations

FADS1/2 control lipid metabolism and ferroptosis susceptibility in triple-negative breast cancer

Nicla Lorito et al. EMBO Mol Med. 2024 Jul.

Abstract

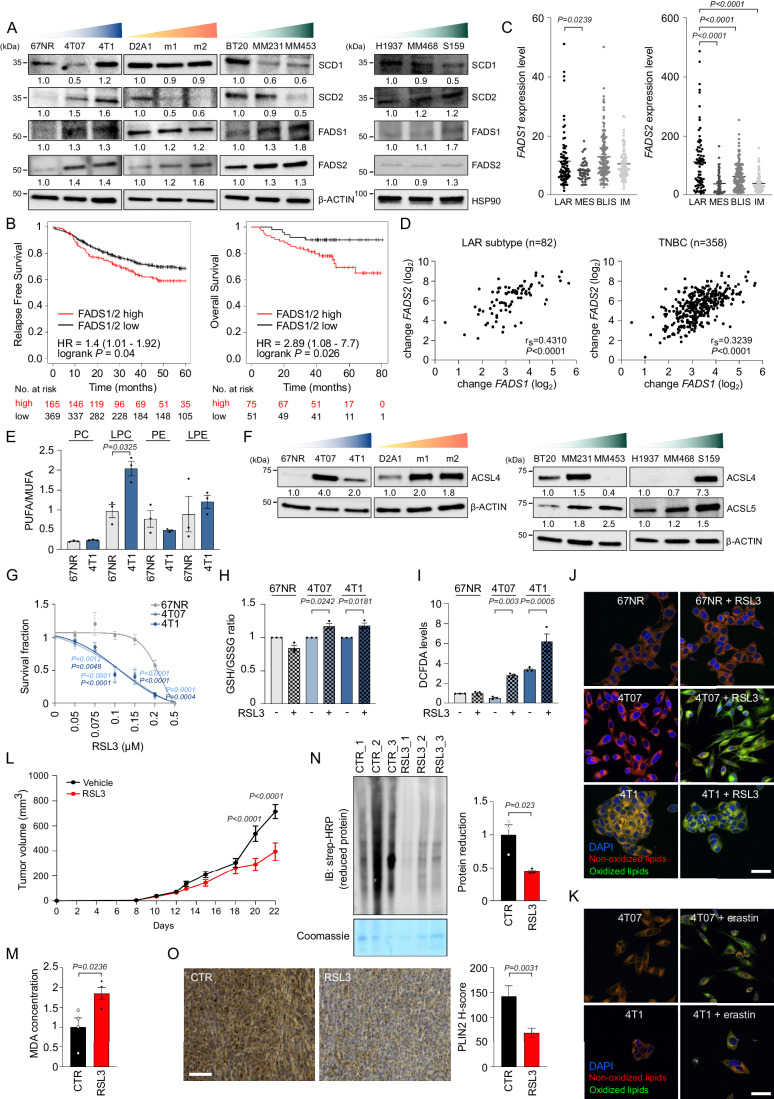
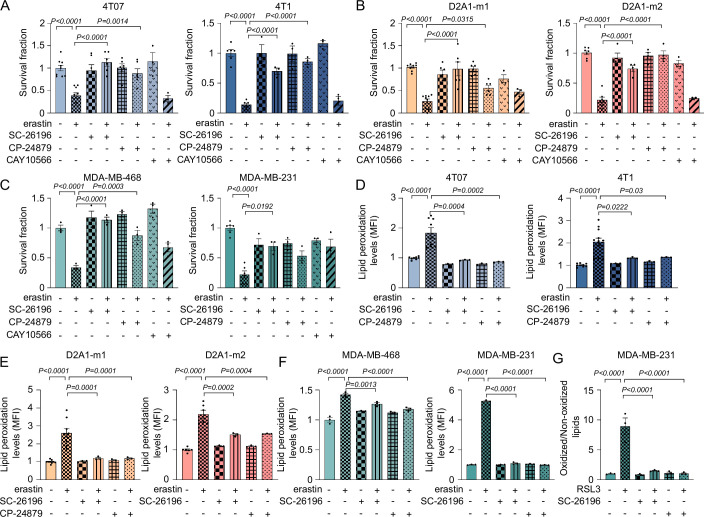
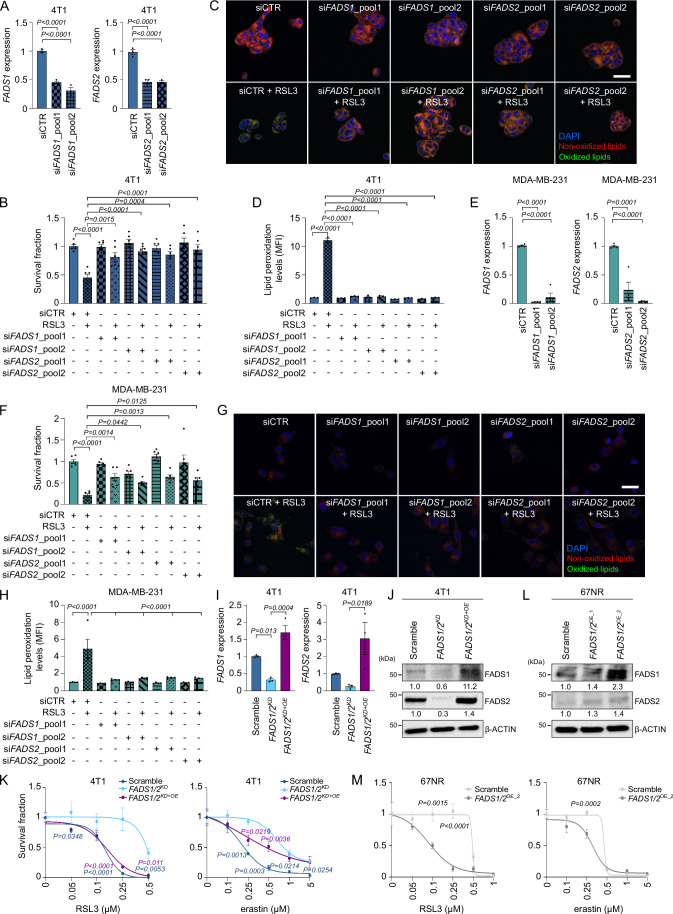
Triple-negative breast cancer (TNBC) has limited therapeutic options, is highly metastatic and characterized by early recurrence. Lipid metabolism is generally deregulated in TNBC and might reveal vulnerabilities to be targeted or used as biomarkers with clinical value. Ferroptosis is a type of cell death caused by iron-dependent lipid peroxidation which is facilitated by the presence of polyunsaturated fatty acids (PUFA). Here we identify fatty acid desaturases 1 and 2 (FADS1/2), which are responsible for PUFA biosynthesis, to be highly expressed in a subset of TNBC with a poorer prognosis. Lipidomic analysis, coupled with functional metabolic assays, showed that FADS1/2 high-expressing TNBC are susceptible to ferroptosis-inducing agents and that targeting FADS1/2 by both genetic interference and pharmacological approach renders those tumors ferroptosis-resistant while unbalancing PUFA/MUFA ratio by the supplementation of exogenous PUFA sensitizes resistant tumors to ferroptosis induction. Last, inhibiting lipid droplet (LD) formation and turnover suppresses the buffering capacity of LD and potentiates iron-dependent cell death. These findings have been validated in vitro and in vivo in mouse- and human-derived clinically relevant models and in a retrospective cohort of TNBC patients.

Keywords: Desaturases; Ferroptosis; Lipid Droplets; Lipid Metabolism; Polyunsaturated Fatty Acids.


Conflict of interest statement

IM declares consultant honoraria for Eli Lilly, Novartis, Seagen, Istituto Gentili, Roche, Pfizer, Ipsen, and Pierre Fabre. All the other authors declare no competing interests.

Figures

Figure 1
Figure 1. Altered lipid metabolism is a feature of aggressive TNBC cells.
(A) Schematic representation of the metastatic potential of 4T1, D2A1, and human TNBC cellular models. 67NR, 4T07, and 4T1 cells (referred to as the 4T1 series) originated from a spontaneous mammary adenocarcinoma growing in a BALB/cfC3H mouse but have undergone different selection processes and exhibited distinctive aggressiveness and metastatic potential. Highly metastatic D2A1-m1 and D2A1-m2 cells have been selected from the weakly metastasizing murine-derived D2A1 cells by serial in vivo passaging. Human TNBC cell lines with different metastatic potentials have been employed. These cellular models are here represented subdivided into three main clusters: weakly, intermediate, and highly metastatic. (B) Gene Set Enrichment Analysis (GSEA) results of the top gene sets showed a positive association with the 4T1 versus 67NR gene expression profile (GSE236033). FDR, false discovery rate. (C) Total protein lysates from weakly to highly metastatic murine and human breast cancer cells were subjected to WB analysis with the antibodies indicated. (D) Murine and human TNBC cells were subjected to confocal analysis. Representative pictures of BODIPY493/503 stained cells are shown (orange/yellow: LD; blue: DAPI, nuclei; scale bar, 10 μm). (E) Murine and human breast cancer cells were analyzed by WB analysis using the antibodies described in the figure. The loading controls of the human cell lines (β-ACTIN) in Figs. 1C, E and 2A and (HSP90) in Figs. 1C and 2A are the same and derived from the same experiment (i.e., cell lysates) and blots were processed in parallel. (F) 67NR and 4T1 cells were treated with a series of drugs targeting lipogenic enzymes and subjected to cell viability assays. The heatmap showed that no drug exerts a differential effect between the two cell lines (n = 3 biological replicates in either single, duplicate, or technical triplicate). Data information: In F data are represented as mean ± SEM, two-way ANOVA, Bonferroni corrected. Source data are available online for this figure.
Figure 2
Figure 2. FADS1 and FADS2 identify aggressive TNBC sensitive to ferroptosis induction.
(A) Murine and human breast cancer cells, ordered from left to right according to their metastatic potential, were analyzed by WB analysis using the antibodies described in the figure. The loading controls of the human cell lines (β-ACTIN and HSP90) in Figs. 1C, E and 2A are the same and derived from the same experiment (i.e., cell lysates) and blots were processed in parallel. (B) Kaplan–Meier analysis of RFS and OS of a curated cohort of TNBC patients divided into high and low FADS1/FADS2 expressing using the best cutoff as described in the Materials and Methods section. HR and log-rank Mantel-Cox P values are shown. (C) FADS1 and FADS2 expression levels were analyzed in the different TNBC subtypes from the FUSCCTNBC cohort (n = 82 LAR, n = 51 MES, n = 138 BLIS, n = 87 IM). The LAR subtype was used as comparator in the statistical analysis. (D) Correlation analysis between the expression levels of FADS1 and FADS2 both in the LAR subtype (left) and in the whole cohort of TNBC of the FUSCCTNBC cohort (right). Rs and log-rank Mantel-Cox P values are shown. (E) The ratio of PUFA/MUFA in 4T1 and 67NR cells for PC, LPC, PE, and LPE lipid classes was calculated as described in the Methods section (n = 3 biological replicates, see Dataset EV1). 67NR cells were used as comparator in the statistical analysis. (F) TNBC cells were analyzed by WB analysis using the antibodies described in the figure. (G) 24-h dose-response curve of RSL3 showed a differential effect between 67NR, 4T07, and 4T1 cells (n = 3 biological replicates). 67NR were used as comparator in the statistical analysis. (H) The GSH/GSSG concentration ratio was measured in 4T1 series’ cells treated with 0.1 μM RSL3 for 24 h (n = 3 biological replicates). The untreated condition was used as comparator for each cell line in the statistical analysis. (I) Intracellular ROS levels were measured by DCFDA in 4T1 series’ cells treated with 0.1 μM RSL3 for 24 h (n = 3 biological replicates). The untreated condition was used as comparator for each cell line in the statistical analysis. (J, K) Lipid peroxidation levels were evaluated by measuring the fluorescence intensity of BODIPY581/591-C11 using confocal microscopy in murine 4T1 series’ cells exposed to 1 μM RSL3 (J) or 5 μM erastin (K) for 2 h. Representative confocal images are shown. (Oxidized lipids: green; non-oxidized lipids: red; nuclei: blue, DAPI; scale bar, 10 μm). (L) In vivo response to RSL3 treatment in BALB/c mice (n = 4–6 mice/group). (M) Lipid peroxidation was evaluated by measuring the MDA intracellular accumulation in vehicle- and RSL3-treated tumors (n = 4 mice/group). (N) Total protein lysates from vehicle- and RSL3-treated tumors were analyzed by WB analysis using the antibody described in the figure. Relative quantification is shown using vehicle-treated tumors as comparator (n = 3 mice/group). (O) Representative 20× images of PLIN2 immunohistochemistry (IHC) staining and relative quantification (PLIN2 H-score) of four different areas derived from vehicle- and RSL3-treated 4T1 tumor specimens (scale bar, 200 μm). Relative quantification is shown using vehicle-treated tumors as comparator (n = 5 mice/group). Data information: In (C, E, GI, LO), data are presented as mean ± SEM. Statistical analysis was performed using one-way ANOVA followed by Dunnett’s correction (C) or Tukey’s correction (E, I), two-way ANOVA followed by Tukey’s correction (H) or Bonferroni’s correction (G, L), Two-tailed unpaired-sample Student t-test (MO). Source data are available online for this figure.
Figure 3
Figure 3. Ferrostatin-1, Deferoxamine, and ACSL4 inhibition prevent RSL3-induced cell death in TNBC cells.
(A) Schematic representation of ferroptosis execution. Glu: glutamate, Cys2: cystine. (BD) 4T07, 4T1, D2A1-m1, and D2A1-m2 cells were pre-treated with 15 μM Fer-1 (B, D), 5 μM DFOM (B, D), or 10 μM ACSL4 inhibitor (ACSL4i, C, D) for 4 h, and then exposed overnight (ON, 16 h) to 0.1 μM (4T07 and 4T1) or 0.25 μM (D2A1-m1 and D2A1-m2) RSL3. After 24 h cells were subjected to cell viability assay (n = 3 biological replicates in either single or technical duplicate). The RSL3-treated cells were used as comparator in the statistical analysis. (E) Human metastatic MDA-MB-468, MDA-MB-231, SUM159, and MDA-MB-453 cells were pre-treated with 15 μM Fer-1, 5 μM DFOM, or 10 μM ACSL4i for 4 h, and then administrated ON with 0.25 μM RSL3. After 24 h cells were subjected to cell viability assay (n = 3 biological replicates in either single, duplicate or technical triplicate). The RSL3-treated cells were used as comparator in the statistical analysis. Data information: data are presented as mean ± SEM. Statistical analysis was performed using one-way ANOVA followed by Dunnett’s correction (B, D, E) or Tukey’s correction (C). Source data are available online for this figure.
Figure 4
Figure 4. Targeting FADS1/2 prevents ferroptosis induction in aggressive TNBC.
(AC) TNBC metastatic murine 4T07 and 4T1 (A), D2A1-m1 and D2A1-m2 (B), and human MDA-MB-468, MDA-MB-231, SUM159, and MDA-MB-453 (C) cells were pre-treated with 10 μM FADS2 inhibitor (FADS2i, SC-26196), FADS1/2 inhibitor (FADS1/2i, CP-24879), and SCD1 inhibitor (SCD1i, CAY10566) for 4 h, exposed ON to 0.1 μM (4T1 series) or 0.25 μM (D2A1 series and human TNBC cells) RSL3, and subjected to cell viability assay (n = 3 biological replicates in either single or technical duplicate). The RSL3-treated cells were used as comparator in the statistical analysis. (D, E) 4T07 and 4T1 cells were pre-treated with 10 μM FADS2i or FADS1/2i for 4 h, exposed to 1 μM RSL3 for 2 h, and subjected to confocal analysis (D) and cytofluorimetric analysis (E) to measure lipid peroxidation. Representative pictures of BODIPY581/591-C11 stained cells are shown (oxidized lipids: green; non-oxidized lipids: red; nuclei: blue, DAPI; scale bar, 10 μm) (n = 3 biological replicates). The RSL3-treated cells were used as comparator in the statistical analysis. (F, G) Metastatic D2A1 (F) and human (G) TNBC cells were pre-treated with 10 μM FADS2i or FADS1/2i for 4 h, treated for 2 h with 1 μM RSL3, and subjected to cytofluorimetric analysis to measure lipid peroxidation (n = 3 biological replicates in either single, duplicate or technical triplicate). The RSL3-treated cells were used as comparator in the statistical analysis. (H) Highly metastatic MDA-MB-231 cells were pre-treated with 10 μM FADS2i or FADS1/2i for 4 h, treated for 2 h with 1 μM RSL3, and subjected to confocal analysis to measure lipid peroxidation. Representative pictures of BODIPY581/591-C11 stained cells are shown (oxidized lipids: green; non-oxidized lipids: red; nuclei: blue, DAPI; scale bar, 10 μm). Data information: In (AC, EG), data are presented as mean ± SEM. Statistical analysis was performed using one-way ANOVA followed by Dunnett’s correction. Source data are available online for this figure.
Figure 5
Figure 5. Both FADS1/2 knockdown and RSL3 administration alter the lipidomic profile of TNBC cells sensitive to ferroptosis induction.
(A) Unsupervised hierarchical clustering and heatmap of the significantly and differentially expressed lipid entities in FADS1/2KD 4T1 cells compared to Scramble 4T1 cells (left). The data were represented as volcano plot (right), highlighting the upregulated (red) and downregulated (blue) lipid species (fold change threshold of 1.5 and FDR < 0.05). (B) PLS-DA of the lipidomic profile of FADS1/2KD and Scramble 4T1 cells. (C) Unsaturation levels in FADS1/2KD and Scramble 4T1 cells (n = 3, in technical duplicates). (D) Ratio of PUFA/MUFA in FADS1/2KD and Scramble 4T1 cells (n = 3, in technical duplicates). (E) PLS-DA of the lipidomic profile of 67NR and 4T1 cells with and without 1 μM RSL3 for 2 h. (F) Unsupervised hierarchical clustering and heatmap of the significantly and differentially expressed lipid entities in 4T1 cells exposed to 1 μM RSL3 for 2 h (top). The data were represented as volcano plot (bottom), highlighting the upregulated (red) and downregulated (blue) lipid species (fold change threshold of 1.5 and p-value < 0.05). (G) Unsupervised hierarchical clustering and heatmap of the significantly and differentially expressed lipid entities in 67NR cells exposed to 1 μM RSL3 for 2 h (top). The data were represented as volcano plot (bottom), highlighting the upregulated (red) and downregulated (blue) lipid species (fold change threshold of 1.5 and p-value < 0.05). Data information: In (C, D), data are presented as mean ± SEM. Statistical analysis was performed using two-tailed unpaired-sample Student t-test (A, F, G) with FDR-adjusted analysis in (A), two-way ANOVA followed by Šidák’s correction (C), or two-tailed unpaired-sample Student t-test (D). Source data are available online for this figure.
Figure 6
Figure 6. Exogenous FA supplementation alters ferroptosis susceptibility in TNBC cells.
(A) The non-metastatic 67NR cells were pre-treated with 10 μM C22:4, 10 μM C22:1, or 5 μM C16:1 for 4 h and then exposed ON to 0.1 μM RSL3. After 24 h cells were subjected to cell viability assay (n = 3 biological replicates in either single or technical duplicate). The RSL3-treated condition was used as comparator in the statistical analysis. (B) 67NR cells were pre-treated with 10 μM C22:4 for 4 h, then exposed for 2 h to 1 μM RSL3 and subjected to confocal analysis to measure lipid peroxidation. Representative pictures of BODIPY581/591-C11 stained cells are shown (oxidized lipids: green; non-oxidized lipids: red; nuclei: blue, DAPI; scale bar, 10 μm). Quantification of BODIPY581/591-C11 spots was reported (n = 3 biological replicates in either single or technical duplicate). The RSL3-treated condition was used as comparator in the statistical analysis. (C, D) TNBC aggressive 4T07 (C) and 4T1 (C, D) cells were pre-treated with 10 μM C22:4 or C22:1 for 4 h, exposed ON to 0.1 μM RSL3 (C) or 0.5 μM erastin (D) and subjected to cell viability assay (n = 3 biological replicates in either single or technical duplicate). The RSL3- or erastin-treated condition was used as comparator in the statistical analysis. (E, F) Human TNBC metastatic MDA-MB-231 cells were pre-treated with 10 μM C22:4 or C22:1 for 4 h, treated ON with 0.25 μM RSL3 (E) or 0.5 μM erastin (F), and subjected to cell viability assay (n = 3 biological replicates). The RSL3- or erastin-treated condition was used as comparator in the statistical analysis. Data information: data are presented as mean ± SEM. Statistical analysis was performed using one-way ANOVA followed by Dunnett’s correction. Source data are available online for this figure.
Figure 7
Figure 7. Targeting LD biogenesis potentiates the RSL3-mediated cell death in TNBC cells.
(A) 4T1 cells treated for 24 h with 10 μM FADS2i or 10 μM FADS1/2i were subjected to BODIPY493/503 staining by confocal microscopy. Representative images are shown (orange/yellow: LD; blue: DAPI, nuclei; scale bar, 10 μm). (B, C) TNBC murine 4T1 series’ cells and human MDA-MB-231 cells treated with 1 μM RSL3 for 30 min were subjected to confocal (B) or cytofluorimetric (C) analyses. Representative pictures of BODIPY493/503 stained cells are shown (orange/yellow: LD; blue: DAPI, nuclei; scale bar, 10 μm) (n = 3 biological replicates in either single, duplicate, or technical triplicate). (D) 4T07, 4T1, and MDA-MB-231 metastatic cells were pre-treated with 10 μM DGAT1i or DGAT2i for 4 h and then exposed ON to 0.1 μM (4T07 and 4T1) or 0.25 μM (MDA-MB-231) RSL3. After 24 h cells were subjected to cell viability assay (n = 3 biological replicates in either single or technical duplicate). The RSL3-treated condition was used as comparator in the statistical analysis. (E) 4T1 and MDA-MB-231 metastatic cells were pre-treated with 10 μM DGAT1i or DGAT2i for 4 h and then exposed ON to 0.5 μM erastin. After 24 h cells were subjected to cell viability assay (n = 3 biological replicates). The erastin-treated condition was used as comparator in the statistical analysis. Data information: In (CE), data are presented as mean ± SEM. Statistical analysis was performed using two-tailed unpaired-sample Student t-test (C), one-way ANOVA followed by Dunnett’s correction (D, E). (F) Proposed mechanism of ferroptosis susceptibility in TNBC and the underlying metabolic crosstalk between lipid upload, usage, and metabolism and the ROS-detoxifying system. Source data are available online for this figure.
Figure EV1
Figure EV1. Details of altered lipid metabolism in aggressive TNBC cells, related to Fig. 1.
(A) 67NR, 4T07, and 4T1 breast cancer cells were cultured ON in a medium containing 14C-U-(uniformly) radioactively labeled glucose, lactate, acetate, or glutamine. Lipids were extracted and the radioactive signal was measured to monitor the amount of each metabolite that is incorporated into lipids, as described in the Materials and Methods section. Each value was normalized on protein content (n = 3 biological replicates in either single, duplicate, triplicate or more than three technical replicates). The 67NR cell line was used as comparator in the statistical analysis. (B, C) Murine 4T1 (B) and D2A1 (C) breast cancer cell series were analyzed by quantitative real-time polymerase chain reaction (qRT-PCR) analysis using the assays described in the figure. Fold relative enrichment is shown using the non-metastatic cells as comparator (n = 3 biological replicates in either single or technical duplicate). The 67NR or the D2A1 cells were used as comparator in the statistical analysis. (D) The 4T1, D2A1, and human TNBC cells were subjected to cytofluorimetric analysis. FACS analysis of the mean fluorescence intensity (MFI) of the populations positive for BODIPY493/503 was reported (n = 3 biological replicates in either single or technical triplicate). The non-metastatic cells were used as comparators in the statistical analysis. (E) Murine 4T1 and D2A1 series were analyzed by qRT-PCR analysis using the assay described in the figures. Fold relative enrichment is shown using the 67NR or the D2A1 cells as comparator (n = 3 biological replicates in either single or technical duplicate). The 67NR or the D2A1 cells were used as comparator in the statistical analysis. (F, G) Seahorse XFe96 Mito Stress Test was performed on 4T1 cell line series treated with 2 μM UK5099 (mitochondrial pyruvate carrier, MPC, inhibitor), 3 μM BPTES (glutaminase 1, GLS-1, inhibitor), or 4 μM Etomoxir (CPT1A inhibitor) for 30 min in the presence of standard condition (full medium), and oxygen consumption rate (OCR) was calculated in real-time after the administration of the ATP synthase inhibitor oligomycin, the proton uncoupler carbonyl cyanide p-triflouromethoxyphenylhydrazone (FCCP), and the respiratory complex I inhibitor rotenone together with the respiratory complex III inhibitor antimycin A (Rot/AA) (F). Basal and maximal respiration was calculated as described in the Materials and Methods section and normalized on protein content (G) (n = 3 biological replicates in either single, duplicate, triplicate, or more than three technical replicates). The untreated (NT) condition was used as comparator in the statistical analysis. (H) Murine TNBC cells were treated with 40 μM of Etomoxir for 30 min. After detachment, cells were subjected to high-resolution respirometry analysis by the Oroboros-O2K instrument. Left: Representative graphs of cell respirometry analysis in the control (up) and treatment (down) conditions. The blue curve represents the oxygen concentration, whereas the red slope shows the oxygen consumption before and after the serial injections of oligomycin (O), uncoupler CCCP (C), and Antimycin A (A). Right: Bar chart graph of basal oxygen consumption (Routine), proton leak (Leak), and maximal oxygen consumption (E) values subtracted from residual oxygen consumption (ROX) in control and Etomoxir treated cells (n = 3 biological replicates). Data information: data are presented as mean ± SEM. Statistical analysis was performed using one-way ANOVA followed by Tukey’s correction (A, G) or Dunnett’s correction (BE), two-way ANOVA followed Bonferroni’s correction (F) or Tukey’s correction (H). Source data are available online for this figure.
Figure EV2
Figure EV2. Details of FADS1 and FADS2 expression in aggressive TNBC and their susceptibility to ferroptosis induction, related to Fig. 2.
(A) D2A1 cell line series were analyzed by qRT-PCR analysis using the assays described in the figure. Fold relative enrichment is shown using the D2A1 cells as comparator (n = 3 biological replicates in either single or technical duplicate). The D2A1 cells were used as comparator in the statistical analysis. (B) Kaplan–Meier analysis of RFS and DMFS of a curated cohort of TNBC patients divided into high and low for ACSL4 or PLIN2 expression as described in the Materials and Methods section. HR and log-rank Mantel-Cox P values are shown. (C) TNBC metastatic 4T07 and 4T1 cells were treated with 10 μM FADS2i (SC-26196), FADS1/2i (CP-24879), or SCD1i (CAY10566) for 24 h and subjected to cell viability assay (n = 3 biological replicates). (D) Intracellular ROS levels were measured by CellROX and DCFDA staining while mitochondrial ROS levels by MitoSOX in TNBC 4T1 series’ cells (n = 3 biological replicates in either single or technical duplicate). The 67NR cell line was used as comparator in the statistical analysis. (E) Murine TNBC cells were analyzed by qRT-PCR analysis using the assay described in the figure (n = 3 biological replicates in either single, duplicate, or technical triplicate). Fold relative enrichment and statistical analysis are shown using the non-metastatic (67NR or D2A1) cells as comparator. (F, G) 24-h dose-response curve of RSL3 (F) and erastin (G) showed a differential effect between less aggressive and metastatic cells of the D2A1 or 4T1 series (n = 3 biological replicates). Statistics is shown using the non-metastatic (67NR or D2A1) cells as comparator. (H) Weight of BALB/c mice exposed for 15 days to 40 mg/kg RSL3 (n = 4–6 mice/group). Data information: data are presented as mean ± SEM. Statistical analysis was performed using one-way ANOVA followed by Dunnett’s correction (A, C, E) or Tukey’s correction (D), two-way ANOVA followed by Bonferroni’s correction (FH). Source data are available online for this figure.
Figure EV3
Figure EV3. Details of Ferrostatin-1, Deferoxamine, and ACSL4 inhibition ability to prevent RSL3-induced cell death in TNBC cells, related to Fig. 3.
(AC) Metastatic 4T07 and 4T1 (A), D2A1-m1 and D2A1-m2 (B), MDA-MB-468 and MDA-MB-231 (C) cells were pre-treated with 15 μM Fer-1, 5 μM DFOM, or 10 μM ACSL4i for 4 h and then exposed ON to 0.5 μM erastin. After 24 h cells were subjected to cell viability assay (n = 3 biological replicates in either single, duplicate, or technical triplicate). The erastin-treated condition was used as comparator in the statistical analysis. Data information: data are presented as mean ± SEM. Statistical analysis was performed using one-way ANOVA, Dunnett corrected. Source data are available online for this figure.
Figure EV4
Figure EV4. Details of the ability of FADS1/2 targeting in preventing ferroptosis induction in aggressive TNBC, related to Fig. 4.
(AC) TNBC metastatic 4T07 and 4T1 (A), D2A1-m1 and D2A1-m2 (B), human MDA-MB-468 and MDA-MB-231 (C) cells were pre-treated with 10 μM FADS2i (SC-26196), FADS1/2i (CP-24879), and SCD1i (CAY10566) for 4 h, exposed ON to 0.5 μM erastin, and subjected to cell viability assay (n = 3 biological replicates in either single, duplicate or technical triplicate). The erastin-treated condition was used as comparator in the statistical analysis. (DF) TNBC metastatic 4T07 and 4T1 (D), D2A1-m1 and D2A1-m2 (E), human MDA-MB-468 and MDA-MB-231 (F) cells were pre-treated with 10 μM FADS2i (SC-26196), FADS1/2i (CP-24879), and SCD1i (CAY10566) for 4 h, exposed for 2 h to 5 μM erastin, and subjected to cytofluorimetric analysis to measure lipid peroxidation (n = 3 biological replicates in either single, duplicate or technical triplicate). The erastin-treated condition was used as comparator in the statistical analysis. (G) Highly metastatic MDA-MB-231 cells were pre-treated with 10 μM FADS2i or FADS1/2i for 4 h, exposed for 2 h to 1 μM RSL3, and subjected to confocal analysis to measure lipid peroxidation. Relative quantification is shown (n = 3 biological replicates). The RSL3-treated condition was used as comparator in the statistical analysis. Data information: data are presented as mean ± SEM. Statistical analysis was performed using one-way ANOVA followed by Dunnett’s correction (AF) or Tukey’s correction (G). Source data are available online for this figure.
Figure EV5
Figure EV5. Details of FADS1/2 knockdown effect on lipidomic profile of TNBC cells and their susceptibility to ferroptosis induction, related to Fig. 5.
(AD) 4T1 cells transfected with non-targeting small interfering RNA (siCTR) or 2 different combination pools of 4 individual siRNA for FADS1 (siFADS1_pool1 and pool2) and FADS2 (siFADS2_pool1 and pool2) and assessed by qRT-PCR (A) were treated ON with 0.1 μM RSL3 (B) or 2 h with 1 μM RSL3 (C, D) and assayed for cell survival (B), confocal analysis (C), and cytofluorimetric analysis (D) to measure lipid peroxidation. Representative pictures of BODIPY581/591-C11 stained cells are shown (oxidized lipids: green; non-oxidized lipids: red; nuclei: blue, DAPI; scale bar, 10 μm) (n = 3 biological replicates in either single or technical duplicate). siCTR transfected cells (A) and siCTR transfected cells treated with RSL3 (B, D) were used as comparator in the statistical analysis. (EH) MDA-MB-231 cells transfected with siCTR or 2 different combination pools of 4 individual siRNA for FADS1 (siFADS1_pool1 and pool2) and FADS2 (siFADS2_pool1 and pool2) and assessed by qRT-PCR (E) were treated ON with 0.25 μM RSL3 (F) or 2 h with 1 μM RSL3 (G, H) and assayed for cell survival (F), confocal analysis (G), and cytofluorimetric analysis (H) to measure lipid peroxidation. Representative pictures of BODIPY581/591-C11 stained cells are shown (oxidized lipids: green; non-oxidized lipids: red; nuclei: blue, DAPI; scale bar, 10 μm) (n = 3 biological replicates in either single or technical duplicate). siCTR transfected cells (E) and siCTR transfected cells treated with RSL3 (F, H) were used as comparator in the statistical analysis. (IK) Stable FADS1/FADS2 double knockdown transfected 4T1 cells (FADS1/2KD 4T1) and the corresponding cells with the ectopic re-introduction of FADS1 and FADS2 (FADS1/2KD+OE 4T1), whose FADS1/2 expression was assessed using qRT-PCR and WB analyses (I, J), were exposed to increasing concentrations of RSL3 or erastin in a dose-response curve assay (K) (n = 3 biological replicates). The FADS1/2KD condition was used as comparator in the statistical analysis. (L, M) 67NR cells over-expressing both FADS1 and FADS2, FADS1/2OE, (L) were grown for 24 h in the presence of increasing doses of RSL3 and erastin (M) before assaying cell viability (n = 3 biological replicates). Data information: In (A, B, DF, H, I, K, M) data are presented as mean ± SEM. Statistical analysis was performed using one-way ANOVA followed by Dunnett’s correction (A, B, DF, H, I) or two-way ANOVA followed by Bonferroni’s correction (K, M). Source data are available online for this figure.

References

    1. Amaro A, Angelini G, Mirisola V, Esposito AI, Reverberi D, Matis S, Maffei M, Giaretti W, Viale M, Gangemi R et al (2016) A highly invasive subpopulation of MDA-MB-231 breast cancer cells shows accelerated growth, differential chemoresistance, features of apocrine tumors and reduced tumorigenicity in vivo. Oncotarget 7:68803–68820 - PMC - PubMed
    1. Avgustinova A, Iravani M, Robertson D, Fearns A, Gao Q, Klingbeil P, Hanby AM, Speirs V, Sahai E, Calvo F et al (2016) Tumour cell-derived Wnt7a recruits and activates fibroblasts to promote tumour aggressiveness. Nat Commun 7:10305 - PMC - PubMed
    1. Bacci M, Lorito N, Smiriglia A, Morandi A (2021) Fat and furious: lipid metabolism in antitumoral therapy response and resistance. Trends Cancer 7:198–213 - PubMed
    1. Bacci M, Lorito N, Smiriglia A, Subbiani A, Bonechi F, Comito G, Morriset L, El Botty R, Benelli M, López-Velazco JI et al (2024) Acetyl-CoA carboxylase 1 controls a lipid droplet-peroxisome axis and is a vulnerability of endocrine-resistant ER. Sci Transl Med 16:eadf9874 - PubMed
    1. Brueffer C, Vallon-Christersson J, Grabau D, Ehinger A, Häkkinen J, Hegardt C, Malina J, Chen Y, Bendahl PO, Manjer J et al (2018) Clinical value of RNA sequencing-based classifiers for prediction of the five conventional breast cancer biomarkers: a report from the population-based multicenter Sweden cancerome analysis network-breast initiative. JCO Precis Oncol 2:PO.17.00135 - PMC - PubMed

MeSH terms