. 2024 Jun 26;24(1):606.
doi: 10.1186/s12870-024-05292-1.

Seed priming with potassium nitrate alleviates the high temperature stress by modulating growth and antioxidant potential in carrot seeds and seedlings

Affiliations

Seed priming with potassium nitrate alleviates the high temperature stress by modulating growth and antioxidant potential in carrot seeds and seedlings

Muhammad Mahmood Ur Rehman et al. BMC Plant Biol. .

Erratum in

Abstract

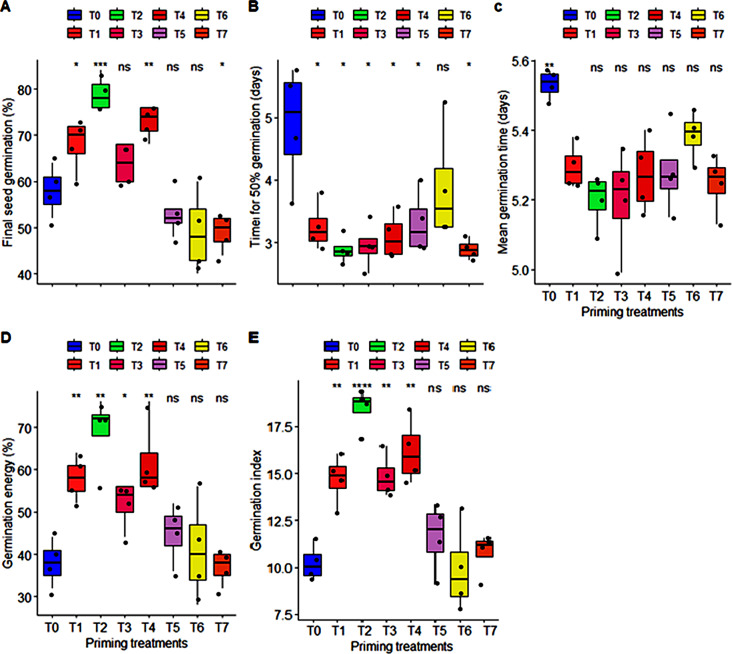
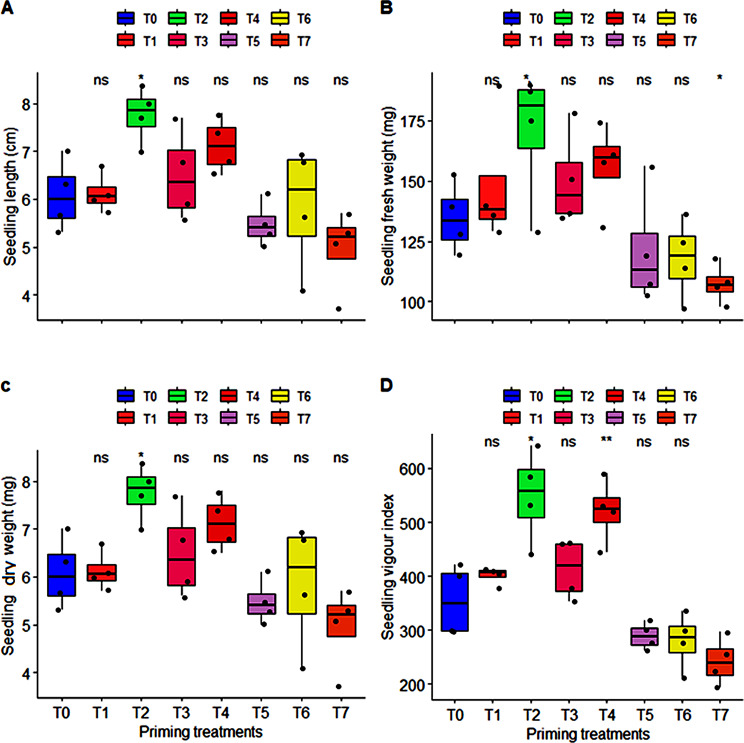
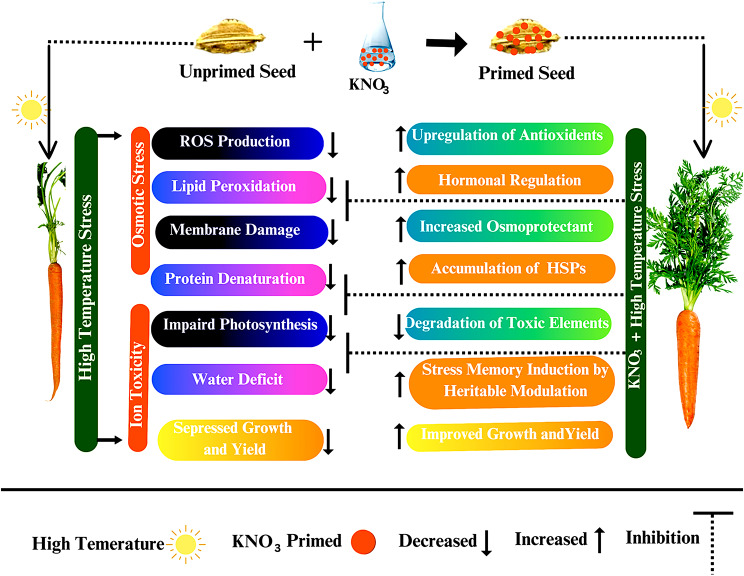
Early season carrot (Daucus carota) production is being practiced in Punjab, Pakistan to meet the market demand but high temperature hampers the seed germination and seedling establishment which cause marked yield reduction. Seed priming with potassium nitrate breaks the seed dormancy and improves the seed germination and seedling growth potential but effects vary among the species and ecological conditions. The mechanism of KNO3 priming in high temperature stress tolerance is poorly understood yet. Thus, present study aimed to evaluate high temperature stress tolerance potential of carrot seeds primed with potassium nitrate and impacts on growth, physiological, and antioxidant defense systems. Carrot seeds of a local cultivar (T-29) were primed with various concentration of KNO3 (T0: unprimed (negative control), T1: hydroprimed (positive control), T2: 50 mM, T3:100mM, T4: 150 mM, T5: 200 mM, T6: 250 mM and T7: 300 mM) for 12 h each in darkness at 20 ± 2℃. Seed priming with 50 mM of KNO3 significantly enhanced the seed germination (36%), seedling growth (28%) with maximum seedling vigor (55%) and also exhibited 16.75% more carrot root biomass under high temperature stress as compared to respective control. Moreover, enzymatic activities including peroxidase, catalase, superoxidase dismutase, total phenolic contents, total antioxidants contents and physiological responses of plants were also improved in response to seed priming under high temperature stress. By increasing the level of KNO3, seed germination, growth and root biomass were reduced. These findings suggest that seed priming with 50 mM of KNO3 can be an effective strategy to improve germination, growth and yield of carrot cultivar (T-29) under high temperature stress in early cropping. This study also proposes that KNO3 may induces the stress memory by heritable modulations in chromosomal structure and methylation and acetylation of histones that may upregulate the hormonal and antioxidant activities to enhance the stress tolerance in plants.

Keywords: Carrot growth; Heat stress; Potassium nitrate; Reactive oxygen species; Seed treatments.


Conflict of interest statement

The authors declare no competing interests.

Figures

Fig. 1
Fig. 1
Classified filled boxplots of (A) final seed germination (%), (B), time taken for 50% germination in days, (C) mean germination time in days, (D) germination energy (%), and (E) germination index of a carrot cultivar T-29. The eight priming treatments of KNO3 from T0 to T7 represented by different color filled boxplots. Each boxplot is delimited 25th and 75th percentile with error bars represents four replicates from each treatment and include a solid line represents the mean value. One way ANOVA calculated significant differences among the treatment represented with *** (P < 0.0001), ** (P < 0.001), * (P < 0.05), and ns: non-significant (P > 0.05) notations
Fig. 2
Fig. 2
Classified filled boxplots of (A) seedling length (cm), (B), seedling fresh weight (mg), (C) seedling dry weight (mg), (D) seedling vigour index of carrot seedling. The eight priming treatments of KNO3 from T0 to T7 represented by different color filled boxplots. Each boxplot is delimited 25th and 75th percentile with error bars represents four replicates from each treatment and include a solid line represents the mean value. One way ANOVA calculated significant differences among the treatment represented with *** (P < 0.0001), ** (P < 0.001), * (P < 0.05), and ns: non-significant (P > 0.05) notations
Fig. 3
Fig. 3
a.b.c Multivariate analysis of preliminary experiment (A) pearson’s correlation coefficients among pairs of response variables of carrot cultivar, (B) cluster heatmap of eight priming treatments and 10 response variables of seed germination and seedling establishment, (C) biplot of principal components of response variables. Purple dots represents negative while dark green dots represent positive correlation coefficients between response variables. Color intensity and size of dots represents the strength of dependency between pairs of response variable. Euclidian distance-based clustering in the heatmap exhibit three separate clusters for priming treatments and four separate clusters for response variables. All response variables were plotted in three directions in principal component based biplot
Fig. 4
Fig. 4
Classified filled boxplots and barplots of (A, B) final seed emergence, (C, D), seedling vigour index, (E, F) transpiration rate, (G, H) stomatal conductance, (I, J) photosynthetic rate, (K, L) water use efficiency of carrot seedlings respectively. In boxplots, four optimized priming treatments (T0, T1, T2, and T4) of KNO3 represented by different colors. Each boxplot is delimited 25th and 75th percentile with error bars represents four replicates from each treatment and include a solid line represents the mean value. Two way ANOVA (treatments and years) calculated significant differences, followed by LSD test based lettering are also presented, where same letter did not vary significantly. In barplots, two years represented by different colors, each barplot is presenting mean value and error bar represents standard error of four replicates
Fig. 5
Fig. 5
Classified filled boxplots and barplots of (A, B) total phenolic contents, (C, D) total antioxidants, (E, F) activity of POD, (G, H) activity of CAT, (I, J) activity of SOD, (K, L) activity of MDA in carrot leaves respectively. In boxplots, four optimized priming treatments (T0, T1, T2, and T4) of KNO3 represented by different colors. Each boxplot is delimited 25th and 75th percentile with error bars represents four replicates from each treatment and include a solid line represents the mean value. Two way ANOVA (treatments and years) calculated significant differences, followed by LSD test based lettering are also presented, where same letter did not vary significantly. In barplots, two years represented by different colors, each barplot is presenting mean value and error bar represents standard error of four replicates
Fig. 6
Fig. 6
Classified filled boxplots and barplots of (A, B) root length, (C, D) root weight, (E, F) carrot root yield of carrot plants respectively. In boxplots, four optimized priming treatments (T0, T1, T2, and T4) of KNO3 represented by different colors. Each boxplot is delimited 25th and 75th percentile with error bars represents four replicates from each treatment and include a solid line represents the mean value. Two way ANOVA (treatments and years) calculated significant differences, followed by LSD test based lettering are also presented, where same letter did not vary significantly. In barplots, two years represented by different colors, each barplot is presenting mean value and error bar represents standard error of four replicates
Fig. 7
Fig. 7
Multivariate analysis of preliminary experiment (A) cluster heatmap of four optimized priming treatments and 15 response variables of carrot, (B) pearson’s correlation coefficients among pairs of response variables of carrot cultivar, (C) biplot of principal components of response variables. Purple dots represents negative while dark green dots represents positive correlation coefficients between response variables. Color intensity and size of dots represents the strength of dependency between pairs of response variable. Euclidian distance based clustering in the heatmap exhibit three separate clusters for priming treatments and four separate clusters for response variables. All response variables were plotted in three directions in principal component based biplot
Fig. 8
Fig. 8
Proposed mechanistic model for the KNO3-induced alleviation of adverse effects of high temperature stress in carrot seed

References

    1. Van Dijk M, Morley T, Rau ML, Saghai Y. A meta-analysis of projected global food demand and population at risk of hunger for the period 2010–2050. Nat Food. 2021;2(7):494–501. doi: 10.1038/s43016-021-00322-9. - DOI - PubMed
    1. MacLaren C, Mead A, van Balen D, Claessens L, Etana A, de Haan J, et al. Long-term evidence for ecological intensification as a pathway to sustainable agriculture. Nat Sustain. 2022;5(9):770–9. doi: 10.1038/s41893-022-00911-x. - DOI
    1. Krishna H, Hebbar S, Kumar P, Sharma S, Kumar R, Tiwari SK, et al. Navigating challenges and prospects in off-season Vegetable Production. Vegetable Sci. 2024;51:97–105. doi: 10.61180/vegsci.2024.v51.spl.09. - DOI
    1. Nijabat A, Bolton A, Mahmood-ur-Rehman AI, Shah R, Hussain NH, Naveed A, Ali P. Simon. Cell Membrane Stability and Relative Cell Injury in Response to heat stress during early and late seedling stages of Diverse Carrot (Daucus carota L.) Germplasm. HortScience. 2020;55(9):1446–52. doi: 10.21273/HORTSCI15058-20. - DOI
    1. Bose B, Pal H. Impact of Climate Change on Vegetable Production. In: Hasanuzzaman M, editor. Climate-resilient agriculture. 1. Cham: Springer; 2023.

MeSH terms