. 2024 Jun 27;24(1):220.
doi: 10.1186/s12935-024-03375-5.

Breast cancer patient-derived organoids for the investigation of patient-specific tumour evolution

Affiliations

Breast cancer patient-derived organoids for the investigation of patient-specific tumour evolution

Serena Mazzucchelli et al. Cancer Cell Int. .

Abstract

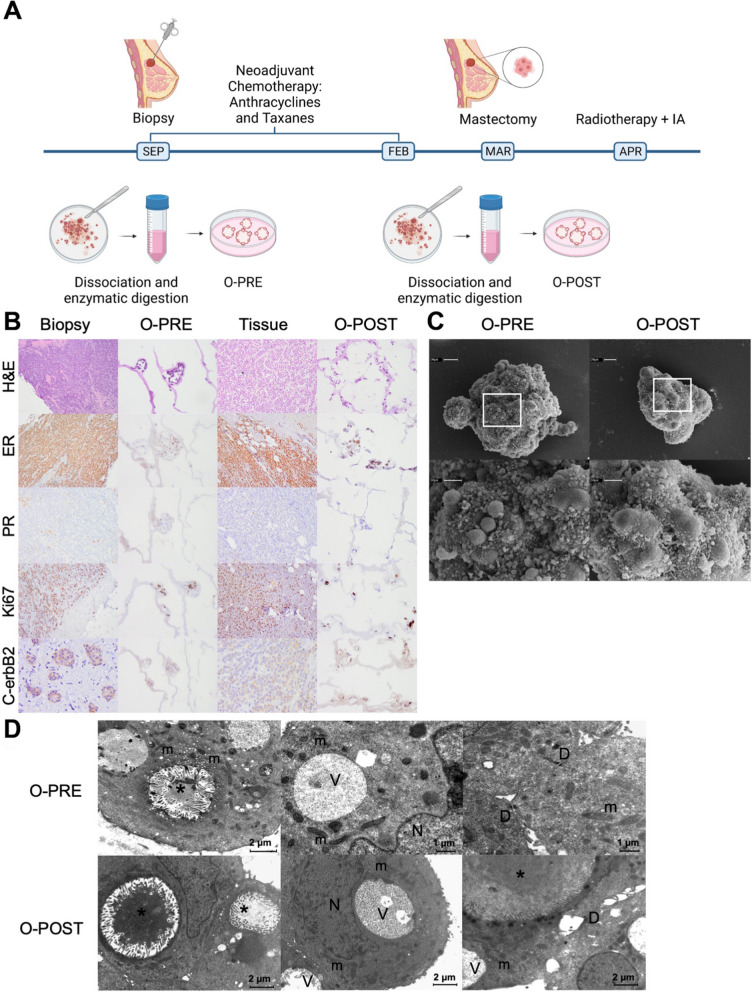
Background: A reliable preclinical model of patient-derived organoids (PDOs) was developed in a case study of a 69-year-old woman diagnosed with breast cancer (BC) to investigate the tumour evolution before and after neoadjuvant chemotherapy and surgery. The results were achieved due to the development of PDOs from tissues collected before (O-PRE) and after (O-POST) treatment.

Methods: PDO cultures were characterized by histology, immunohistochemistry (IHC), transmission electron microscopy (TEM), scanning electron microscopy (SEM), confocal microscopy, flow cytometry, real-time PCR, bulk RNA-seq, single-cell RNA sequencing (scRNA-seq) and drug screening.

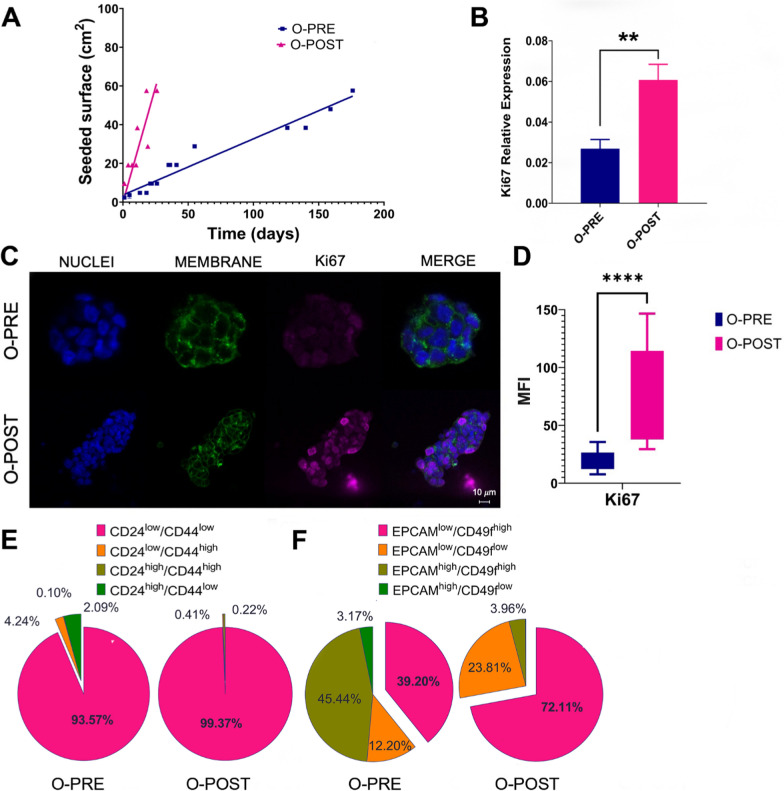
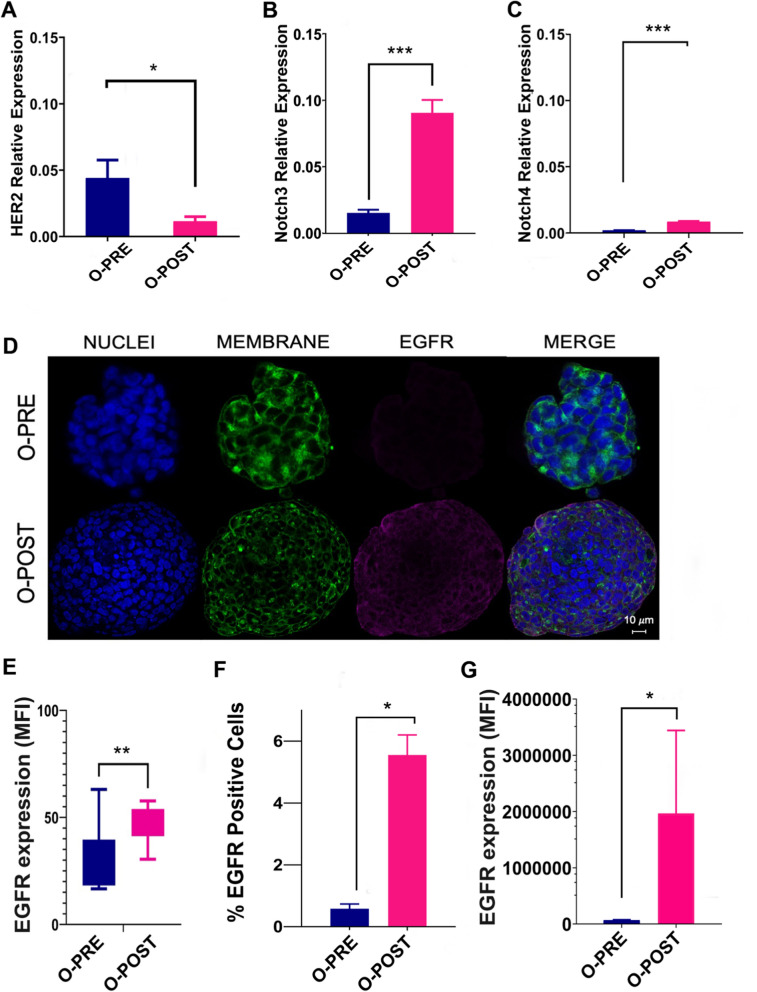
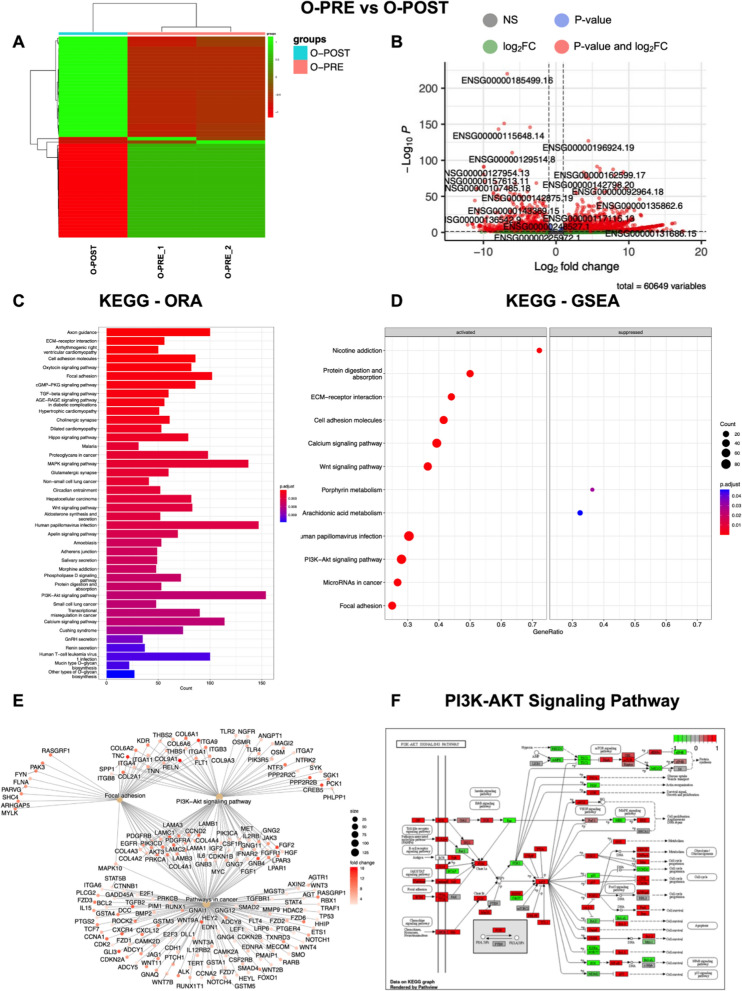
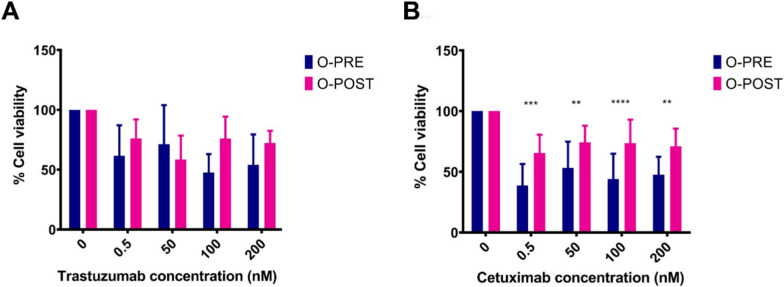
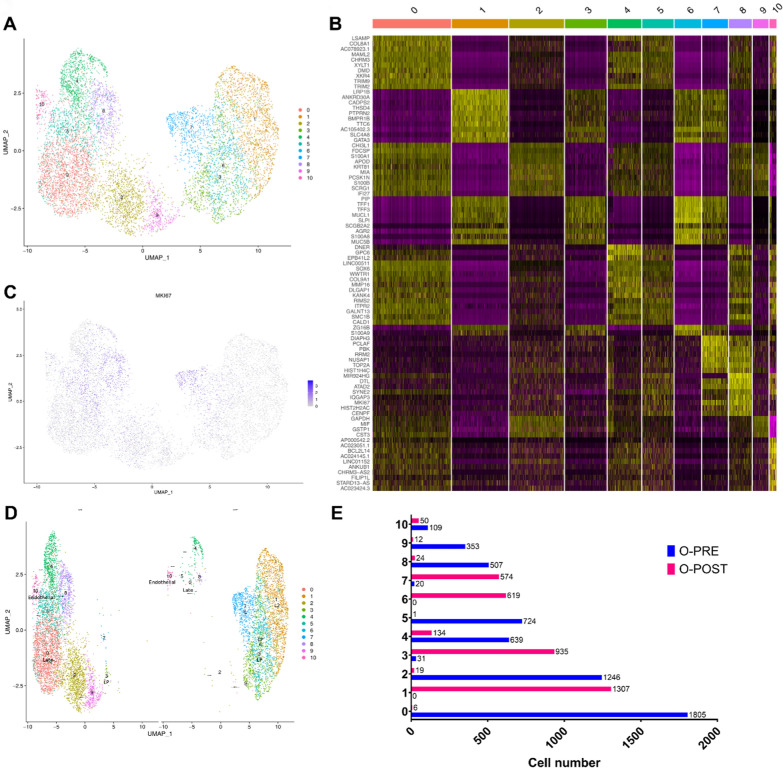
Results: Both PDO cultures recapitulated the histological and molecular profiles of the original tissues, and they showed typical mammary gland organization, confirming their reliability as a personalized in vitro model. Compared with O-PRE, O-POST had a greater proliferation rate with a significant increase in the Ki67 proliferation index. Moreover O-POST exhibited a more stem-like and aggressive phenotype, with increases in the CD24low/CD44low and EPCAMlow/CD49fhigh cell populations characterized by increased tumour initiation potential and multipotency and metastatic potential in invasive lobular carcinoma. Analysis of ErbB receptor expression indicated a decrease in HER-2 expression coupled with an increase in EGFR expression in O-POST. In this context, deregulation of the PI3K/Akt signalling pathway was assessed by transcriptomic analysis, confirming the altered transcriptional profile. Finally, transcriptomic single-cell analysis identified 11 cell type clusters, highlighting the selection of the luminal component and the decrease in the number of Epithelial-mesenchymal transition cell types in O-POST.

Conclusion: Neoadjuvant treatment contributed to the enrichment of cell populations with luminal phenotypes that were more resistant to chemotherapy in O-POST. PDOs represent an excellent 3D cell model for assessing disease evolution.

Keywords: Breast cancer; Patient-derived organoids; Tumour evolution.


Conflict of interest statement

The authors declare no competing financial interests.

Figures

Fig. 1
Fig. 1
Patient clinical history and characterization of the two tumour tissue samples and matched organoids derived before and after NACT. A Timeline of the establishment of the BC PDOs O-PRE and O-POST. B Histological and molecular characterization of O-PRE, tumour tissues and O-POST through H&E staining and IHC for oestrogen (ER) and progesterone (PR) receptors, the Ki67 proliferation index and the HER2 (c-erbB2) receptor. O-PRE and O-POST were compared with respect to the histological and molecular features of the tissues of origin. C SEM images of O-PRE and O-POST. Both types of organoids showed an almost spheroidal shape. At higher magnification, microvilli and debris are in close proximity to the cell junctions. D TEM images of O-PRE and O-POST. They share the same morphological characteristics: numerous intracellular lumens (*) rich in microvilli and containing amorphous material of probable protein origin; elongated mitochondria (m) rich in ridges; and small desmosomes (D) and vacuoles (V). N = nucleus
Fig. 2
Fig. 2
Differences in the proliferation rate and EMT potential between O-PRE and O-POST. A Growth curves of O-PRE and O-POST cultures (N = 2–3). (B-D) Characterization of O-PRE and O-POST by qRT‒PCR (B) and confocal microscopy analyses (C, D) of Ki67 expression. Box plot analysis showing the Ki67 expression levels, evaluated as the relative expression of Ki67 (B) and as the mean fluorescence intensity (MFI) (C-D), obtained from image quantification of O-PRE and O-POST cultures. ****p < 0.0001. Representative images of Ki67 immunofluorescence staining are shown in Panel C. Nuclei (blue, DAPI), membrane (green, WGA FITC) and Ki67 (pink, Anti-Rb AF546) are labelled. Scale bar = 10 µm. E O-PRE and O-POST were evaluated by multiparametric flow cytometry for the cell surface markers CD24 and CD44. F O-PRE and O-POST were analysed by multiparametric flow cytometry for the expression of EPCAM and CD49f markers
Fig. 3
Fig. 3
Differential expression of surface cancer biomarkers. A qRT‒PCR analysis to evaluate HER2 gene expression was performed with mRNA extracted from O-PRE and O-POST cultures. The data are the means of three independent experiments. The transcript expression levels are presented as the normalized expression. B-C qRT‒PCR analysis to evaluate Notch3 and Notch4 gene expression was performed with mRNA extracted from O-PRE and O-POST cultures. The data are presented as the means of three independent experiments ± s.e. The transcript expression levels are presented as the normalized expression of β-actin (for HER2) or GAPDH (for Notch3 and Notch4). *p < 0.05; ***p < 0.005. D Representative images of EGFR immunofluorescence staining (pink, anti-Rb AF546) in O-PRE and O-POST cultures. Nuclei (blue, DAPI), membrane (green, WGA FITC), and EGFR. Scale bar = 10 µm. E Quantification of the EGFR fluorescence signal detected by confocal microscopy in terms of the MFI. **p < 0.01 (p value = 0.004). F, G EGFR expression in the O-PRE and O-POST groups was evaluated by flow cytometry analysis, using untreated cells to determine the region of positivity and the singlets gate. *p < 0.05
Fig. 4
Fig. 4
Transcriptome analysis highlights different expression profiles in O-PRE vs. O-POST cultures. We considered as differentially expressed only genes showing |log2(samples/control samples)|≥ 1 and a false discovery rate ≤ 0.05. A Heatmap of differentially expressed genes (DE RNAs) in O-PRE vs. O-POST organoid cultures. B Volcano plot showing DE RNAs between O-PRE and O-POST. The x-axis shows the log2FC. The p value is shown on a logarithmic scale on the y-axis. Genes that respected the conditions in terms of log2FC and FDR are reported in red, non-DEGs are reported in grey, and genes that respected only one condition are reported either in blue or in green. Considering the 0 on the x-axis, upregulated genes are on the right, while downregulated genes are on the left. C Bar plot of the top 40 KEGG pathways in O-PRE vs. O-POST obtained by performing the overrepresentation analysis via clusterProfiler. The y-axis represents the name of the pathway, the x-axis represents the number of DE RNAs in the pathway, and the colour indicates the adjusted p value. D Dot plot of KEGG pathways in O-PRE vs. O-POST organoid cultures obtained by performing GSEA via clusterProfiler. The figure shows the significantly activated pathways and inhibited pathways. Dot size refers to the number of genes associated with each pathway. The gene ratio is the ratio between the enriched genes and the total genes in the relative pathway database. E Cnet plot of specific KEGG pathways in O-PRE vs. O-POST organoid cultures obtained by performing GSEA via clusterProfiler. The plot shows the principal node with the name of the specific pathway and the gene of the GSEA core enrichment coloured by log2FC. F KEGG pathway analysis of the PI3K-Akt signalling pathway in O-PRE vs. O-POST. The upregulated genes are represented in red, whereas the downregulated genes are represented in green
Fig. 5
Fig. 5
Cell viability assay to assess O-PRE and O-POST drug sensitivity. A Drug response of O-PRE and O-POST cultures to treatment with trastuzumab at four different concentrations (0.5 nM, 50 nM, 100 nM, and 200 nM). Ten replicates for each condition were used. B Drug response of O-PRE and O-POST to treatment with cetuximab at four different concentrations (0.5 nM, 50 nM, 100 nM, and 200 nM). Ten replicates for each condition were used. The data are reported as the means ± SDs; *p < 0.0332; **p < 0.0021; ***p < 0.0002; ****p < 0.0001
Fig. 6
Fig. 6
Single-cell RNA-seq analysis of O-PRE and O-POST to characterize cellular populations. A UMAP visualization of the 11 identified cell clusters. B Heatmap of the top 10 most highly expressed genes in each cluster. C UMAP visualization of MKI67 expression. D UMAP representation of principal cell types and related clusters in O-PRE and O-POST organoids. E Histogram showing the number of cells in each cluster

References

    1. Sung H, et al. Global cancer statistics 2020: GLOBOCAN estimates of incidence and mortality worldwide for 36 cancers in 185 countries. CA Cancer J Clin. 2021;71:209–249. doi: 10.3322/caac.21660. - DOI - PubMed
    1. Denkert C, Loibl S. Response-based molecular subtyping—emergence of the third generation of breast cancer subtypes. Cancer Cell. 2022;40:592–594. doi: 10.1016/j.ccell.2022.05.012. - DOI - PubMed
    1. Loibl S, Poortmans P, Morrow M, Denkert C, Curigliano G. Breast cancer. Lancet. 2021;397:1750–1769. doi: 10.1016/S0140-6736(20)32381-3. - DOI - PubMed
    1. Pasha N, Turner NC. Understanding and overcoming tumor heterogeneity in metastatic breast cancer treatment. Nat Cancer. 2021;2(7):680–692. doi: 10.1038/s43018-021-00229-1. - DOI - PubMed
    1. Pampaloni F, Reynaud EG, Stelzer EHK. The third dimension bridges the gap between cell culture and live tissue. Nat Rev Mol Cell Biol. 2007;8(10):839–845. doi: 10.1038/nrm2236. - DOI - PubMed