

Temporal trends in population attributable fractions of modifiable risk factors for dementia: a time-series study of the English Longitudinal Study of Ageing (2004-2019)
- PMID: 38926751
- PMCID: PMC11210022
- DOI: 10.1186/s12916-024-03464-2
Temporal trends in population attributable fractions of modifiable risk factors for dementia: a time-series study of the English Longitudinal Study of Ageing (2004-2019)
Abstract
Background: Interest in modifiable risk factors (MRFs) for dementia is high, given the personal, social, and economic impact of the disorder, especially in ageing societies such as the United Kingdom. Exploring the population attributable fraction (PAF) of dementia attributable to MRFs and how this may have changed over time remains unclear. Unravelling the temporal dynamics of MRFs is crucial for informing the development of evidence-based and effective public health policies. This investigation examined the temporal trajectories of MRFs for dementia in England.
Methods: We used data from the English Longitudinal Study of Ageing, a panel study over eight waves collected between 2004 and 2019 (76,904 interviews in total). We calculated the PAFs for twelve MRFs (including six early- to mid-life factors and six late-life factors), as recommended by the Lancet Commission, and the individual weighted PAFs (IW-PAFs) for each risk factor. Temporal trends were analysed to understand the changes in the overall PAF and IW-PAF over the study period. Subgroup analyses were conducted by sex and socioeconomic status (SES).
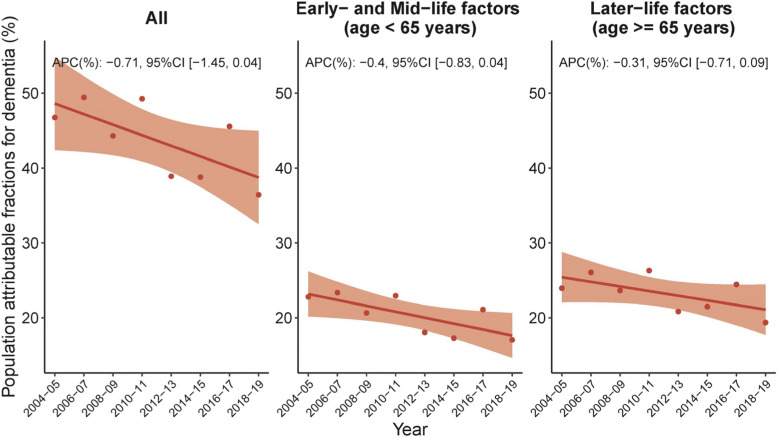
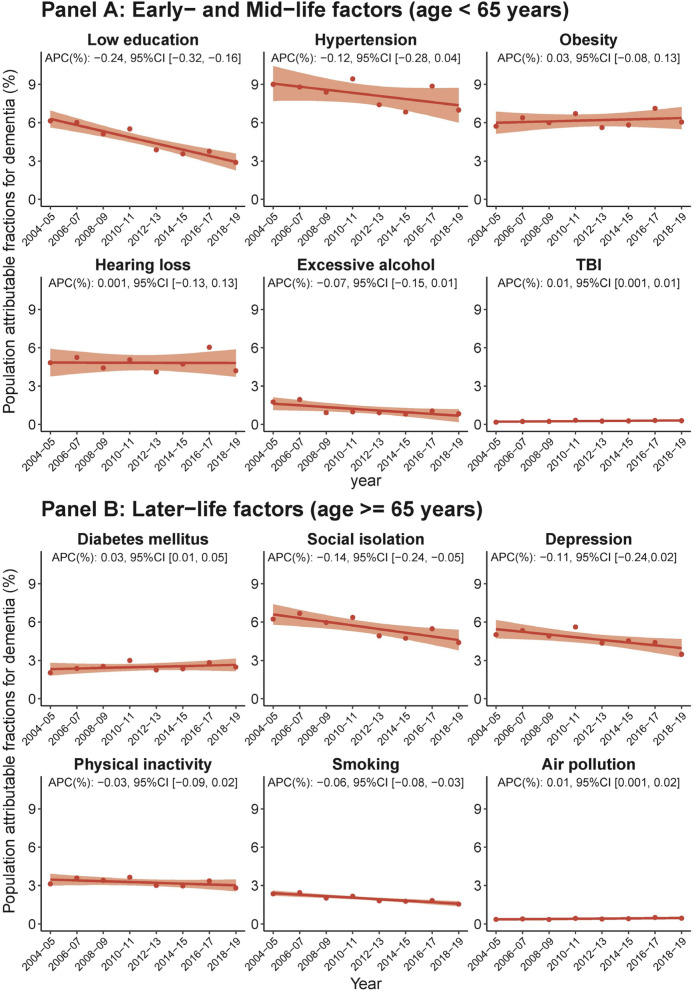
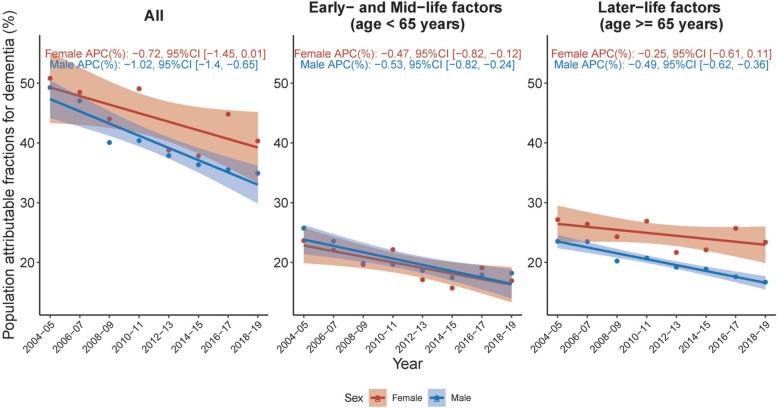
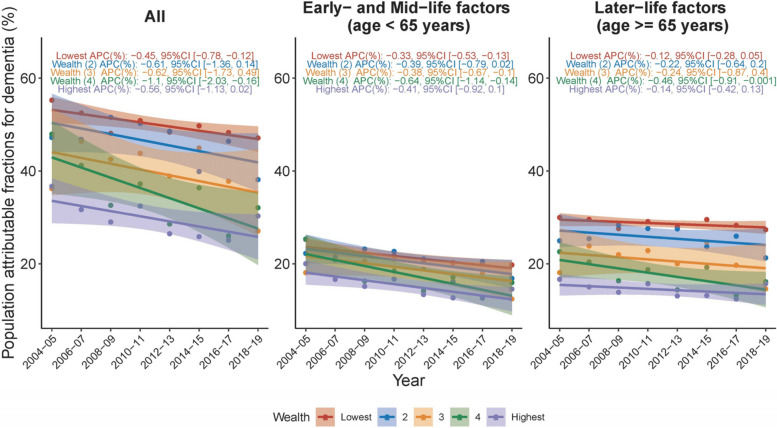
Results: The overall PAF for dementia MRFs changed from 46.73% in 2004/2005 to 36.79% in 2018/2019, though this trend was not statistically significant. During 2004-2019, hypertension, with an average IW-PAF of 8.21%, was the primary modifiable determinant of dementia, followed by obesity (6.16%), social isolation (5.61%), hearing loss (4.81%), depression (4.72%), low education (4.63%), physical inactivity (3.26%), diabetes mellitus (2.49%), smoking (2.0%), excessive alcohol consumption (1.16%), air pollution (0.42%), and traumatic brain injury (TBI) (0.26%). During 2004-2019, only IW-PAFs of low education, social isolation, and smoking showed significant decreasing trends, while IW-PAFs of other factors either did not change significantly or increased (including TBI, diabetes mellitus, and air pollution). Upon sex-specific disaggregation, a higher overall PAF for MRFs was found among women, predominantly associated with later-life risk factors, most notably social isolation, depression, and physical inactivity. Additionally, hearing loss, classified as an early- to mid-life factor, played a supplementary role in the identified sex disparity. A comparable discrepancy was evident upon PAF evaluation by SES, with lower income groups experiencing a higher dementia risk, largely tied to later-life factors such as social isolation, physical inactivity, depression, and smoking. Early- to mid-life factors, in particular, low education and obesity, were also observed to contribute to the SES-associated divergence in dementia risk. Temporal PAF and IW-PAF trends, stratified by sex and SES, revealed that MRF PAF gaps across sex or SES categories have persisted or increased.
Conclusions: In England, there was little change over time in the proportion of dementia attributable to known modifiable risk factors. The observed trends underscore the continuing relevance of these risk factors and the need for targeted public health strategies to address them.
Keywords: Dementia; Disparity; England; Population attributable fractions; Temporal trend.
© 2024. The Author(s).
Conflict of interest statement
RNC consults for Campden Instruments Ltd and receives royalties from Cambridge University Press, Cambridge Enterprise, and Routledge. BRU is the clinical director for older people’s and adult community services at CPFT. He is the clinical director of the Windsor Unit at Fulbourn Hospital (CPFT), which delivers clinical trials in dementia/mild cognitive impairment for academic and commercial organisations without personal benefit, and is the clinical lead for dementia for the NIHR Clinical Research Network (CRN) in the East of England. His salary is part-funded by the NIHR CRN. His lectureship is funded by Gnodde Goldman-Sachs Giving. He has been the principal investigator on trials for Axovant, Lilly, and EIP Pharma; his institution has benefited from payment for research carried out but he has not personally received any money. His wife is the lead for mental health for Suffolk Clinical Commissioning Group. Other authors declare no conflict of interest with this work.
Figures


References
-
- Prince M, Knapp M, Guerchet M, McCrone P, Prina M, Comas-Herrera M, et al. Dementia UK: update (second edition) London: Alzheimer’s Society UK; 2014.
-
- Wittenberg R, Hu B, Barraza-Araiza L, Rehill A. Projections of older people with dementia and costs of dementia care in the United Kingdom, 2019–2040. London: London School of Economics; 2019.
-
- Wittenberg R, Hu B, Barraza-Araiza L, Rehill A. Projections of older people living with dementia and costs of dementia care in the United Kingdom, 2019–2040. London: London School of Economics and Political Science; 2019.
Publication types
MeSH terms
Grants and funding
LinkOut - more resources
Full Text Sources
Medical
Miscellaneous
