. 2024 Jun 26;22(1):75.
doi: 10.1186/s12958-024-01246-2.

9-cis-retinoic acid signaling in Sertoli cells regulates their immunomodulatory function to control lymphocyte physiology and Treg differentiation

Affiliations

9-cis-retinoic acid signaling in Sertoli cells regulates their immunomodulatory function to control lymphocyte physiology and Treg differentiation

Alicja Kamińska et al. Reprod Biol Endocrinol. .

Abstract

Background: Testis is an immune privileged organ, which prevents the immune response against sperm antigens and inflammation. Testicular cells responsible for immune tolerance are mainly Sertoli cells, which form the blood-testis barrier and produce immunosuppressive factors. Sertoli cells prevent inflammation in the testis and maintain immune tolerance by inhibiting proliferation and inducing lymphocyte apoptosis. It has been shown that 9-cis-retinoic acid (9cRA) blocks ex vivo apoptosis of peripheral blood lymphocytes and promotes the differentiation of Treg cells in the gut. However, the role of retinoid signaling in regulating the immune privilege of the testes remains unknown.

Objective: The aim of this study was to determine whether 9cRA, acting via the retinoic acid receptors (RAR) and the retinoic X receptors (RXR), controls the immunomodulatory functions of Sertoli cells by influencing the secretion of anti-inflammatory/pro-inflammatory factors, lymphocyte physiology and Treg cell differentiation.

Methods: Experiments were performed using in vitro model of co-cultures of murine Sertoli cells and T lymphocytes. Agonists and antagonists of retinoic acid receptors were used to inhibit/stimulate retinoid signaling in Sertoli cells.

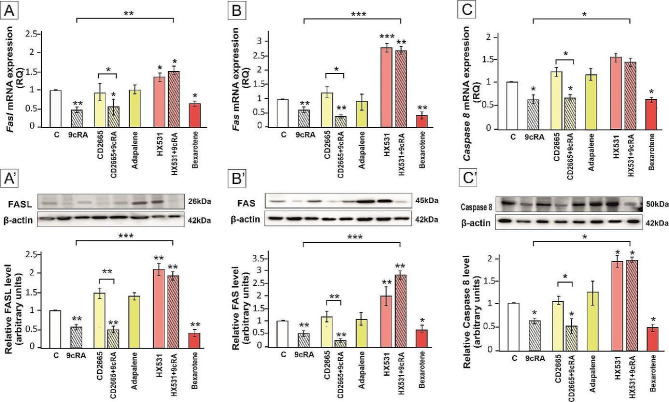
Results: Our results have demonstrated that 9cRA inhibits the expression of immunosuppressive genes and enhances the expression of pro-inflammatory factors in Sertoli cells and lymphocytes, increases lymphocyte viability and decreases apoptosis rate. Moreover, we have found that 9cRA blocks lymphocyte apoptosis acting through both RAR and RXR and inhibiting FasL/Fas/Caspase 8 and Bax/Bcl-2/Caspase 9 pathways. Finally, we have shown that 9cRA signaling in Sertoli cells inhibits Treg differentiation.

Conclusion: Collectively, our results indicate that retinoid signaling negatively regulates immunologically privileged functions of Sertoli cells, crucial for ensuring male fertility. 9cRA inhibits lymphocyte apoptosis, which can be related to the development of autoimmunity, inflammation, and, in consequence, infertility.

Keywords: 9-cis-retinoic acid; Sertoli cells; T lymphocyte apoptosis; Testis immune privilege; Treg differentiation.


Conflict of interest statement

The authors declare no competing interests.

Figures

Fig. 1
Fig. 1
Effect of 9cRA on the expression of pro-inflammatory (A-A”) and anti-inflammatory (B-B”) genes and proteins in murine Sertoli cells. Cells were treated with a vehicle (control, C), or 10− 7M 9cRA for 24 h. (A, B) Relative expression of Ifng, Tnfr1, Il1a, Il6, Tgfb1, Il10, Gal1, and Ido mRNAs was determined using quantitative real-time RT–PCR analysis. The histograms are the quantitative representation of data of three independent experiments, each in triplicate. The expression of the individual genes was normalized to the mean expression of the reference genes (Rn18s, B2m, Rpl13a, and Hprt1) as an internal control (relative quantification, RQ). (A’, B’) Western blot detection of TGFβ, IL-10, GAL-1, IDO, IFN-γ, TNFR1, IL-1α, and IL-6 proteins. The histograms are the quantitative representation after densitometry of data (mean ± SD) of three independent experiments, each in triplicate. The relative level of studied protein was normalized to β-actin. The protein levels within the control group were arbitrarily set as 1. Significant differences from control values are denoted as *p < 0.05, **p < 0.01, and ***p < 0.001 (A”,B”) Subcellular localization of TGFβ, IL-10, GAL-1, IDO, IFN-γ, TNFR1, IL-1α, and IL-6 proteins in murine Sertoli cells was visualized by immunofluorescence. Scale bar = 100 μm
Fig. 2
Fig. 2
Effect of 9cRA on the expression of pro-inflammatory genes and proteins in murine lymphocytes. Cells were treated with a vehicle (control, C), or 10− 7M 9cRA for 24 h. (A) Relative expression of Stat3, Stat5, Il2, and Jnk mRNAs was determined using quantitative real-time RT–PCR analysis. The histograms are the quantitative representation of data of three independent experiments, each in triplicate. The expression of the individual genes was normalized to the mean expression of the reference genes (Rn18s, B2m, Rpl13a, and Hprt1) as an internal control (relative quantification, RQ). (B) Western blot detection of STAT3, STAT5, IL-2, and JNK proteins. The histograms are the quantitative representation after densitometry of data (mean ± SD) of three independent experiments, each in triplicate. The relative level of studied protein was normalized to β-actin. The protein levels within the control group were arbitrarily set as 1. Significant differences from control values are denoted as *p < 0.05, **p < 0.01, and ***p < 0.001
Fig. 3
Fig. 3
The effect of 9cRA-treated Sertoli cells transplantation underneath the kidney capsule. Immunohistochemical staining for INHA in control Sertoli cell graft (C),9cRA-treated Sertoli cell grafts (9cRA), and in the intact kidney (IK). Rectangles indicate the location of the higher magnification view (bottom images). No positive staining is observed when the primary antibody is omitted (see, right bottom section). Sections were counterstained with hematoxylin. K - kidney; arrows - Sertoli cells; open arrows - immune cells. Scale bars represent 20 μm
Fig. 4
Fig. 4
Effect of retinoid signaling on murine T lymphocytes viability (MTT assay; A) and apoptosis (TUNEL assay; B). Sertoli cells were pre-treated with a vehicle (control, C), 10− 7 M 9cRA, 10− 6 M CD2665, 9cRA + CD2665, 2 × 10− 6 M Adapalene, 10− 6 M HX531, 9cRA + HX531, or 10− 5 M Bexarotene for 24 h. Spleen lymphocytes were co-cultured with 9cRA-pretreated Sertoli cells for 48 h. Bars represent mean ± SEM. Significant differences from control values are denoted as *p < 0.05, **p < 0.01, and ***p < 0.001
Fig. 5
Fig. 5
The expression of FASL (A, A’) in Sertoli cells, FAS (B, B’) and Caspase 8 (C, C’) in lymphocytes co-cultured with Sertoli cells pre-treated with 9cRA or RAR/RXR agonists or antagonists. Sertoli cells were pre-treated with a vehicle (control, C), 10− 7 M 9cRA, 10− 6 M CD2665, 9cRA + CD2665, 2 × 10− 6 M Adapalene, 10− 6 M HX531, 9cRA + HX531, or 10− 5 M Bexarotene for 24 h. Spleen lymphocytes were co-cultured with 9cRA-treated Sertoli cells for 48 h. (A, B, C) Relative expression of Fasl, Fas, and Caspase8 mRNAs was determined using quantitative real-time RT–PCR analysis. The histograms are the quantitative representation of data of three independent experiments, each in triplicate. The expression of the individual genes was normalized to the mean expression of the reference genes (Rn18s, B2m, Rpl13a, and Hprt1) as an internal control (relative quantification, RQ). (A’, B’, C’) Western blot detection of FASL, FAS, and Caspase8 proteins. The histograms are the quantitative representation after densitometry of data (mean ± SD) of three independent experiments, each in triplicate. The relative level of studied protein was normalized to β-actin. The protein levels within the control group were arbitrarily set as 1. Significant differences from control values are denoted as *p < 0.05, **p < 0.01, and ***p < 0.001
Fig. 6
Fig. 6
The expression of BAX (A, A’), BCL-2 (B, B’), and Caspase 9 (D, D’) in lymphocytes co-cultured with Sertoli cells pre-treated with 9cRA or RAR/RXR agonists or antagonists. Sertoli cells were pre-treated with a vehicle (control, C), 10− 7 M 9cRA, 10− 6 M CD2665, 9cRA + CD2665, 2 × 10− 6 M Adapalene, 10− 6 M HX531, 9cRA + HX531, or 10− 5 M Bexarotene for 24 h. Spleen lymphocytes were co-cultured with 9cRA-treated Sertoli cells for 48 h. (A, B, D) Relative expression of Bax, Bcl2, and Caspase9 mRNAs was determined using quantitative real-time RT–PCR analysis. The histograms are the quantitative representation of data of three independent experiments, each in triplicate. The expression of the individual genes was normalized to the mean expression of the reference genes (Rn18s, B2m, Rpl13a, and Hprt1) as an internal control (relative quantification, RQ). (A’, B’, D’) Western blot detection of BAX, BCL-2, and Caspase 9 proteins. The histograms are the quantitative representation after densitometry of data (mean ± SD) of three independent experiments, each in triplicate. The relative level of studied protein was normalized to β-actin. The calculated ratio of BAX/BCL-2 mRNA (C) or protein (C’) expression. The protein levels within the control group were arbitrarily set as 1. Significant differences from control values are denoted as *p < 0.05, **p < 0.01, and ***p < 0.001
Fig. 7
Fig. 7
The expression of FOXP3 in CD4 + CD25- lymphocytes co-cultured with Sertoli cells pre-treated with 9cRA or RAR/RXR agonists or antagonists. Sertoli cells were pre-treated with a vehicle (control, C), 10− 7 M 9cRA, 10− 6 M CD2665, 9cRA + CD2665, 2 × 10− 6 M Adapalene, 10− 6 M HX531, 9cRA + HX531, or 10− 5 M Bexarotene for 24 h. CD4 + CD25- lymphocytes were co-cultured with 9cRA-treated Sertoli cells for 4 days. (A) Relative expression of Foxp3 mRNAs was determined using quantitative real-time RT–PCR analysis. The histograms are the quantitative representation of data of three independent experiments, each in triplicate. The expression of the individual genes was normalized to the mean expression of the reference genes (Rn18s, B2m, Rpl13a, and Hprt1) as an internal control (relative quantification, RQ). (B) Western blot detection of FOXP3 protein. The histograms are the quantitative representation after densitometry of data (mean ± SD) of three independent experiments, each in triplicate. The relative level of studied protein was normalized to β-actin. The protein levels within the control group were arbitrarily set as 1. Significant differences from control values are denoted as *p < 0.05, **p < 0.01, and ***p < 0.001
Fig. 8
Fig. 8
Schematic illustration summarizing main results obtained in the present study

References

    1. Kaur G, Mital P, Dufour JM. Testis immune privilege - assumptions versus facts. Anim Reprod. 2013;1:3–15. - PMC - PubMed
    1. Qu N, Ogawa Y, Kuramasu M, Nagahori K, Sakabe K, Itoh M. Immunological microenvironment in the testis. Reprod Med Biol. 2019;1:24–31. - PMC - PubMed
    1. Washburn RL, Hibler T, Kaur G, Dufour JM. Sertoli cell immune regulation: a double-edged sword. Front Immunol. 2022;13:913502. doi: 10.3389/fimmu.2022.913502. - DOI - PMC - PubMed
    1. Punab M, Poolamets O, Paju P, Vihljajev V, Pomm K, Ladva R, Korrovits P, Laan M. Causes of male infertility: a 9-year prospective monocentre study on 1737 patients with reduced total sperm counts. Hum Reprod. 2017;1:18–31. - PMC - PubMed
    1. Gong J, Zeng Q, Yu D, Duan YG. T lymphocytes and testicular immunity: a new insight into immune regulation in testes. Int J Mol Sci. 2020;22:57. doi: 10.3390/ijms22010057. - DOI - PMC - PubMed