. 2024 Jun 12;14(6):682.
doi: 10.3390/biom14060682.

Integration of Proteomic and Metabolomic Data Reveals the Lipid Metabolism Disorder in the Liver of Rats Exposed to Simulated Microgravity

Affiliations

Integration of Proteomic and Metabolomic Data Reveals the Lipid Metabolism Disorder in the Liver of Rats Exposed to Simulated Microgravity

Mengyao Ru et al. Biomolecules. .

Abstract

Long-term exposure to microgravity is considered to cause liver lipid accumulation, thereby increasing the risk of non-alcoholic fatty liver disease (NAFLD) among astronauts. However, the reasons for this persistence of symptoms remain insufficiently investigated. In this study, we used tandem mass tag (TMT)-based quantitative proteomics techniques, as well as non-targeted metabolomics techniques based on liquid chromatography-tandem mass spectrometry (LC-MS/MS), to comprehensively analyse the relative expression levels of proteins and the abundance of metabolites associated with lipid accumulation in rat liver tissues under simulated microgravity conditions. The differential analysis revealed 63 proteins and 150 metabolites between the simulated microgravity group and the control group. By integrating differentially expressed proteins and metabolites and performing pathway enrichment analysis, we revealed the dysregulation of major metabolic pathways under simulated microgravity conditions, including the biosynthesis of unsaturated fatty acids, linoleic acid metabolism, steroid hormone biosynthesis and butanoate metabolism, indicating disrupted liver metabolism in rats due to weightlessness. Finally, we examined differentially expressed proteins associated with lipid metabolism in the liver of rats exposed to stimulated microgravity. These findings contribute to identifying the key molecules affected by microgravity and could guide the design of rational nutritional or pharmacological countermeasures for astronauts.

Keywords: lipid metabolism; metabolomics; proteomics; simulated microgravity.


Conflict of interest statement

The authors declare no conflicts of interest.

Figures

Figure 1
Figure 1
The lipid content increased significantly in the rat liver after the tail suspension test. (A) The weight of the rats was measured after four weeks of tail suspension. (B) Oil Red O (ORO) staining of the livers of rats in the control and tail-suspended groups (10×, left panel; 80×, right panel). (C) Relative quantitative analysis of the ORO staining results (n = 5 fields (3 rats)). The data are presented as the means ± SDs. * p < 0.05 and ** p < 0.01.
Figure 2
Figure 2
Results of biochemical analyses of the peripheral blood from the rats. The data are presented as the means ± SDs (n = 3 per group). * p < 0.05, ** p < 0.01, *** p < 0.001, and ns not significant.
Figure 3
Figure 3
Identification and functional enrichment analysis of differentially expressed proteins in the livers of rats after the tail suspension test. (A) Principal component analysis of the protein abundances of proteins quantified in rat liver tissue. The abscissa PC1 and ordinate PC2 represent the scores of the first and second principal components, respectively, and the ellipse is the 95% confidence interval. (B) Volcano plots of differentially expressed proteins in the livers of rats in the control and tail-suspended groups. The horizontal axis indicates the fold change (FC) in the differentially expressed proteins (log2 FC), the vertical axis indicates the p value (−log10 p value), and the black dot represents a protein with no significant difference. T. the red dots represent the upregulated proteins, and the green dots represent the downregulated proteins. (C) Cluster heatmaps of differentially expressed proteins in the livers of rats in the control and tail-suspended groups. Z scores are corrected for each line. The vertical axis represents significant differentially expressed proteins, and the horizontal axis represents sample information. (D) GO enrichment histogram of differentially expressed proteins in the livers of rats in the control and tail-suspended groups. The enrichment results are shown for three categories: biological process (BP), cell component (CC) and molecular function (MF) (p value ≤ 0.05). The percentage of the ordinate represents the number of differentially expressed proteins annotated to a GO term as a percentage of the number of differentially expressed proteins annotated to all proteins with GO annotation information. (E) KEGG enrichment bubble diagrams of differentially expressed proteins in the livers of rats in the control and tail-suspended groups. The horizontal axis is the ratio of the number of differentially expressed proteins in the corresponding pathway to the total number of proteins identified in the pathway. The larger the value is, the greater the degree of enrichment of differentially expressed proteins in the pathway. The colour of the points represents the p value of the hypergeometric test. The colour ranges from blue to red. The redder the colour is, the smaller the p value, indicating greater reliability of the test and greater statistical significance. The size of the dot represents the number of different proteins in the corresponding pathway, and the larger the dot is, the greater the number of differentially expressed proteins in the pathway.
Figure 4
Figure 4
Screening and functional enrichment analysis of differentially abundant metabolites in the livers of rats after the tail suspension test. (A) Principal component analysis of metabolites in rat liver tissue. (B) Score plots of the PLS-DA model of metabolites. The abscissa is the score of the sample on the first principal component, and the ordinate is the score of the sample on the second principal component. (C) Arrangement tests of PLS-DA models. The abscissa represents the correlation between the random group Y and the original group Y, and the ordinate represents the R2 and Q2 scores. (D) Volcano plots of differentially abundant metabolites in the livers of rats in the control and tail-suspended groups. The upregulated metabolites are represented by red dots, and the downregulated metabolites are represented by blue dots. The size of the dot represents the VIP value. (E) Cluster heatmaps of differentially abundant metabolites in the livers of rats in the control and tail-suspended groups. (F) KEGG enrichment bubble diagrams of differentially abundant metabolites in the livers of rats in the control and tail-suspended groups.
Figure 5
Figure 5
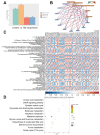
The combination of proteomics and metabolomics data. (A) The histogram summarises the number of differentially expressed proteins and metabolites. (B) Correlation network diagram of differentially expressed proteins and metabolites. It was constructed using the top 5 enriched metabolites from the metabolomics enrichment analysis and top 10 enriched proteins from the proteomics enrichment analysis. Metabolites are represented by yellow boxes, while proteins are represented by blue boxes; red lines denote positive correlations, and blue lines denote negative correlations. The width and darkness of the line correspond to the magnitude of the correlation coefficient. (C) Heatmaps of correlations between differentially expressed proteins and metabolites. The 50 most significantly enriched proteins and metabolites are shown (p values ranked from smallest to largest). The vertical axis represents differentially abundant metabolites, while the horizontal axis represents differentially expressed proteins. Blue indicates a negative correlation, and red indicates a positive correlation. The intensity of the colour reflects the strength of the correlation, and flatter ellipses indicate higher absolute values for the correlation. A statistically significant correlation is denoted by * for p < 0.05. (D) Bubble map of the KEGG enrichment analysis of differentially expressed proteins and metabolites.
Figure 6
Figure 6
Western blot analysis of molecules whose expression changed significantly in the livers of rats in the control and tail-suspended groups. The expression of acyl-CoA thioesterase 2 (Acot2) (A) and carnitine palmitoyl transferase 2 (Cpt2) (B) was detected by performing Western blot analysis and quantified. The data are presented as the means ± SDs; ** p < 0.01, *** p < 0.001.

References

    1. Afshinnekoo E., Scott R.T., MacKay M.J., Pariset E., Cekanaviciute E., Barker R., Gilroy S., Hassane D., Smith S.M., Zwart S.R., et al. Fundamental Biological Features of Spaceflight: Advancing the Field to Enable Deep-Space Exploration. Cell. 2020;183:1162–1184. doi: 10.1016/j.cell.2020.10.050. - DOI - PMC - PubMed
    1. Leach C.S., Alfrey C.P., Suki W.N., Leonard J.I., Rambaut P.C., Inners L.D., Smith S.M., Lane H.W., Krauhs J.M. Regulation of body fluid compartments during short-term spaceflight. J. Appl. Physiol. 1996;81:105–116. doi: 10.1152/jappl.1996.81.1.105. - DOI - PubMed
    1. Grimm D., Grosse J., Wehland M., Mann V., Reseland J.E., Sundaresan A., Corydon T.J. The impact of microgravity on bone in humans. Bone. 2016;87:44–56. doi: 10.1016/j.bone.2015.12.057. - DOI - PubMed
    1. Radugina E.A., Almeida E.A.C., Blaber E., Poplinskaya V.A., Markitantova Y.V., Grigoryan E.N. Exposure to microgravity for 30 days onboard Bion M1 caused muscle atrophy and impaired regeneration in murine femoral Quadriceps. Life Sci. Space Res. 2018;16:18–25. doi: 10.1016/j.lssr.2017.08.005. - DOI - PubMed
    1. Bergouignan A., Stein T.P., Habold C., Coxam V., Gorman D.O., Blanc S. Towards human exploration of space: The THESEUS review series on nutrition and metabolism research priorities. NPJ Microgravity. 2016;2:16029. doi: 10.1038/npjmgrav.2016.29. - DOI - PMC - PubMed

LinkOut - more resources