. 2024 Jun 14;14(6):703.
doi: 10.3390/biom14060703.

When Chromatin Decondensation Affects Nuclear γH2AX Foci Pattern and Kinetics and Biases the Assessment of DNA Double-Strand Breaks by Immunofluorescence

Affiliations

When Chromatin Decondensation Affects Nuclear γH2AX Foci Pattern and Kinetics and Biases the Assessment of DNA Double-Strand Breaks by Immunofluorescence

Adeline Granzotto et al. Biomolecules. .

Abstract

Immunofluorescence with antibodies against phosphorylated forms of H2AX (γH2AX) is revolutionizing our understanding of repair and signaling of DNA double-strand breaks (DSBs). Unfortunately, the pattern of γH2AX foci depends upon a number of parameters (nature of stress, number of foci, radiation dose, repair time, cell cycle phase, gene mutations, etc…) whose one of the common points is chromatin condensation/decondensation. Here, we endeavored to demonstrate how chromatin conformation affects γH2AX foci pattern and influences immunofluorescence signal. DSBs induced in non-transformed human fibroblasts were analyzed by γH2AX immunofluorescence with sodium butyrate treatment of chromatin applied after the irradiation that decondenses chromatin but does not induce DNA breaks. Our data showed that the pattern of γH2AX foci may drastically change with the experimental protocols in terms of size and brightness. Notably, some γH2AX minifoci resulting from the dispersion of the main signal due to chromatin decondensation may bias the quantification of the number of DSBs. We proposed a model called "Christmas light models" to tentatively explain this diversity of γH2AX foci pattern that may also be considered for any DNA damage marker that relocalizes as nuclear foci.

Keywords: ATM; DNA double-strand breaks; chromatin condensation; immunofluorescence; sodium butyrate.


Conflict of interest statement

The authors declare no conflicts of interest.

Figures

Figure 1
Figure 1
The seven representative patterns of γH2AX focus images obtained from the database of our laboratory from the 7 representative cell lines described in Materials and Methods. White bar represents 5 µm.
Figure 2
Figure 2
(A). Representative examples of patterns of γH2AX focus images obtained from different quiescent human cell types (as indicated) irradiated at 2 Gy X-rays followed by 1 h for repair. (B). Representative examples of patterns of γH2AX focus images obtained from untransformed human fibroblasts at the indicated cell cycle phases after 2 Gy X-rays followed by 1 h for repair. (C). Representative examples of patterns of γH2AX focus images obtained from untransformed quiescent human fibroblasts exposed to different stresses as indicated: 2 Gy X-rays followed by 1 h for repair, 5 J·m−2 UVC followed by 1 h for repair, 30 µM CuSO4 for 24 h, and exposed for 4 h to cell culture medium in which 1 million cells were exposed to 10 Gy followed by 1 h for repair, 10 µM cis-platinum for 24 h, 3 µM doxorubicin for 30 min and 1 mM H2O2 for 15 min. For all the panels, nuclei were counterstained with DAPI. White bar represents 5 µm.
Figure 3
Figure 3
(A). Representative examples of γH2AX focus images obtained from the radioresistant human 1BR3 fibroblast cell lines exposed to 2 Gy X-rays followed by the indicated post-irradiation times for repair. (B). Representative examples of γH2AX focus images obtained from the radioresistant human 1BR3 fibroblast cell lines exposed to the indicated concentrations of hydrogen peroxide (H2O2) followed by 15 min or 1 h for repair. For all the panels, nuclei were counterstained with DAPI. White bar represents 5 µm.
Figure 4
Figure 4
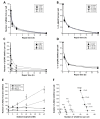
Three representative examples of γH2AX focus images obtained from the radioresistant human 1BR3 fibroblast cell lines exposed to 2 Gy X-rays, followed by the indicated post-irradiation times for repair and treated with the indicated concentration of sodium butyrate applied immediately after the period of r data are expressed in percentages, the γH2AX minifocus kinetics were found to be similar to those in pre-treated cells (p > 0.6). The γH2AX minifocus kinetics of non-pre-treated cells revealed a faster rate of focus disappearance than those of pre-treated cells (p < 0.04) but a slower rate than the SSB repair rate (p > 0.3). These findings suggested that γH2AX minifoci reflect the effects of the chromatin decondensation induced by sodium butyrate but cannot reflect each of the radiation-induced SSBs (Figure 5C,D). When expressed as a function of sodium butyrate concentration, the number of γH2AX minifoci increased, while the number of radiation-induced DNA breaks (whether DSBs or SSBs) are not seen to vary with sodium butyrate treatment. Furthermore, the number of SSBs after 2 Gy X-rays after 10 min was expected to be about 2000 per nucleus, while the number of γH2AX minifoci did not exceed 400. At 1 h post-irradiation, the radiation-induced SSBs had disappeared, while the number of γH2AX minifoci reached about 100 after 40 mM treatment (Figure 5E).
Figure 5
Figure 5
(A). Number of γH2AX foci per cell obtained from the human radioresistant 1BR3 fibroblast cell lines exposed to 2 Gy X-rays followed by the indicated post-irradiation times for repair and treated with the indicated concentration of sodium butyrate. Each plot represents the mean ± standard error of the mean (SEM) of 3 independent replicates. (B). The same data shown in panel A but expressed as percentages (data were divided by the corresponding number of γH2AX foci per cell 10 min post-irradiation). (C). Number of γH2AX minifoci per cell obtained in the same experimental conditions as described in panels A and B. Each plot represents the mean ± standard error of the mean (SEM) of 3 independent replicates. (D). The same data shown in panel (C) but expressed as percentages (data were divided by the corresponding number of γH2AX minifoci per cell 10 min post-irradiation). (E). Numbers of γH2AX foci and minifoci per cell shown in panels (A,C) expressed as a function of sodium butyrate. (F). The numbers of γH2AX foci (shown in panel (A)) were plotted against the corresponding numbers of γH2AX minifoci (shown in panel (C)). Each plot represents the mean ± standard error of the mean (SEM) of 3 independent replicates. For each repair time from 10 min to 24 h, data were fitted to the linear functions, respectively: y = 1150 − 13.94x; r = 0.98; y = 480 − 12.72x; r = 0.97; 266 − 13.46x; r = 0.99; y = 35.8 − 14.57x; r = 0.92.
Figure 6
Figure 6
The Christmas lights model. Schematic illustration of the effect of chromatin decondensation on the formation of γH2AX foci.

Similar articles

Cited by

References

    1. Bennett B.T., Bewersdorf J., Knight K.L. Immunofluorescence imaging of DNA damage response proteins: Optimizing protocols for super-resolution microscopy. Methods. 2009;48:63–71. doi: 10.1016/j.ymeth.2009.02.009. - DOI - PMC - PubMed
    1. Lisby M., Barlow J.H., Burgess R.C., Rothstein R. Choreography of the DNA damage response: Spatiotemporal relationships among checkpoint and repair proteins. Cell. 2004;118:699–713. doi: 10.1016/j.cell.2004.08.015. - DOI - PubMed
    1. Bekker-Jensen S., Mailand N. Assembly and function of DNA double-strand break repair foci in mammalian cells. DNA Repair. 2010;9:1219–1228. doi: 10.1016/j.dnarep.2010.09.010. - DOI - PubMed
    1. Costes S.V., Chiolo I., Pluth J.M., Barcellos-Hoff M.H., Jakob B. Spatiotemporal characterization of ionizing radiation induced DNA damage foci and their relation to chromatin organization. Mutat. Res. 2010;704:78–87. doi: 10.1016/j.mrrev.2009.12.006. - DOI - PMC - PubMed
    1. Abend M., Badie C., Quintens R., Kriehuber R., Manning G., Macaeva E., Njima M., Oskamp D., Strunz S., Moertl S., et al. Examining Radiation-Induced In Vivo and In Vitro Gene Expression Changes of the Peripheral Blood in Different Laboratories for Biodosimetry Purposes: First RENEB Gene Expression Study. Radiat. Res. 2016;185:109–123. doi: 10.1667/RR14221.1. - DOI - PubMed