Meta-Analysis
. 2024 Jun 20;14(6):731.
doi: 10.3390/biom14060731.

Unravelling the Gut Microbiome Role in Cardiovascular Disease: A Systematic Review and a Meta-Analysis

Affiliations
Meta-Analysis

Unravelling the Gut Microbiome Role in Cardiovascular Disease: A Systematic Review and a Meta-Analysis

Diana Martins et al. Biomolecules. .

Abstract

A notable shift in understanding the human microbiome's influence on cardiovascular disease (CVD) is underway, although the causal association remains elusive. A systematic review and meta-analysis were conducted to synthesise current knowledge on microbial taxonomy and metabolite variations between healthy controls (HCs) and those with CVD. An extensive search encompassing three databases identified 67 relevant studies (2012-2023) covering CVD pathologies from 4707 reports. Metagenomic and metabolomic data, both qualitative and quantitative, were obtained. Analysis revealed substantial variability in microbial alpha and beta diversities. Moreover, specific changes in bacterial populations were shown, including increased Streptococcus and Proteobacteria and decreased Faecalibacterium in patients with CVD compared with HC. Additionally, elevated trimethylamine N-oxide levels were reported in CVD cases. Biochemical parameter analysis indicated increased fasting glucose and triglycerides and decreased total cholesterol and low- and high-density lipoprotein cholesterol levels in diseased individuals. This study revealed a significant relationship between certain bacterial species and CVD. Additionally, it has become clear that there are substantial inconsistencies in the methodologies employed and the reporting standards adhered to in various studies. Undoubtedly, standardising research methodologies and developing extensive guidelines for microbiome studies are crucial for advancing the field.

Keywords: cardiovascular disease; dysbiosis; meta-analysis; metabolites; microbiome; microbiota; systematic review; trimethylamine N-oxide.


Conflict of interest statement

The authors declare no conflicts of interest.

Figures
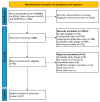
Figure 1
Figure 1
Study selection process for systematic review and meta-analysis. This PRISMA flow chart outlines each process stage, depicting the number of records involved and clarifying the inclusion and exclusion criteria.
Figure 2
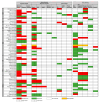
Figure 2
Qualitative analysis of microbial diversity data across different cardiovascular disease (CVD) types [20,22,23,24,25,26,27,28,31,32,33,34,35,36,37,38,39,40,41,42,43,44,45,46,47,48,49,50,51,52,53,55,56,57,59,60,62,63,64,66,67,69,70,71,72,73,74,75,76,78,79,80,81,82,83,84,85,86]. Green indicates significant differences in diversity between CVD patients and healthy controls (HC), red signifies no significant differences, yellow represents unreported results, and white denotes unmeasured metrics. The upward arrow (↑) indicates increased diversity, and the downward arrow (↓) indicates decreased diversity. Abbreviations: ACE = Abundance-based Coverage Estimator, ACS = acute coronary syndrome, AF = atrial fibrillation, AS = atherosclerosis, CAD = coronary artery disease, HF = heart failure, HTN = hypertension, ICE = Incidence-based Coverage Estimator, PD = Phylogenetic Diversity, SOBS = number of observed species.
Figure 3
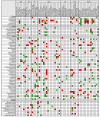
Figure 3
Qualitative analysis of bacterial relative abundance data. Qualitative analysis of bacterial relative abundance data [20,22,23,24,25,26,27,28,31,32,33,34,35,36,37,38,39,40,41,42,43,44,45,46,47,48,49,50,51,52,53,55,56,57,59,60,62,63,64,66,67,69,70,71,72,73,74,75,76,78,79,80,81,82,83,84,85,86]. Rows represent bacteria taxa from phylum to species, while columns correspond to studies concerning different types of cardiovascular disease (CVD). Green indicates significantly higher relative abundance in CVD patients, red denotes significantly lower relative abundance, and white flags unquantified taxa. Abbreviations: ACS = acute coronary syndrome, AF = atrial fibrillation, AS = atherosclerosis, CAD = coronary artery disease, HF = heart failure, HTN = hypertension.
Figure 4
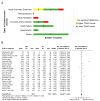
Figure 4
Trimethylamine N-Oxide (TMAO) levels vary across different types of cardiovascular disease (CVD). (A) Qualitative analysis. Green bars indicate studies with a significant increase in TMAO levels in patients with CVD compared to healthy controls (HC), red bars signify a significant decrease, and yellow bars represent studies reporting no significant differences. (B) Quantitative analysis. For each group (CVD and HC), the mean relative abundance (Mean), standard deviation (SD), and sample size (Total) are provided [20,21,24,30,31,32,35,49,54,56,58,60,65,72,74,77]. The green square markers denote TMAO levels in studies comparing individuals with and without CVD. The horizontal black lines represent the 95% confidence intervals of the study result. The diamond-shaped data marker reflects the pooled estimate (standard mean difference = 0.42), emphasising higher TMAO levels in individuals with CVD than those without.
Figure 5
Figure 5
Relative abundance of bacteria across different types of cardiovascular disease (CVD). Forest plot analysis of standard mean differences (SMD) in bacterial relative abundance between patients with CVD and healthy controls (HC). The size of each circle corresponds to the cohort size, reflecting study participant numbers. Horizontal lines represent 95% confidence intervals for individual study results. The heterogeneity level is indicated by colour-coding: I2 values of less than 25% (low, green), 25–50% (intermediate, blue), and over 50% (high, red).
Figure 6
Figure 6
Forest plots of bacteria genus relative abundance. Quantitative analysis compared the abundance of bacterial genera in individuals with and without cardiovascular disease (CVD). For each group, healthy control (HC) and CVD, the mean relative abundance (Mean), standard deviation (SD), and sample size (Total) are provided. The green square markers represent the relative abundance of bacteria, with horizontal black lines indicating the 95% confidence intervals of the study results. The diamond-shaped data markers show higher Streptococcus (A) and Proteobacteria (C) levels (SMD = 0.53 and 0.33, respectively) in the CVD group. Conversely, Faecalibacterium (B) decreased (SMD = −0.29) in the CVD group compared with HC [20,22,34,35,36,37,39,42,43,49,57,62,63,64,69,70,71,73,76,80,82,83,84,86,87,88,89].

References

    1. Hou K., Wu Z.X., Chen X.Y., Wang J.Q., Zhang D., Xiao C., Zhu D., Koya J.B., Wei L., Li J., et al. Microbiota in health and diseases. Signal Transduct. Target. Ther. 2022;7:135. doi: 10.1038/s41392-022-00974-4. - DOI - PMC - PubMed
    1. Huttenhower C., Gevers D., Knight R., Abubucker S., Badger J.H., Chinwalla A.T., Creasy H.H., Earl A.M., FitzGerald M.G., Fulton R.S., et al. Structure, function and diversity of the healthy human microbiome. Nature. 2012;486:207–214. doi: 10.1038/nature11234. - DOI - PMC - PubMed
    1. Clarke G., Stilling R.M., Kennedy P.J., Stanton C., Cryan J.F., Dinan T.G. Minireview: Gut microbiota: The neglected endocrine organ. Mol. Endocrinol. 2014;28:1221–1238. doi: 10.1210/me.2014-1108. - DOI - PMC - PubMed
    1. Yang W., Cong Y. Gut microbiota-derived metabolites in the regulation of host immune responses and immune-related inflammatory diseases. Cell. Mol. Immunol. 2021;18:866–877. doi: 10.1038/s41423-021-00661-4. - DOI - PMC - PubMed
    1. Hrncir T. Gut Microbiota Dysbiosis: Triggers, Consequences, Diagnostic and Therapeutic Options. Microorganisms. 2022;10:578. doi: 10.3390/microorganisms10030578. - DOI - PMC - PubMed

LinkOut - more resources