

Non-Invasive Spinal Cord Stimulation for Motor Rehabilitation of Patients with Spinal Muscular Atrophy Treated with Orphan Drugs
- PMID: 38927369
- PMCID: PMC11200420
- DOI: 10.3390/biomedicines12061162
Non-Invasive Spinal Cord Stimulation for Motor Rehabilitation of Patients with Spinal Muscular Atrophy Treated with Orphan Drugs
Abstract
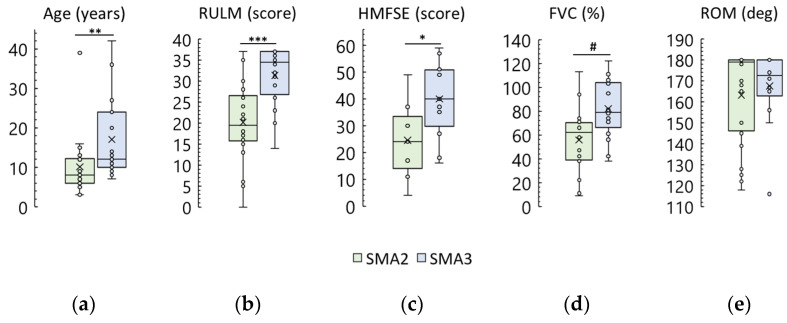
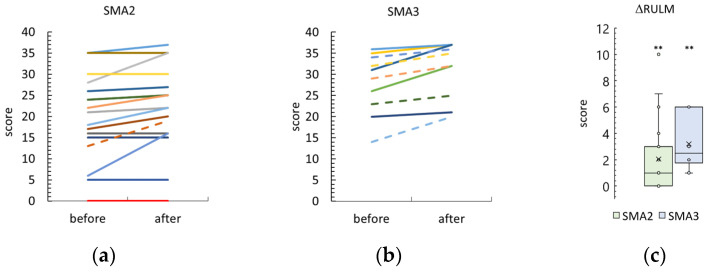
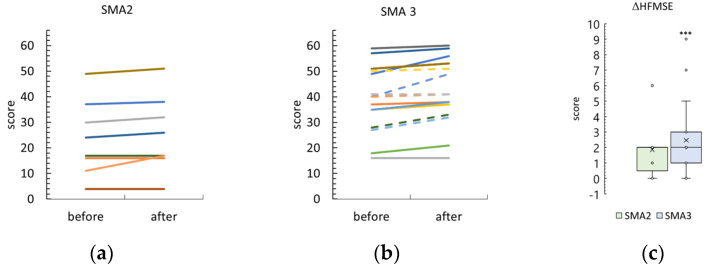
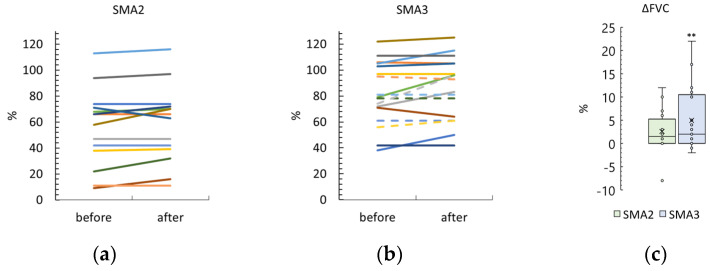
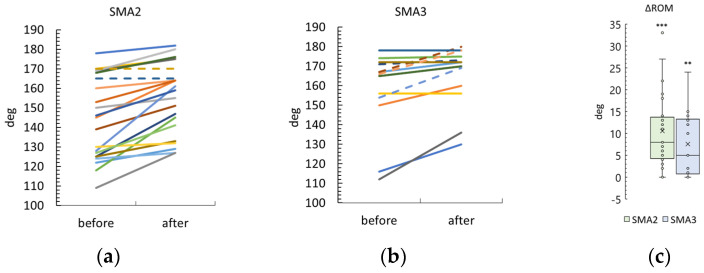
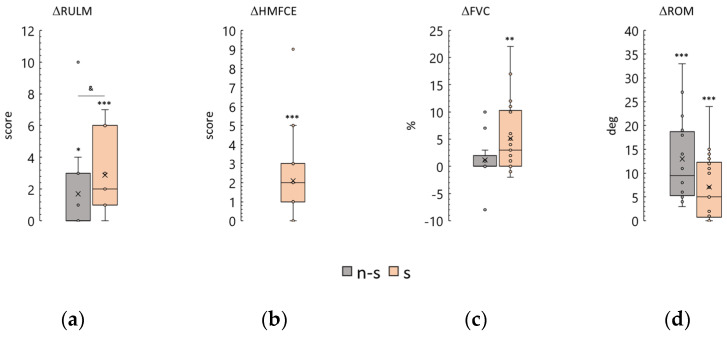
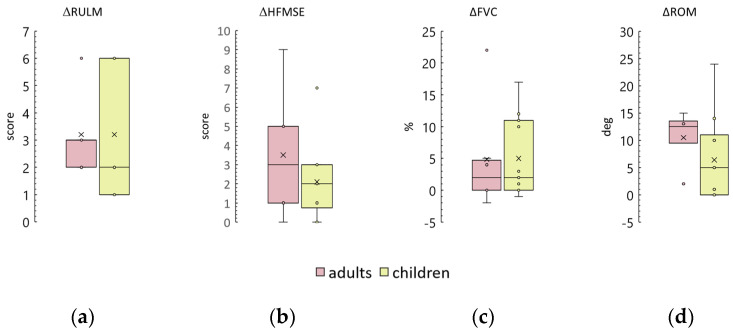
Spinal muscular atrophy (SMA) is an orphan disease characterized by the progressive degeneration of spinal alpha motor neurons. In recent years, nusinersen and several other drugs have been approved for the treatment of this disease. Transcutaneous spinal cord stimulation (tSCS) modulates spinal neuronal networks, resulting in changes in locomotion and posture in patients with severe spinal cord injury and stroke. We hypothesize that tSCS can activate motor neurons that are intact and restored by medication, slow the decline in motor activity, and contribute to the development of motor skills in SMA patients. Thirty-seven children and adults with SMA types 2 and 3 participated in this study. The median duration of drug treatment was over 20 months. The application of tSCS was performed during physical therapy for 20-40 min per day for ~12 days. Outcome measures were specific SMA motor scales, goniometry of contractured joints, and forced vital capacity. Significant increases in motor function, improved respiratory function, and decreased contracture were observed in both type 2 and 3 SMA participants. The magnitude of functional changes was not associated with participant age. Further studies are needed to elucidate the reasons for the beneficial effects of spinal cord electrical stimulation on SMA.
Keywords: nusinersen; onasemnogene abeparvovec; physical therapy; risdiplam; spinal cord stimulation; spinal muscular atrophy.
Conflict of interest statement
N.K. is a researcher on the study team and holds shareholder interest in EIRMed. T.M. is a researcher on the study team and holds shareholder interest in Cosyma. She holds certain inventorship rights on intellectual property licensed by Cosyma. The remaining authors declare no conflicts of interest. The funder had no role in the design of this study; in the collection, analyses, or interpretation of data; in the writing of the manuscript; or in the decision to publish the results.
Figures
Similar articles
-
First Use of Non-Invasive Spinal Cord Stimulation in Motor Rehabilitation of Children with Spinal Muscular Atrophy.Life (Basel). 2023 Feb 5;13(2):449. doi: 10.3390/life13020449. Life (Basel). 2023. PMID: 36836806 Free PMC article.
-
Health Care Resource Utilization and Costs for Patients with Spinal Muscular Atrophy: Findings from a Retrospective US Claims Database Analysis.Adv Ther. 2023 Oct;40(10):4589-4605. doi: 10.1007/s12325-023-02621-y. Epub 2023 Aug 16. Adv Ther. 2023. PMID: 37587305 Free PMC article.
-
Long-Term Comparative Efficacy and Safety of Risdiplam and Nusinersen in Children with Type 1 Spinal Muscular Atrophy.Adv Ther. 2024 Jun;41(6):2414-2434. doi: 10.1007/s12325-024-02845-6. Epub 2024 May 5. Adv Ther. 2024. PMID: 38705943 Free PMC article.
-
Onasemnogene Abeparvovec: A Review in Spinal Muscular Atrophy.CNS Drugs. 2022 Sep;36(9):995-1005. doi: 10.1007/s40263-022-00941-1. Epub 2022 Aug 12. CNS Drugs. 2022. PMID: 35960489 Review.
-
Spinal Muscular Atrophy: The Use of Functional Motor Scales in the Era of Disease-Modifying Treatment.Child Neurol Open. 2021 Apr 27;8:2329048X211008725. doi: 10.1177/2329048X211008725. eCollection 2021 Jan-Dec. Child Neurol Open. 2021. PMID: 33997096 Free PMC article. Review.
Cited by
-
Task-dependent frequency of intermuscular coherence in the presence of transcutaneous electrical spinal cord stimulation: a feasibility study.Front Hum Neurosci. 2025 Mar 10;19:1556325. doi: 10.3389/fnhum.2025.1556325. eCollection 2025. Front Hum Neurosci. 2025. PMID: 40129970 Free PMC article.
References
-
- Mercuri E., Finkel R.S., Muntoni F., Wirth B., Montes J., Main M., Mazzone E.S., Vitale M., Snyder B., Quijano-Roy S., et al. Diagnosis and Management of Spinal Muscular Atrophy: Part 1: Recommendations for Diagnosis, Rehabilitation, Orthopedic and Nutritional Care. Neuromuscul. Disord. 2018;28:103–115. doi: 10.1016/j.nmd.2017.11.005. - DOI - PubMed
Grants and funding
LinkOut - more resources
Full Text Sources
