. 2024 May 25;12(6):1176.
doi: 10.3390/biomedicines12061176.

Behavioral Effects of the Mixture and the Single Compounds Carbendazim, Fipronil, and Sulfentrazone on Zebrafish (Danio rerio) Larvae

Affiliations

Behavioral Effects of the Mixture and the Single Compounds Carbendazim, Fipronil, and Sulfentrazone on Zebrafish (Danio rerio) Larvae

Samara da Silva Gomes et al. Biomedicines. .

Abstract

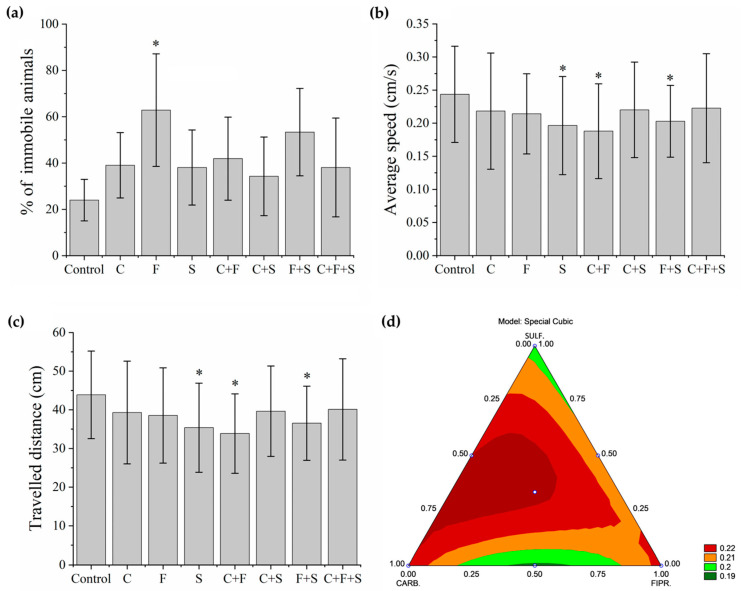
Pesticides are often detected in freshwater, but their impact on the aquatic environment is commonly studied based on single compounds, underestimating the potential additive effects of these mixtures. Even at low concentrations, pesticides can negatively affect organisms, altering important behaviors that can have repercussions at the population level. This study used a multi-behavioral approach to evaluate the effects of zebrafish larvae exposure to carbendazim (C), fipronil (F), and sulfentrazone (S), individually and mixed. Five behavioral tests, thigmotaxis, touch sensitivity, optomotor response, bouncing ball test, and larval exploratory behavior, were performed to assess potential effects on anxiety, fear, and spatial and social interaction. Significant changes were observed in the performance of larvae exposed to all compounds and their mixtures. Among the single pesticides, exposure to S produced the most behavioral alterations, followed by F and C, respectively. A synergistic effect between the compounds was observed in the C + F group, which showed more behavioral effects than the groups exposed to pesticides individually. The use of behavioral tests to evaluate pesticide mixtures is important to standardize methods and associate behavioral changes with ecologically relevant events, thus creating a more realistic scenario for investigating the potential environmental impacts of these compounds.

Keywords: behavior; pesticides; synergism; systemic effect.


Conflict of interest statement

The authors declare no conflicts of interest.

Figures

Figure 1
Figure 1
Experimental design. (a) After breeding and collection, the embryos were randomly allocated into experimental groups, with 15 animals per test solution. (b) After 144 h post-fertilization (hpf), larvae were randomly removed from polystyrene containers and placed in 48-well plates—one larva per well, with five larvae from each group per plate. After a period of acclimatization, the plates (one at a time) were positioned on an LED plate for video recording and photography. These videos and photographs were later analyzed for thigmotaxis, sensitivity to touch, and exploratory behavior. The LED board was replaced with an LCD screen, and after the acclimatization period, each of the boards was positioned on the screen to reproduce the animation of the optomotor activity test and record the videos for later analysis. (c) Larvae from each group were removed from the wells of 48-well plates and transferred to 6-well plates, with five larvae per well. After the acclimation period, the 6-well plates were placed on top of the LCD screen to play the animation of the bouncing ball test and record videos for later analysis. During all tests, the animals remained in the same test solution. The colors of the wells correspond to the test solutions to which the larvae are exposed.
Figure 2
Figure 2
Mean total percentage and standard deviation (SD) of responses of larvae exposed to pesticides and their mixtures in the thigmotaxis test (a) and responses of each group compared to the control group using a one-way ANOVA (F (7,55) = 2.06 p < 0.07) followed by Tukey’s test (C p = 0.82; F p = 0.24; S p = 0.11; C + F p = 0.08; C + S p = 0.06; F + S p = 0.43; C + F + S p = 0.43). Touch sensitivity response test (b) and responses of each group compared to the control group using a one-way ANOVA (F (7,55) = 2.11863 p < 0.05935) followed by Tukey’s test (C p = 0.92; F p = 0.09; S p = 0.92; C + F p = 0.97; C + S p = 1; F + S p = 1; C + F + S p = 1). Legend: Contr—Control; C—Carbendazim; F—Fipronil; S—Sulfentrazone.
Figure 3
Figure 3
Mean total percentage and SD of larvae that remained immobile during the Exploratory Activity test (a). Groups were compared to the control group using a one-way ANOVA (F (7,55) = 2. 71277, p < 0.01) followed by Tukey’s test (C p = 0.84; F p = 0.01; S p = 0.88; C + F p = 0.70; C + S p = 0.98; F + S p = 0.13; C + F + S p = 0.88), p < 0.05 (*). Mean Speed of larvae swimming during the test (b). Groups were compared to the control group using a one-way ANOVA (F (7,435) = 4.0053, p < 0.01) followed by Tukey’s test (C p = 0.44; F p = 0.37; S p = 0.002; C + F p < 0.05; C + S p = 0.52; F + S p = 0.03; C + F + S p = 0.67), p < 0.05 (*). Mean Total Distance traveled by larvae that swam during the test (c). Groups were compared to the control group using a one-way ANOVA (F (7,435) = 4. 00565, p < 0.01) followed by Tukey’s test (C p = 0.44; F p = 0.37; S p = 0.003; C + F p < 0.05; C + S p = 0.52; F + S p = 0.03; C + F + S p = 0.68), p < 0.05 (*). (d) Ternary contour plot of the variables Carbendazim, Fipronil, and Sulfentrazone for a special cubic model (F (3,380) = 3.004, p = 0.03), evaluating the individual effects and interactions of these pesticides in their mixtures. Carbendazim and Sulfentrazone were more toxic by reducing the total distance traveled (green areas). Key: Contr—Control; C—Carbendazim; F—Fipronil; S—Sulfentrazone.
Figure 4
Figure 4
Total trajectory traveled by a zebrafish larva from each experimental and control group in one well of a 48-well plate during the 3 min recording of the Exploratory Activity test. Key: Contr—Control; C—Carbendazim; F—Fipronil; S—Sulfentrazone.
Figure 5
Figure 5
Mean total percentage of zebrafish larvae alignment to the well during the Optomotor Response test. If the larva is inside the red demarcated area, it is considered high alignment, and outside the area is low alignment. It was analyzed by Bowker’s symmetry test, p < 0.05 (*), to the same group among initial, middle, and final test positions. (Contr p < 0.05; C p < 0.05; F p = 0.16; S p = 1; C + F p = 0.16; C + S p = 0.88; F + S p < 0.05; C + F + S p < 0.05). Key: Contr—Control; C—Carbendazim; F—Fipronil; S—Sulfentrazone; I—Initial; M—Middle; F—Final.
Figure 6
Figure 6
Mean total percentage and SD of larvae that exhibited escape behavior about the visual stimulus and stayed longer in the upper part of the well, area without stimulus, during the Bouncing Ball test (a). The response of each group was compared to the control group by one-way ANOVA (F (7,55) = 17.11, p < 0.01) followed by Tukey’s test (C p < 0.05; F p < 0.05; S p < 0.05; C + F p = 0; C + S p < 0.05; F + S p = 0.03; C + F + S p < 0.05), p < 0.05 (*). Percent grouping of larvae during the Bouncing Ball test (b), groups were compared to the control group using a one-way ANOVA (F (7,55) = 6.20, p < 0.01) followed by Tukey’s test (C p < 0.05; F p < 0.05; S p < 0.05; C + F p < 0.05; C + S p < 0.05; F + S p < 0.05; C + F + S p = 0.01), p < 0.05 (*). Key: C—Carbendazim; F—Fipronil; S—Sulfentrazone.
Figure 7
Figure 7
Cluster analysis of behaviors of larvae exposed to single and mixed pesticides at 6 dpf. p value compared to the control group as a variable. The green bars indicate values of 1–2, and the black bars indicate a value of 3. Key: C—Carbendazim; F—Fipronil; S—Sulfentrazone.

References

    1. Peterson E.K., Buchwalter D.B., Kerby J.L., LeFauve M.K., Varian-Ramos C.W., Swaddle J.P. Integrative behavioral ecotoxicology: Bringing together fields to establish new insight to behavioral ecology, toxicology, and conservation. Curr. Zool. 2017;63:185–194. doi: 10.1093/cz/zox010. - DOI - PMC - PubMed
    1. Fitzgerald J.A., Konemann S., Krumpelmann L., Zupanic A., Vom Berg C. Approaches to Test the Neurotoxicity of Environmental Contaminants in the Zebrafish Model: From Behavior to Molecular Mechanisms. Environ. Toxicol. Chem. 2021;40:989–1006. doi: 10.1002/etc.4951. - DOI - PubMed
    1. Severo E.S., Marins A.T., Cerezer C., Costa D., Nunes M., Prestes O.D., Zanella R., Loro V.L. Ecological risk of pesticide contamination in a Brazilian river located near a rural area: A study of biomarkers using zebrafish embryos. Ecotoxicol. Environ. Saf. 2020;190:110071. doi: 10.1016/j.ecoenv.2019.110071. - DOI - PubMed
    1. Li M., Ma X., Saleem M., Wang X., Sun L., Yang Y., Zhang Q. Biochemical response, histopathological change and DNA damage in earthworm (Eisenia fetida) exposed to sulfentrazone herbicide. Ecol. Indic. 2020;115:106465. doi: 10.1016/j.ecolind.2020.106465. - DOI
    1. Kronbauer E.A., Biondo E., Zanetti C., Kolchinski E.M. Agrotóxicos em água do rio e água tratada no Município de Encantado/RS. Ambiente Gestão Desenvolv. 2021;14:6–17. doi: 10.24979/ambiente.v14i2.967. - DOI

LinkOut - more resources