. 2024 Jun 18;12(6):1344.
doi: 10.3390/biomedicines12061344.

CBP/P300 Inhibition Impairs CD4+ T Cell Activation: Implications for Autoimmune Disorders

Affiliations

CBP/P300 Inhibition Impairs CD4+ T Cell Activation: Implications for Autoimmune Disorders

Lucas Wilhelmus Picavet et al. Biomedicines. .

Abstract

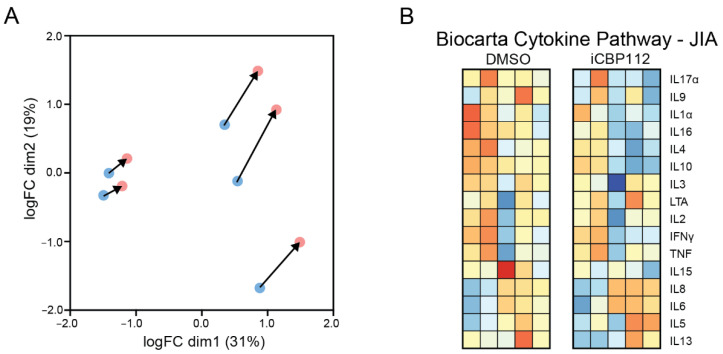
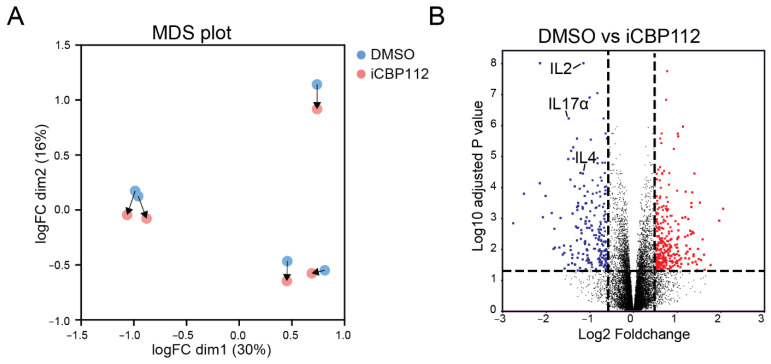
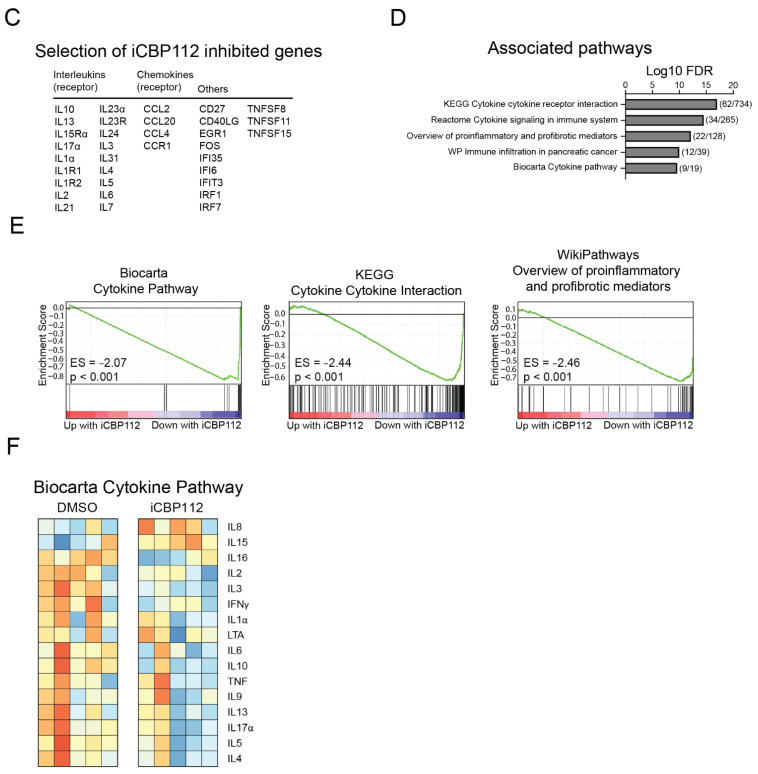
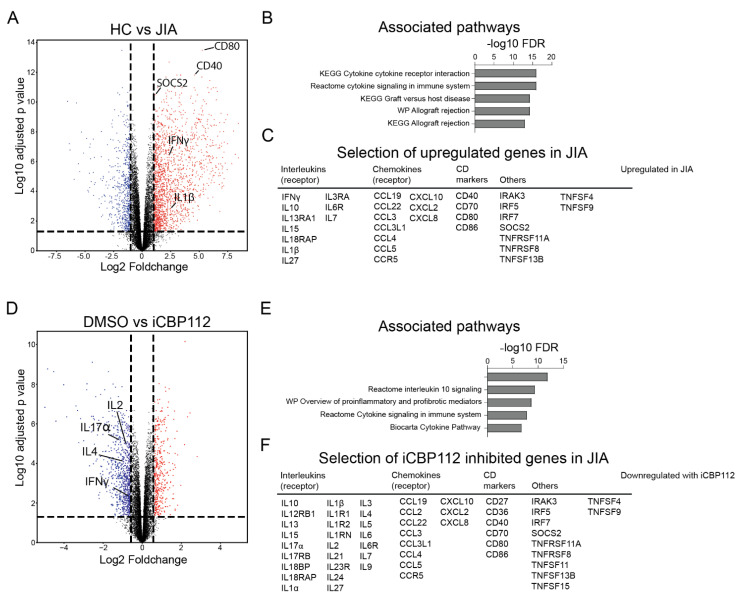
T cell activation is critical for an effective immune response against pathogens. However, dysregulation contributes to the pathogenesis of autoimmune diseases, including Juvenile Idiopathic Arthritis (JIA). The molecular mechanisms underlying T cell activation are still incompletely understood. T cell activation promotes the acetylation of histone 3 at Lysine 27 (H3K27ac) at enhancer and promoter regions of proinflammatory cytokines, thereby increasing the expression of these genes which is essential for T cell function. Co-activators E1A binding protein P300 (P300) and CREB binding protein (CBP), collectively known as P300/CBP, are essential to facilitate H3K27 acetylation. Presently, the role of P300/CBP in human CD4+ T cells activation remains incompletely understood. To assess the function of P300/CBP in T cell activation and autoimmune disease, we utilized iCBP112, a selective inhibitor of P300/CBP, in T cells obtained from healthy controls and JIA patients. Treatment with iCBP112 suppressed T cell activation and cytokine signaling pathways, leading to reduced expression of many proinflammatory cytokines, including IL-2, IFN-γ, IL-4, and IL-17A. Moreover, P300/CBP inhibition in T cells derived from the inflamed synovium of JIA patients resulted in decreased expression of similar pathways and preferentially suppressed the expression of disease-associated genes. This study underscores the regulatory role of P300/CBP in regulating gene expression during T cell activation while offering potential insights into the pathogenesis of autoimmune diseases. Our findings indicate that P300/CBP inhibition could potentially be leveraged for the treatment of autoimmune diseases such as JIA in the future.

Keywords: H3K27ac; JIA; P300/CBP; T cell activation; autoimmune diseases; cytokines; iCBP112.


Conflict of interest statement

David Tough and Rab Prinjha are employees and shareholders of GSK. The remaining authors declare that the research was conducted in the absence of any commercial or financial relationships that could be construed as a potential conflict of interest. The funder was not involved in the study design, collection, analysis, interpretation of data, the writing of this article or the decision to submit it for publication.

Figures

Figure A1
Figure A1
CREBBP and EP300 expression after iCBP112 treatment. CD4+ T cells were isolated from the synovial fluid of JIA patients (JIA) or peripheral blood of healthy controls (HC) and subsequently treated with iCBP112 or DMSO for 1 hour before aCD3/CD28 activation for 16 h. (A) Normalized expression (log2 CPM) of CREBBP after treatment of iCBP112 in HC and JIA samples. (B) Normalized expression (log2 CPM) of EP300 after treatment of iCBP112 in HC and JIA samples. ns: not significant.
Figure A2
Figure A2
CREBBP knock-down downregulates IL2 mRNA expression in T cell activation. Jurkat cells are transduced with lentiviral shRNA constructs, either shRNA against CREBBP or a non-targeting shRNA control, and are subsequently activated with ionomycin/pma for 4 h. mRNA expression of IL2 as measured by quantitative polymerase chain reaction (qPCR). p-values were calculated using a paired t-test, n = 3, *: p < 0.05.
Figure A3
Figure A3
Transcriptional profile of iCBP112 treatment in activated synovial T cells. CD4+ T cells were isolated from the synovial fluid of JIA patients or peripheral blood of healthy controls, and subsequently treated with iCBP112 or DMSO for 1 h before aCD3/CD28 activation for 16 h. mRNA expression was compared with RNA-seq. (A) Principal component analysis of iCBP112- and DMSO-treated samples. (B) Heat map depicting genes within the Biocarta cytokine pathway. Colors indicate relative RNA expression on a scale from red (high) to blue (low).
Figure 1
Figure 1
P300/CBP regulates transcriptional pathways involved in general T cell activation. RNA sequencing was performed on CD4-positive T cells isolated from the blood of five healthy donors and subsequently treated with iCBP112 before stimulation with aCD3/CD28 beads for 16 h. (A) Principal component analysis comparing CD4 T cells isolated from healthy control blood following treatment with iCBP112. (B) Volcano plot of the comparison between healthy control cells treated with iCBP112 and those treated with DMSO control. Genes significantly downregulated after treatment with iCBP112 are represented by blue dots, red dots depict genes that are significantly upregulated. (C) Selection of genes associated with immune activation exhibiting downregulated expression after iCBP112 treatment. (D) Gene Ontology (GO) terms representing pathways associated with genes showing differential expression after iCBP112 treatment. (E) Gene set enrichment analysis (GSEA) of Biocarta cytokine pathway, KEGG cytokine receptor interaction, and WP overview of proinflammatory and profibrotic mediator’s gene sets in the differentially expressed dataset following iCBP112 treatment. Colors demonstrate foldchange after iCBP112 treatment on a scale from red (high) to blue (low). (F) Heat map depicting genes within the Biocarta cytokine pathway. Colors indicate relative RNA expression on a scale from red (high) to blue (low).
Figure 1
Figure 1
P300/CBP regulates transcriptional pathways involved in general T cell activation. RNA sequencing was performed on CD4-positive T cells isolated from the blood of five healthy donors and subsequently treated with iCBP112 before stimulation with aCD3/CD28 beads for 16 h. (A) Principal component analysis comparing CD4 T cells isolated from healthy control blood following treatment with iCBP112. (B) Volcano plot of the comparison between healthy control cells treated with iCBP112 and those treated with DMSO control. Genes significantly downregulated after treatment with iCBP112 are represented by blue dots, red dots depict genes that are significantly upregulated. (C) Selection of genes associated with immune activation exhibiting downregulated expression after iCBP112 treatment. (D) Gene Ontology (GO) terms representing pathways associated with genes showing differential expression after iCBP112 treatment. (E) Gene set enrichment analysis (GSEA) of Biocarta cytokine pathway, KEGG cytokine receptor interaction, and WP overview of proinflammatory and profibrotic mediator’s gene sets in the differentially expressed dataset following iCBP112 treatment. Colors demonstrate foldchange after iCBP112 treatment on a scale from red (high) to blue (low). (F) Heat map depicting genes within the Biocarta cytokine pathway. Colors indicate relative RNA expression on a scale from red (high) to blue (low).
Figure 2
Figure 2
iCBP112-mediated inhibition of key proinflammatory cytokine expression. (A) Normalized RNA expression (counts per million, CPM) of IL2, IFNγ, IL4, and IL17α genes extracted from the RNA-sequencing dataset following iCBP112 treatment. (B) Relative mRNA expression of IL2, IFNγ, IL4, and IL17α as measured by quantitative polymerase chain reaction (qPCR). (C) Quantitative analysis of IL-2, IFN-γ, IL-4 and IL-17α protein expression measured by Luminex. p-values were calculated using a paired t-test, n = 6, ns: not significant, *: p < 0.05, **: p < 0.01, ***: p < 0.005, ****: p < 0.001.
Figure 3
Figure 3
iCBP112 preferentially inhibits JIA-associated genes in synovial T cells. CD4+ T cells were isolated from the synovial fluid of five JIA patients or peripheral blood of five healthy controls and subsequently treated with iCBP112 before stimulation with aCD3/CD28 beads for 16 h. mRNA expression was compared by RNA sequencing. (A) Volcano plot illustrating the comparison between DMSO-treated healthy control cells and JIA-derived cells. Genes significantly downregulated in JIA are represented by blue dots, red dots depict genes that are significantly upregulated. (B) GO-terms representing the pathways associated with genes, showing differential expression in JIA. (C) Selected genes associated with immune regulation that are differentially expressed, both upregulated and downregulated in JIA. (D) Volcano plot illustrating the comparison between JIA T cells treated with iCBP112 and those treated with DMSO control. Genes significantly downregulated after iCBP112 treatment are represented by blue dots, red dots depict genes that are significantly upregulated. (E) GO-terms representing the pathways associated with genes showing differential expression after iCBP112 treatment in JIA T cells. (F) A selection of genes associated with immune regulation that have downregulated expression after iCBP112 treatment in JIA T cells. (G) Gene set enrichment analysis (GSEA) depicting iCBP112-inhibited genes in the differentially expressed dataset of HC versus JIA T cells. Colors demonstrate foldchange in JIA T cells on a scale from red (high) to blue (low). (H) Venn diagram of iCBP112-inhibited genes in JIA and genes that are upregulated in JIA. Go-terms are shown for genes that are present in both gene lists. (I) Normalized expression (CPM) of IL2, IFNγ, IL4, and IL17α genes in JIA T cells treated with iCBP112. p-values were calculated using a paired t-test, n = 5 ***: p < 0.005, ****: p < 0.001.
Figure 3
Figure 3
iCBP112 preferentially inhibits JIA-associated genes in synovial T cells. CD4+ T cells were isolated from the synovial fluid of five JIA patients or peripheral blood of five healthy controls and subsequently treated with iCBP112 before stimulation with aCD3/CD28 beads for 16 h. mRNA expression was compared by RNA sequencing. (A) Volcano plot illustrating the comparison between DMSO-treated healthy control cells and JIA-derived cells. Genes significantly downregulated in JIA are represented by blue dots, red dots depict genes that are significantly upregulated. (B) GO-terms representing the pathways associated with genes, showing differential expression in JIA. (C) Selected genes associated with immune regulation that are differentially expressed, both upregulated and downregulated in JIA. (D) Volcano plot illustrating the comparison between JIA T cells treated with iCBP112 and those treated with DMSO control. Genes significantly downregulated after iCBP112 treatment are represented by blue dots, red dots depict genes that are significantly upregulated. (E) GO-terms representing the pathways associated with genes showing differential expression after iCBP112 treatment in JIA T cells. (F) A selection of genes associated with immune regulation that have downregulated expression after iCBP112 treatment in JIA T cells. (G) Gene set enrichment analysis (GSEA) depicting iCBP112-inhibited genes in the differentially expressed dataset of HC versus JIA T cells. Colors demonstrate foldchange in JIA T cells on a scale from red (high) to blue (low). (H) Venn diagram of iCBP112-inhibited genes in JIA and genes that are upregulated in JIA. Go-terms are shown for genes that are present in both gene lists. (I) Normalized expression (CPM) of IL2, IFNγ, IL4, and IL17α genes in JIA T cells treated with iCBP112. p-values were calculated using a paired t-test, n = 5 ***: p < 0.005, ****: p < 0.001.

References

    1. Avni O., Lee D., Macian F., Szabo S.J., Glimcher L.H., Rao A. Th Cell Differentiation Is Accompanied by Dynamic Changes in Histone Acetylation of Cytokine Genes. Nat. Immunol. 2002;3:643–651. doi: 10.1038/ni808. - DOI - PubMed
    1. Beacon T.H., Delcuve G.P., López C., Nardocci G., Kovalchuk I., van Wijnen A.J., Davie J.R. The Dynamic Broad Epigenetic (H3K4me3, H3K27ac) Domain as a Mark of Essential Genes. Clin. Epigenet. 2021;13:138. doi: 10.1186/s13148-021-01126-1. - DOI - PMC - PubMed
    1. Benjamini Y., Hochberg Y. Controlling the False Discovery Rate: A Practical and Powerful Approach to Multiple Testing. J. R. Stat. Soc. Ser. B Methodol. 1995;57:289–300. doi: 10.1111/j.2517-6161.1995.tb02031.x. - DOI
    1. Chen J., Bardes E.E., Aronow B.J., Jegga A.G. ToppGene Suite for Gene List Enrichment Analysis and Candidate Gene Prioritization. Nucleic Acids Res. 2009;37((Suppl. S2)):W305–W311. doi: 10.1093/nar/gkp427. - DOI - PMC - PubMed
    1. Chen Q., Yang B., Liu X., Zhang X.D., Zhang L., Liu T. Histone Acetyltransferases CBP/P300 in Tumorigenesis and CBP/P300 Inhibitors as Promising Novel Anticancer Agents. Theranostics. 2022;12:4935. doi: 10.7150/thno.73223. - DOI - PMC - PubMed

Grants and funding