. 2024 Jun 9;15(6):759.
doi: 10.3390/genes15060759.

Looking into the Quantification of Forensic Samples with Real-Time PCR

Affiliations

Looking into the Quantification of Forensic Samples with Real-Time PCR

Ugo Ricci et al. Genes (Basel). .

Abstract

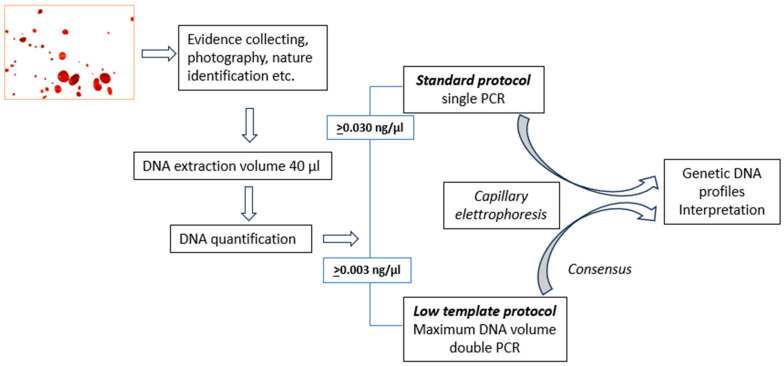
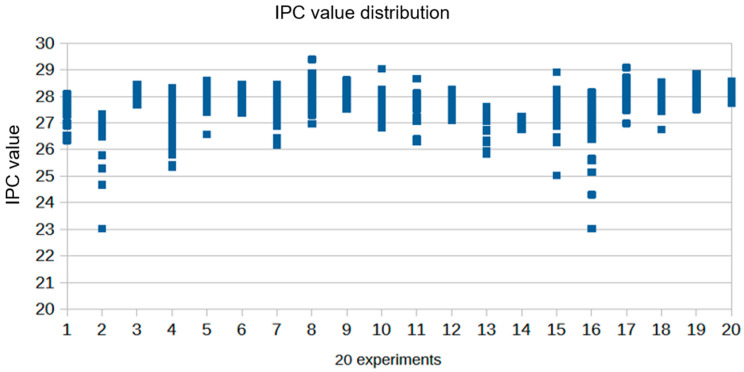
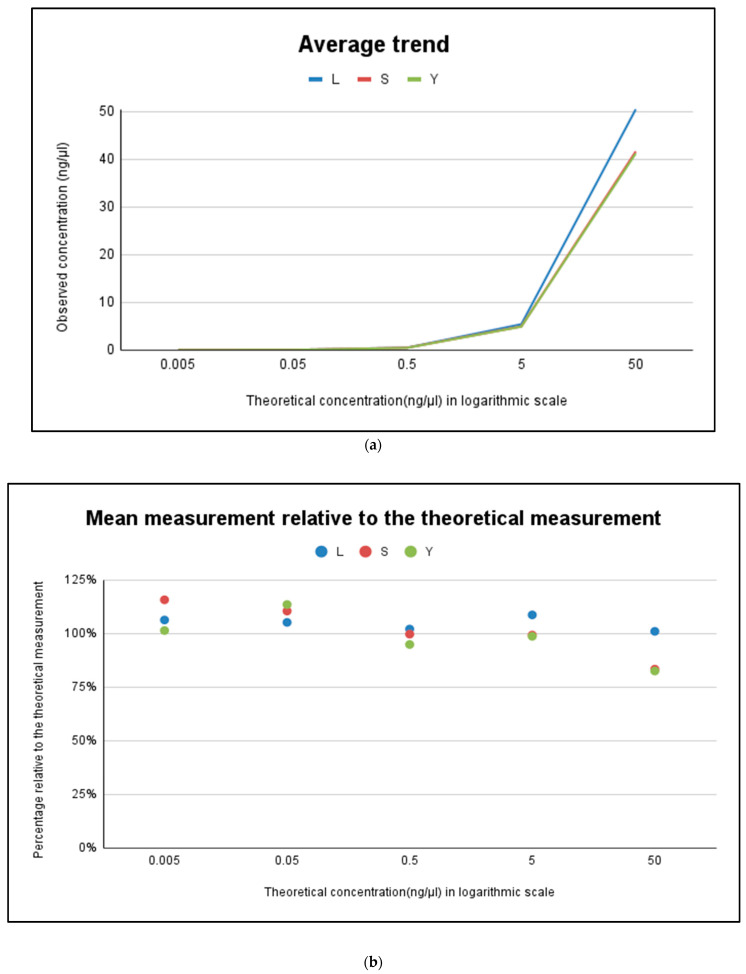
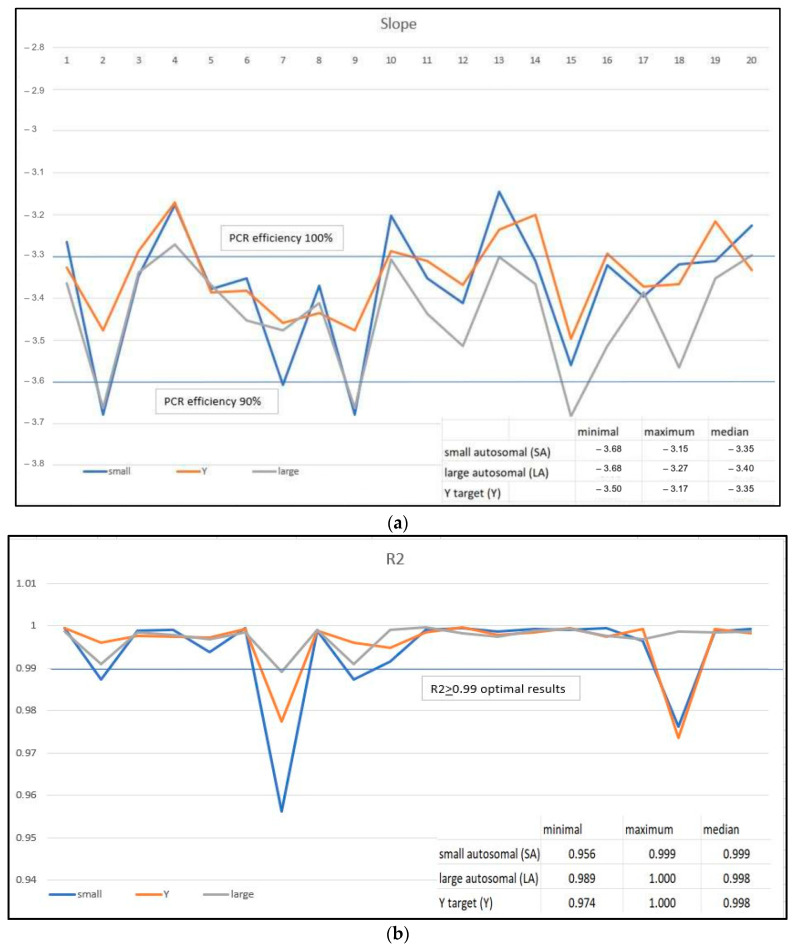
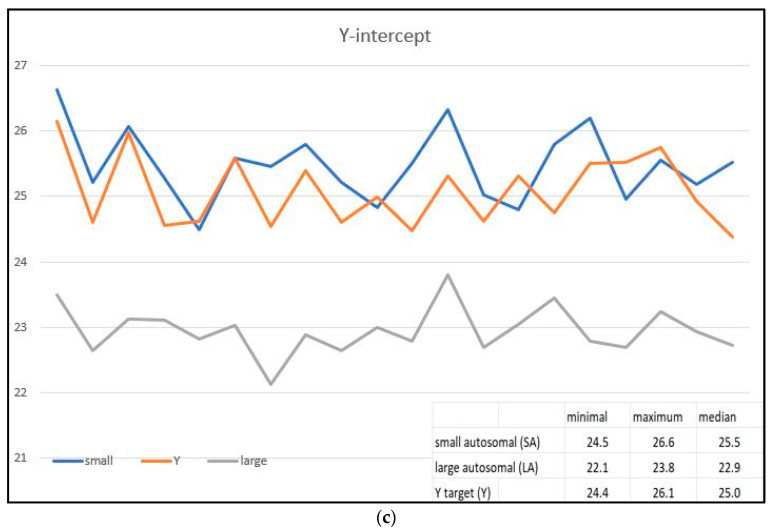
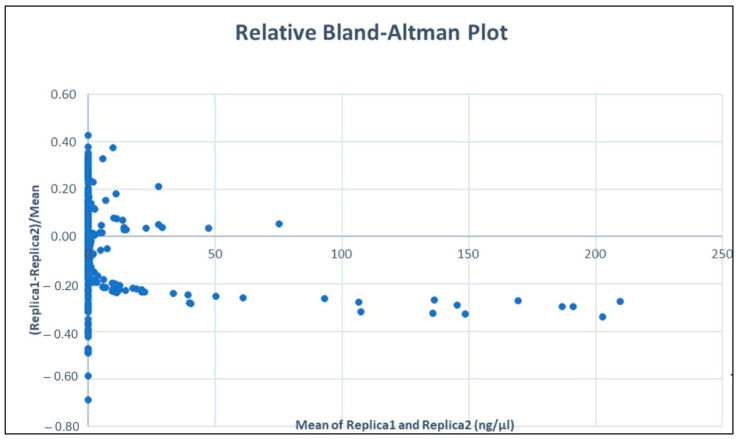
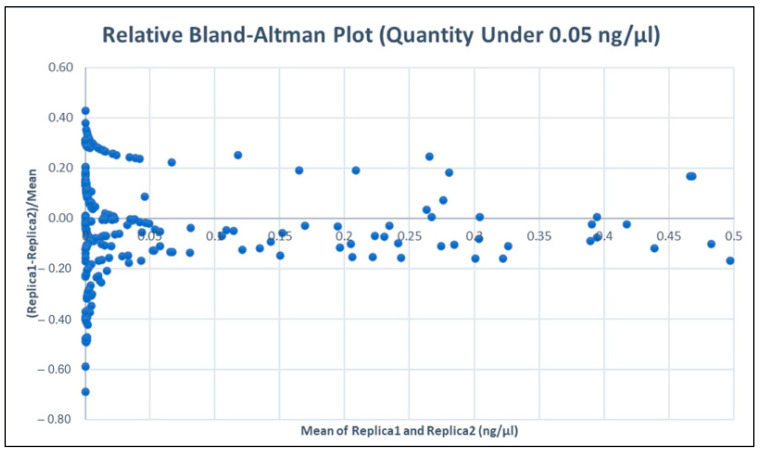
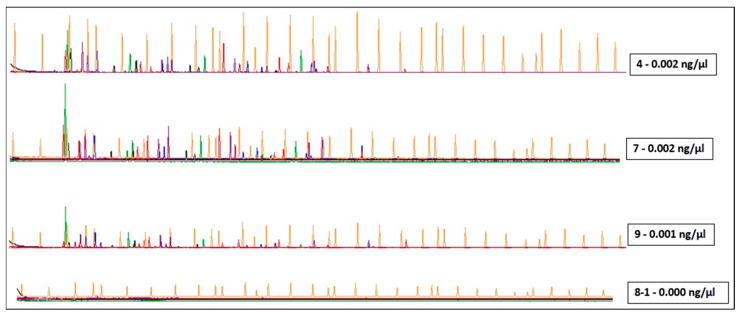
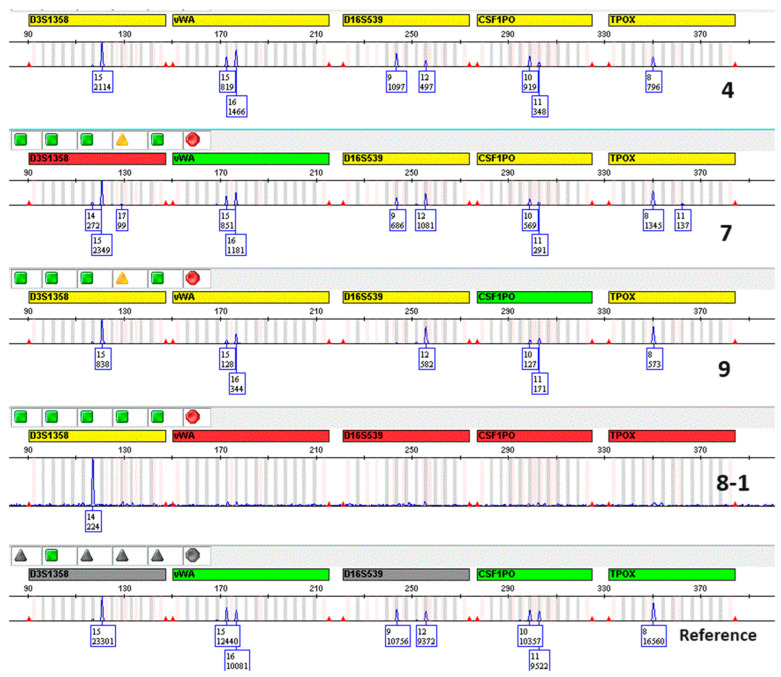
The quantification of human DNA extracts from forensic samples plays a key role in the forensic genetics process, ensuring maximum efficiency and avoiding repeated analyses, over-amplified samples, or unnecessary examinations. In our laboratory, we use the Quantifiler® Trio system to quantify DNA extracts from a wide range of samples extracted from traces (bloodstains, saliva, semen, tissues, etc.), including swabs from touched objects, which are very numerous in the forensic context. This method has been extensively used continuously for nine years, following an initial validation process, and is part of the ISO/IEC 17025 accredited method. In routine practice, based on the quantitative values determined from the extracts of each trace, we use a standard method or a low-copy-number method that involves repeating the amplification with the generation of a consensus genetic profile. Nowadays, when the quantification results are less than 0.003 ng/μL in the minimum extraction volume (40 μL), we do not proceed with the DNA extract analysis. By verifying the limits of the method, we make a conscious cost-benefit choice, in particular by using the least amount of DNA needed to obtain sufficiently robust genetic profiles appropriate for submission to the Italian DNA Forensic Database. In this work, we present a critical re-evaluation of this phase of the method, which is based on the use of standard curves obtained from the average values of the control DNA analysed in duplicate. Considering the various contributions to uncertainty that are difficult to measure, such as manual pipetting or analytical phases carried out by different operators, we have decided to thoroughly investigate the contribution of variability in the preparation of calibration curves to the final results. Thus, 757 samples from 20 independent experiments were re-evaluated using two different standards for the construction of curves, determining the quantitative differences between the two methods. The experiments also determined the parameters of the slope, Y-intercept, R2, and the values of the synthetic control probe to verify how these parameters can provide information on the final outcome of each analysis. The outcome of this revalidation demonstrated that it is preferable to use quantification ranges rather than exact quantitative limits before deciding how to analyse the extracts via PCR or forgoing the determination of profiles. Additionally, we present some preliminary data related to the analysis of samples that would not have been analysed based on the initial validation, from which genetic profiles were obtained after applying a concentration method to the extracts. Our goal is to improve the accredited analytical method, with a careful risk assessment as indicated by accreditation standards, ensuring that no source of evidence is lost in the reconstruction of a criminal event.

Keywords: DNA amplification; DNA quantification; forensic DNA; polymerase chain reaction.


Conflict of interest statement

The authors declare no conflicts of interest.

Figures

Figure 1
Figure 1
Diagrammatic representation of the forensic genetic analysis process used by the Forensic Genetic Unit of AOU Careggi. The method is accredited according to the ISO/IEC 17025 standard by the Italian Accreditation Body, Accredia (Lab nr. 1268) with the denomination “DNA typing for human identification, mixed stains, Y-STR, paternity and kinship testing (genetic profile)”.
Figure 2
Figure 2
IPC value in real experiments on casework samples. Complete inhibition was observed in only 2 out of 757 DNA samples. The synthetic internal PCR control (IPC) template DNA is present at a consistent concentration across all reactions on a plate. Therefore, the IPC Ct should be relatively constant in typical reactions if PCR inhibitors and/or higher concentrations of DNA are not present in the extract. The use of the IPC system helps us distinguish between true negative sample results and reactions affected by the presence of PCR inhibitors, the assay setup, or a chemistry or instrument failure.
Figure 3
Figure 3
(a) Linearity for the standard curve for the Quantifiler™ HP and Trio Kit is from 5 pg/μL to 100 ng/μL as declared by the manufacturer. Correlation between expected and observed quantification of DNA control. (b) Percentage correlation between expected and observed quantification of DNA control. Each point on the graph was obtained from the average quantification value of the five points used for constructing the standard curve in a typical quantification reaction (50, 5, 0.5, 0.05, and 0.005 ng/µL) measured in quintuplicate. Linearity for the standard curve for the Quantifiler™ HP and Trio Kit is from 5 pg/μL to 100 ng/μL as declared by the manufacturer.
Figure 4
Figure 4
(a) The standard curve is a graph of the Ct of quantification standard reactions plotted against the starting quantity of the standards. The software calculates the regression line by calculating the best fit with the quantification standard data points. The regression line formula has the form Ct = m [log (Qty)] + b, where m is the slope, b is the Y–intercept, and Qty is the starting DNA quantity. The slope indicates the PCR amplification efficiency for the assay. A slope of 3.3 indicates 100% amplification efficiency. The figure shows the slopes determined in twenty different experiments. (b) R2 value—measure of the closeness of fit between the standard curve regression line and the individual Ct data points of quantification standard reactions. A value of 1.00 indicates a perfect fit between the regression line and the data points. The figure shows the R2 observed in twenty different experiments. (c) The Y–intercept indicates the expected Ct value for a sample with Qty = 1 (for example, 1 ng/μL). The figure shows the Y-intercept results in twenty different experiments for small, Y, and large probes.
Figure 4
Figure 4
(a) The standard curve is a graph of the Ct of quantification standard reactions plotted against the starting quantity of the standards. The software calculates the regression line by calculating the best fit with the quantification standard data points. The regression line formula has the form Ct = m [log (Qty)] + b, where m is the slope, b is the Y–intercept, and Qty is the starting DNA quantity. The slope indicates the PCR amplification efficiency for the assay. A slope of 3.3 indicates 100% amplification efficiency. The figure shows the slopes determined in twenty different experiments. (b) R2 value—measure of the closeness of fit between the standard curve regression line and the individual Ct data points of quantification standard reactions. A value of 1.00 indicates a perfect fit between the regression line and the data points. The figure shows the R2 observed in twenty different experiments. (c) The Y–intercept indicates the expected Ct value for a sample with Qty = 1 (for example, 1 ng/μL). The figure shows the Y-intercept results in twenty different experiments for small, Y, and large probes.
Figure 5
Figure 5
The relative Bland–Altman plot. The mean of the relatives’ differences is (–0.02 ± 0.02).
Figure 6
Figure 6
The relative Bland–Altman plot for quantity values lower than 0.05 ng/μL. The mean of the relative difference for these values is 0.02 with a confidence interval of 0.02.
Figure 7
Figure 7
The Figure shows raw data amplification results obtained by using DNA samples from casework obtained from subungual grooves from a known individual. Each sample was obtained by rubbing a swab into the subungual sulcus. 4 = left ring finger; 7 = right index finger; 8-1 = medium right; 9 = right ring finger. The concentration indicated in the boxes for each sample was that before the concentration phase.
Figure 8
Figure 8
Amplification results using Globalfiler™ PCR Amplification kit. The figure shows the electropherograms for the same samples as in Figure 7, compared to the reference DNA from a saliva sample of the donor (only the blue channel is shown). Although some “drop-in” and “drop-out” phenomena were observed in some loci, the donor’s genetic profile is evident for almost all DNA markers.

References

    1. Butler J.M. Advanced Topics in Forensic DNA Typing: Methodology. Elsevier Science; Amsterdam, The Netherlands: 2014.
    1. McDonald C., Taylor D., Linacre A. PCR in Forensic Science: A Critical Review. Genes. 2024;15:438. doi: 10.3390/genes15040438. - DOI - PMC - PubMed
    1. Bär W., Brinkmann B., Lincoln P., Mayr W., Rossi U., Budowle B., Eisenberg A., Fourney R., Gill P., Rand S. Editorial: Recommendations of the DNA Commission of the International Society for Forensic Haemogenetics relating to the use of PCR-based polymorphisms. Forensic Sci. Int. 1992;55:1–3. - PubMed
    1. Siuta J., Dobosz A., Kawecki J., Dobosz T. DNA Content of Various Fluids and Tissues of the Human Body. Genes. 2023;15:17. doi: 10.3390/genes15010017. - DOI - PMC - PubMed
    1. Nicklas J.A., Buel E. Quantification of DNA in forensic samples. Anal. Bioanal. Chem. 2003;376:1160–1167. doi: 10.1007/s00216-003-1924-z. - DOI - PubMed

MeSH terms

LinkOut - more resources