. 2024 Jun 12;15(6):770.
doi: 10.3390/genes15060770.

A Subset of Microsatellite Unstable Cancer Genomes Prone to Short Insertions over Deletions Is Associated with Elevated Anticancer Immunity

Affiliations

A Subset of Microsatellite Unstable Cancer Genomes Prone to Short Insertions over Deletions Is Associated with Elevated Anticancer Immunity

Sunmin Kim et al. Genes (Basel). .

Abstract

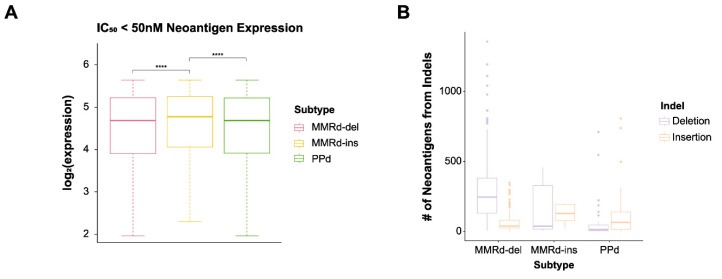
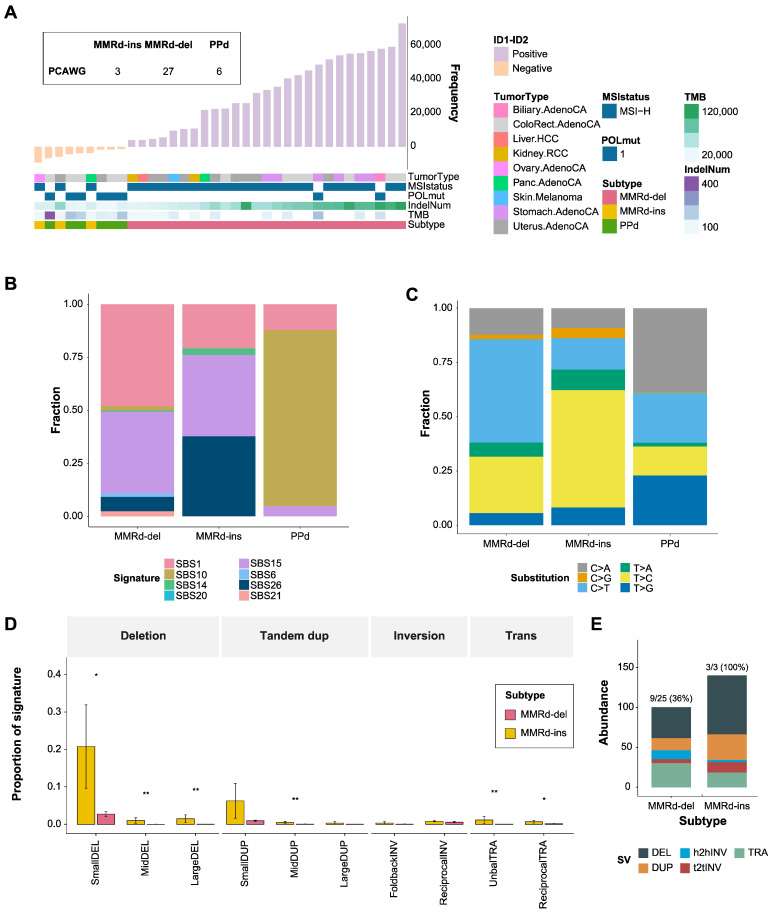
Deficiencies in DNA mismatch repair (MMRd) leave characteristic footprints of microsatellite instability (MSI) in cancer genomes. We used data from the Cancer Genome Atlas and International Cancer Genome Consortium to conduct a comprehensive analysis of MSI-associated cancers, focusing on indel mutational signatures. We classified MSI-high genomes into two subtypes based on their indel profiles: deletion-dominant (MMRd-del) and insertion-dominant (MMRd-ins). Compared with MMRd-del genomes, MMRd-ins genomes exhibit distinct mutational and transcriptomic features, including a higher prevalence of T>C substitutions and related mutation signatures. Short insertions and deletions in MMRd-ins and MMRd-del genomes target different sets of genes, resulting in distinct indel profiles between the two subtypes. In addition, indels in the MMRd-ins genomes are enriched with subclonal alterations that provide clues about a distinct evolutionary relationship between the MMRd-ins and MMRd-del genomes. Notably, the transcriptome analysis indicated that MMRd-ins cancers upregulate immune-related genes, show a high level of immune cell infiltration, and display an elevated neoantigen burden. The genomic and transcriptomic distinctions between the two types of MMRd genomes highlight the heterogeneity of genetic mechanisms and resulting genomic footprints and transcriptomic changes in cancers, which has potential clinical implications.

Keywords: DNA repair; anticancer immunity; indel; microsatellite instability; mutational signature.


Conflict of interest statement

The authors declare no conflict of interest.

Figures

Figure 1
Figure 1
Distinct indel (ID) signatures and classification of subtypes. (A) Analysis workflow of subtype classification: A total of 119 and 221 individuals with an indel abundance greater than 10 were selected from the TCGA CRC and UCEC datasets, respectively. They were classified as deletion- or insertion-dominant indel signatures according to the frequency of ID1 and ID2, and 23 individuals with no frequency were filtered out. In that way, three subtypes were classified based on MSI-H status and the presence of POLE/POLD1 mutations, excluding microsatellite stable genomes. (B) The top bar plot represents the indel frequency sorted by the difference in abundance between ID1 and ID2. The bottom bar represents the clinical information. (C) The tumor mutation and indel burden in each subtype: In MMRd-ins, both the tumor mutation and indel burdens were observed to be at intermediate levels in all three subtypes. * p < 0.05; ** p < 0.01; **** p < 0.0001. (D,E) Distribution of subtypes in both CRC and UCEC.
Figure 2
Figure 2
Distinct single base substitution (SBS) signatures across three subtypes. (A) Proportion of SBS signatures associated with MMRd and PPd. PPd has the highest proportion of SBS10 (brown), whereas MMRd-ins and MMRd-del are generally similar, with differences in the proportions of SBS1 (pink) and SBS26 (navy). (B) Mutational signature of each subtype. The x-axis represents the features of each nucleotide substitution, and the y-axis represents the proportions of the features.
Figure 3
Figure 3
Landscape of target indels and MMR genes. Difference in somatic truncated indel profiles between the MMRd-ins and MMRd-del subtypes in (A) CRC and (B) UCEC: Target genes were selected based on a p-value < 0.05 in Fisher’s exact test. The bar plot in the middle represents the ratio of ID1 and ID2 in each sample. A heatmap of MLH1 gene methylation and the expression of six MMR genes are displayed at the bottom. (C) Hazard ratios (HRs) of MMRd-ins target genes in both CRC and UCEC: The horizontal lines represent the 95% confidence intervals, and the square dots represent HR estimates. The red dashed line represents the reference value. ARID1A is identified as a significant gene in MMRd-del, with an HR value indicating 0. (D) MLH1 gene methylation and expression in the three subtypes (E) Hypomethylation of the DDR-related ALKBH3 gene in the MMRd-ins subtype; * p < 0.05; ** p < 0.01; *** p < 0.001; **** p < 0.0001.
Figure 4
Figure 4
Differentially expressed genes (DEGs) and pathways between MMRd-del and MMRd-ins. (A) Volcano plot of DEGs between MMRd-ins and MMRd-del: The dashed lines represent the thresholds for the fold change (log2 fold change > 1) and p-value (<0.05). (B) Gene set enrichment analysis (GSEA) showing the top-ranked Hallmark pathways significantly altered (FDR < 0.05) in MMRd-ins versus MMRd-del. A positive normalized enrichment score (NES, orange) indicates enrichment in MMRd-ins, and a negative NES (pink) indicates enrichment in MMRd-del. (C) Immune scores from ESTIMATE in CRC and (D) UCEC: When compared with ANOVA, the p-values were 0.00518 and 0.298 for CRC and UCEC, respectively.
Figure 5
Figure 5
The number of neoantigens with strong HLA affinity. (A) High affinity (IC50 < 50 nM) neoantigens have high expression levels in MMRd-ins. t-test; **** p < 0.0001. (B) The number of neoantigens from indels. Neoantigens derived from deletions are most abundant in the MMRd-del subtype, whereas those from insertions are most abundant in the MMRd-ins subtype. Because the PPd subtype has fewer indels than the MMRd subtypes, its neoantigen abundance is the lowest. (C) Genes associated with IC50 < 50 nM neoantigens in more than 40% of MMRd-ins genomes. The PPd subtype has a ratio similar to that of the MMRd-ins subtype, whereas the MMRd-del subtype has a very low ratio. (D) The expression of six genes with high frequencies in the MMRd-ins subtype.
Figure 5
Figure 5
The number of neoantigens with strong HLA affinity. (A) High affinity (IC50 < 50 nM) neoantigens have high expression levels in MMRd-ins. t-test; **** p < 0.0001. (B) The number of neoantigens from indels. Neoantigens derived from deletions are most abundant in the MMRd-del subtype, whereas those from insertions are most abundant in the MMRd-ins subtype. Because the PPd subtype has fewer indels than the MMRd subtypes, its neoantigen abundance is the lowest. (C) Genes associated with IC50 < 50 nM neoantigens in more than 40% of MMRd-ins genomes. The PPd subtype has a ratio similar to that of the MMRd-ins subtype, whereas the MMRd-del subtype has a very low ratio. (D) The expression of six genes with high frequencies in the MMRd-ins subtype.
Figure 6
Figure 6
Validation of indel and SBS signatures using PCAWG data. (A) The top bar plot represents the indel frequency sorted by the difference in abundance between ID1 and ID2. Two samples with deletion-dominant POLE status were classified as MMRd-del. (B) The proportion of SBS signatures associated with MMRd and PPd. PPd has the highest proportion of SBS10 (brown), whereas MMRd-ins and MMRd-del are generally similar, with differences in the proportions of SBS1 (pink) and SBS26 (navy). (C) Ratio of single base substitutions in each subtype. PPd showed a difference in the C>A (gray) substitution rate, corresponding to SBS10, as compared with MMRd; and MMRd-ins exhibited differences in C>T (light blue) and T>C (dark blue) substitutions compared with MMRd-del. (D) Frequency of structural variant signatures in each subtype. Compared with the other subtypes, MMRd-ins showed a significantly higher frequency of small deletions and duplications. Wilcoxon test; * p < 0.05; ** p < 0.01. (E) The number of neoantigens from structural variants in MMRd-del and MMRd-ins.

Similar articles

References

    1. Chung J., Maruvka Y.E., Sudhaman S., Kelly J., Haradhvala N.J., Bianchi V., Edwards M., Forster V.J., Nunes N.M., Galati M.A., et al. DNA Polymerase and Mismatch Repair Exert Distinct Microsatellite Instability Signatures in Normal and Malignant Human Cells. Cancer Discov. 2021;11:1176–1191. doi: 10.1158/2159-8290.Cd-20-0790. - DOI - PMC - PubMed
    1. Lower S.S., McGurk M.P., Clark A.G., Barbash D.A. Satellite DNA evolution: Old ideas, new approaches. Curr. Opin. Genet. Dev. 2018;49:70–78. doi: 10.1016/j.gde.2018.03.003. - DOI - PMC - PubMed
    1. Ionov Y., Peinado M.A., Malkhosyan S., Shibata D., Perucho M. Ubiquitous somatic mutations in simple repeated sequences reveal a new mechanism for colonic carcinogenesis. Nature. 1993;363:558–561. doi: 10.1038/363558a0. - DOI - PubMed
    1. Thibodeau S.N., Bren G., Schaid D. Microsatellite Instability in Cancer of the Proximal Colon. Science. 1993;260:816–819. doi: 10.1126/science.8484122. - DOI - PubMed
    1. Blake C., Tsao J.L., Wu A., Shibata D. Stepwise deletions of polyA sequences in mismatch repair-deficient colorectal cancers. Am. J. Pathol. 2001;158:1867–1870. doi: 10.1016/s0002-9440(10)64143-0. - DOI - PMC - PubMed