. 2024 Jun 15;16(12):2229.
doi: 10.3390/cancers16122229.

Enhancing Early Lung Cancer Diagnosis: Predicting Lung Nodule Progression in Follow-Up Low-Dose CT Scan with Deep Generative Model

Affiliations

Enhancing Early Lung Cancer Diagnosis: Predicting Lung Nodule Progression in Follow-Up Low-Dose CT Scan with Deep Generative Model

Yifan Wang et al. Cancers (Basel). .

Abstract

Early diagnosis of lung cancer can significantly improve patient outcomes. We developed a Growth Predictive model based on the Wasserstein Generative Adversarial Network framework (GP-WGAN) to predict the nodule growth patterns in the follow-up LDCT scans. The GP-WGAN was trained with a training set (N = 776) containing 1121 pairs of nodule images with about 1-year intervals and deployed to an independent test set of 450 nodules on baseline LDCT scans to predict nodule images (GP-nodules) in their 1-year follow-up scans. The 450 GP-nodules were finally classified as malignant or benign by a lung cancer risk prediction (LCRP) model, achieving a test AUC of 0.827 ± 0.028, which was comparable to the AUC of 0.862 ± 0.028 achieved by the same LCRP model classifying real follow-up nodule images (p = 0.071). The net reclassification index yielded consistent outcomes (NRI = 0.04; p = 0.62). Other baseline methods, including Lung-RADS and the Brock model, achieved significantly lower performance (p < 0.05). The results demonstrated that the GP-nodules predicted by our GP-WGAN model achieved comparable performance with the nodules in the real follow-up scans for lung cancer diagnosis, indicating the potential to detect lung cancer earlier when coupled with accelerated clinical management versus the current approach of waiting until the next screening exam.

Keywords: deep learning; early diagnosis; generative AI; lung cancer; nodule growth prediction.


Conflict of interest statement

The authors declare no conflicts of interest.

Figures

Figure A1
Figure A1
The network structure of the predictor. The numbers on the left of each layer (rectangle) represent the width and height of the tensors, and the numbers on the top of the rectangles represent the number of convolution filters (channels) for the tensors.
Figure A2
Figure A2
The network structure of the discriminator. The numbers on the left of each layer (rectangle) represent the width and height of the tensors, and the numbers on the top of the rectangles represent the number of convolution filters (channels) for the tensors.
Figure A3
Figure A3
A schematic of the feature extraction model. The arrows indicate the information flow, the Conv-xx denotes a combination of a convolution layer, batch normalization, and ReLU activation layer with XX channels, the Pooling represents an average pooling layer, and the F-C represents a fully connected layer with 32 neurons (units).
Figure A4
Figure A4
Examples of malignant nodules: two were fast-growing (top and middle rows) and one was slow-growing (bottom). The small training data with the wide range of nodule growth patterns might have limited the capability of the GP-WGAN model in learning growth prediction effectively.
Figure 1
Figure 1
The adversarial framework for training the GP-WGAN model.
Figure 2
Figure 2
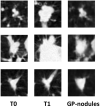
Examples of three benign (left) and three malignant (right) lung nodules from 6 subjects on baseline (T0) and 1-year follow-up (T1) LDCT scans. Each row presents an example nodule. For each nodule, the 1st column shows the ROI image of the nodule at T0, 2nd column shows its follow-up image at T1, and the 3rd column shows the GP-nodules generated from the T0 nodule shown in the 1st column by the GP-WGAN model. (Left): the benign nodules in T0, T1, and their predicted GP-nodules showed stability in size, attenuation, and smooth margins. (Right): the malignant nodules showed a trend of enlarged sizes in T1 and GP-nodules.
Figure 3
Figure 3
Test ROC curves of malignancy risk prediction by the LCRP model for classification of nodules generated by GP-WGAN (green line, AUC = 0.827 ± 0.028), real nodules from baseline (red line, AUC = 0.805 ± 0.031) and from 1-year follow-up LDCT scans (light-sky blue line, AUC = 0.862 ± 0.028). The Brock model was used to classify baseline nodules (black line, AUC = 0.754 ± 0.035) for comparison.

References

    1. Cancer Stat Facts: Lung and Bronchus Cancer. [(accessed on 1 September 2022)]; Available online: https://seer.cancer.gov/statfacts/html/lungb.html.
    1. Howlader N., Noone A.M., Krapcho M., Miller D., Brest A., Yu M., Ruhl J., Tatalovich Z., Mariotto A., Lewis D.R., et al. SEER Cancer Statistics Review, 1975–2018. [(accessed on 1 September 2022)]; Available online: https://seer.cancer.gov/archive/csr/1975_2018/index.html.
    1. Aberle D.R., Adams A.M., Berg C.D., Black W.C., Clapp J.D., Fagerstrom R.M., Gareen I.F., Gatsonis C., Marcus P.M., Sicks J.D. Reduced lung-cancer mortality with low-dose computed tomographic screening. N. Engl. J. Med. 2011;365:395–409. doi: 10.1056/NEJMoa1102873. - DOI - PMC - PubMed
    1. McKee B.J., Regis S.M., McKee A.B., Flacke S., Wald C. Performance of ACR Lung-RADS in a clinical CT lung screening program. J. Am. Coll. Radiol. 2016;13:R25–R29. doi: 10.1016/j.jacr.2015.12.009. - DOI - PubMed
    1. Tao G., Zhu L., Chen Q., Yin L., Li Y., Yang J., Ni B., Zhang Z., Koo C.W., Patil P.D. Prediction of future imagery of lung nodule as growth modeling with follow-up computed tomography scans using deep learning: A retrospective cohort study. Transl. Lung Cancer Res. 2022;11:250. doi: 10.21037/tlcr-22-59. - DOI - PMC - PubMed

LinkOut - more resources