. 2024 Jun 10;25(12):6398.
doi: 10.3390/ijms25126398.

JNK Signaling Positively Regulates Acute Ethanol Tolerance in C. elegans

Affiliations

JNK Signaling Positively Regulates Acute Ethanol Tolerance in C. elegans

Changhoon Jee et al. Int J Mol Sci. .

Abstract

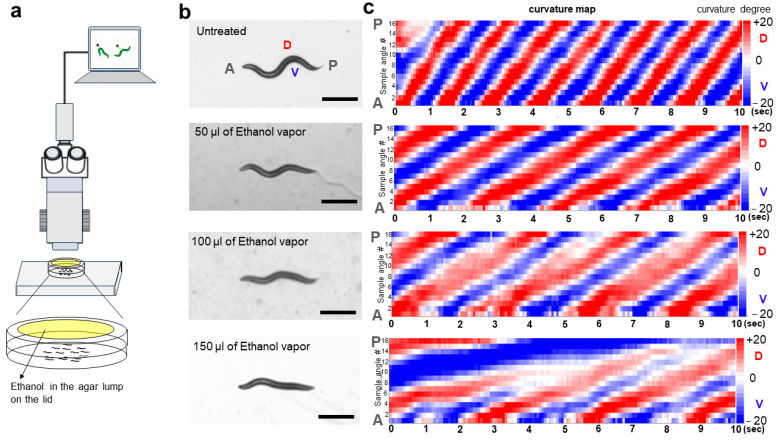
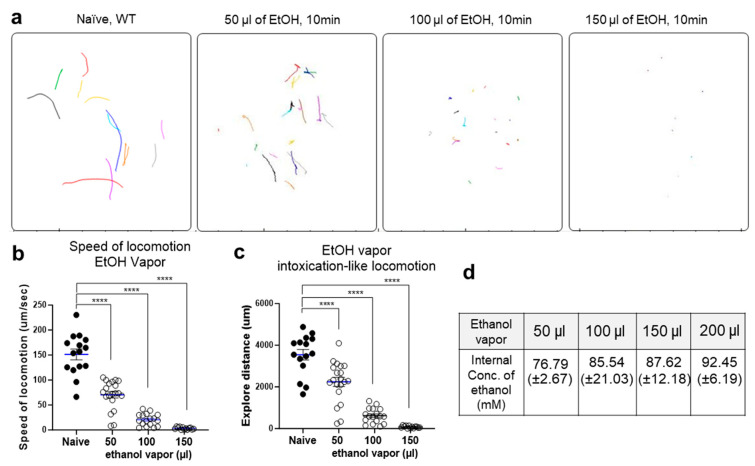
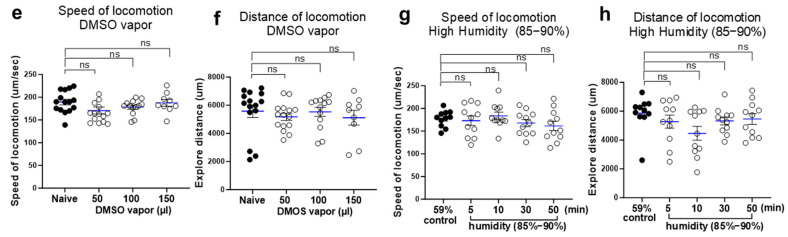
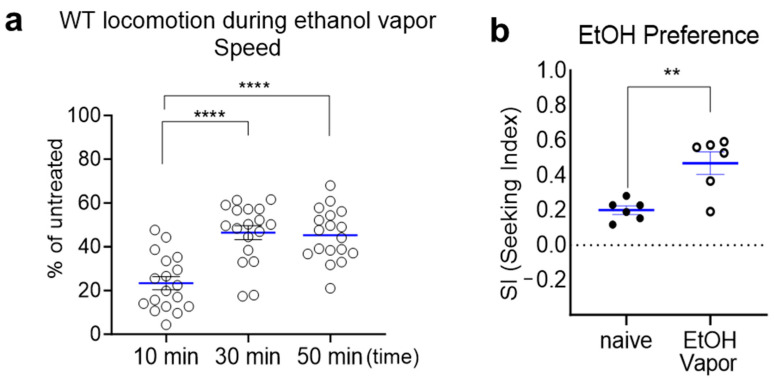
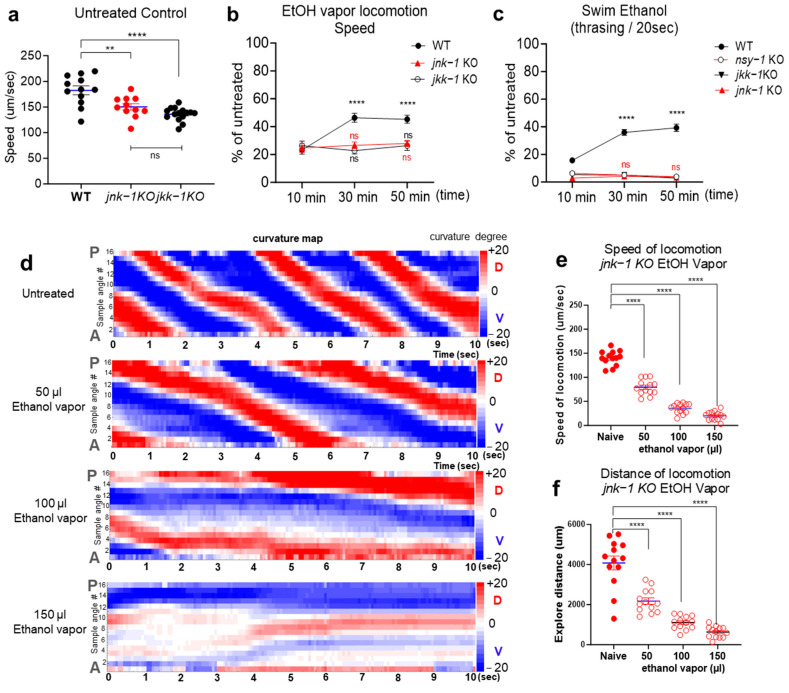
Alcohol use disorder (AUD) is a chronic neurobehavioral condition characterized by a cycle of tolerance development, increased consumption, and reinstated craving and seeking behaviors during withdrawal. Understanding the intricate mechanisms of AUD necessitates reliable animal models reflecting its key features. Caenorhabditis elegans (C. elegans), with its conserved nervous system and genetic tractability, has emerged as a valuable model organism to study AUD. Here, we employ an ethanol vapor exposure model in Caenorhabditis elegans, recapitulating AUD features while maintaining high-throughput scalability. We demonstrate that ethanol vapor exposure induces intoxication-like behaviors, acute tolerance, and ethanol preference, akin to mammalian AUD traits. Leveraging this model, we elucidate the conserved role of c-jun N-terminal kinase (JNK) signaling in mediating acute ethanol tolerance. Mutants lacking JNK signaling components exhibit impaired tolerance development, highlighting JNK's positive regulation. Furthermore, we detect ethanol-induced JNK activation in C. elegans. Our findings underscore the utility of C. elegans with ethanol vapor exposure for studying AUD and offer novel insights into the molecular mechanisms underlying acute ethanol tolerance through JNK signaling.

Keywords: C. elegans; JNK; ethanol tolerance; ethanol vapor; locomotion.


Conflict of interest statement

The authors declare no conflicts of interest.

Figures

Figure 1
Figure 1
Behavioral response of wild-type C. elegans to ethanol vapor. (a) Schematic representation of ethanol vapor exposure setup for C. elegans. (b) Ethanol vapor-induced alterations in amplitude of body bends. Scale bar, 500 μm. (c) Example curvature map representing locomotion of worm moving forward under different concentrations of ethanol vapor. Red (top of scale) represents 20-degree angle and blue (bottom of scale) represents minus 20-degree angle. A, anterior of worms; P, posterior of worms; D, dorsal side of worms; V, ventral side of worms; sample angles, angles along worm’s centerline.
Figure 2
Figure 2
Intoxication-like locomotion of wild-type C. elegans after exposure to ethanol vapor. 50 µL, 100 µL, or 150 µL of ethanol was vaporized for 10 min, and similar behavioral effects indicative of intoxication were observed in a dosage-dependent manner. (a) The trajectory of individual naïve worms and those exposed to 50 µL, 100 µL, or 150 µL of ethanol vapor was analyzed. Worms exposed to ethanol vapor for 10 min were assessed for speed (b) and exploration distance (c). A one-way ANOVA comparison revealed significant differences in both speed [F(3, 61) = 94.25, p < 0.0001] and exploration distance [F(3, 65) = 64.21, p < 0.0001]. Significant post hoc differences (Dunnett’s test) between naïve and ethanol vapor-exposed WT animals across multiple concentrations are denoted (p < 0.0001, ****). The values are mean ± SEM. (d) The internal concentration of ethanol (mM) during 10 min of ethanol vaporization. (e,f) 50 µL, 100 µL, or 150 µL of DMSO was vaporized for 10 min. N ≥ 9 in each group. (e) Speed against DMSO vapor [F(3, 48) = 1.840, ns, p = 0.1526]; non-significant post hoc differences (Dunnett’s test) between naïve and DMSO vapor-exposed worms. (f) Exploration distance against DMSO vapor [F(3, 48) = 0.3790, ns, p = 0.7685]; non-significant post hoc differences (Dunnett’s test) between naïve and DMSO vapor-exposed worms. (g,h) WT animals were exposed to a higher humidity (85–90%) compared to room-ambient humidity (59%). N = 11 in each group. (g) Speed [F(4, 50) = 0.9789, ns, p = 0.4276]; non-significant post hoc differences (Dunnett’s test) between 59% and higher humidity. (h) Exploration [F(4, 50) = 1.691, ns, p = 0.1668]; non-significant post hoc differences (Dunnett’s test) between 59% and higher humidity. The black solid-colored circle represents the control group (mean ± SEM) to which the mean of each column (open-circle) was compared using Dunnett’s post hoc multiple comparison test. The blue line shows the mean and standard error of the mean (SEM).
Figure 2
Figure 2
Intoxication-like locomotion of wild-type C. elegans after exposure to ethanol vapor. 50 µL, 100 µL, or 150 µL of ethanol was vaporized for 10 min, and similar behavioral effects indicative of intoxication were observed in a dosage-dependent manner. (a) The trajectory of individual naïve worms and those exposed to 50 µL, 100 µL, or 150 µL of ethanol vapor was analyzed. Worms exposed to ethanol vapor for 10 min were assessed for speed (b) and exploration distance (c). A one-way ANOVA comparison revealed significant differences in both speed [F(3, 61) = 94.25, p < 0.0001] and exploration distance [F(3, 65) = 64.21, p < 0.0001]. Significant post hoc differences (Dunnett’s test) between naïve and ethanol vapor-exposed WT animals across multiple concentrations are denoted (p < 0.0001, ****). The values are mean ± SEM. (d) The internal concentration of ethanol (mM) during 10 min of ethanol vaporization. (e,f) 50 µL, 100 µL, or 150 µL of DMSO was vaporized for 10 min. N ≥ 9 in each group. (e) Speed against DMSO vapor [F(3, 48) = 1.840, ns, p = 0.1526]; non-significant post hoc differences (Dunnett’s test) between naïve and DMSO vapor-exposed worms. (f) Exploration distance against DMSO vapor [F(3, 48) = 0.3790, ns, p = 0.7685]; non-significant post hoc differences (Dunnett’s test) between naïve and DMSO vapor-exposed worms. (g,h) WT animals were exposed to a higher humidity (85–90%) compared to room-ambient humidity (59%). N = 11 in each group. (g) Speed [F(4, 50) = 0.9789, ns, p = 0.4276]; non-significant post hoc differences (Dunnett’s test) between 59% and higher humidity. (h) Exploration [F(4, 50) = 1.691, ns, p = 0.1668]; non-significant post hoc differences (Dunnett’s test) between 59% and higher humidity. The black solid-colored circle represents the control group (mean ± SEM) to which the mean of each column (open-circle) was compared using Dunnett’s post hoc multiple comparison test. The blue line shows the mean and standard error of the mean (SEM).
Figure 3
Figure 3
Prolonged exposure to ethanol vapor induces acute tolerance and ethanol-seeking behavior in C. elegans. (a) Development of acute tolerance to ethanol-induced depression of locomotion. Wild-type C. elegans were exposed to ethanol vapor for varying durations (10, 30, or 50 min). Locomotion behavior was assessed after each exposure period. One-way ANOVA revealed significant differences in locomotion depression across different time points (p < 0.0001, F(2, 51) = 19). Post hoc Tukey’s multiple comparison test indicated significant differences in locomotion between 10 min and 30 min exposure groups (****, p < 0.0001) as well as between 10 min and 50 min exposure groups (****, p < 0.0001). (b) Development of ethanol preference through prolonged ethanol vapor exposure. Wild-type C. elegans were exposed to ethanol vapor for 4 h, and chemotaxis to ethanol was assessed subsequently. Significant difference was observed by using Mann–Whitney test (**, p < 0.01). Values are represented as mean ± SEM (blue line). The open circle represents ethanol vapored groups.
Figure 4
Figure 4
JNK signaling facilitates the development of ethanol tolerance. (a) The control speed of naive animals. A one-way ANOVA (p < 0.0001, F(2, 35) = 15.89) revealed a slight reduction in locomotion speed compared to wild-type animals; however, mutations in jnk-1(gv7) and jkk-1(km2) do not impair the overall ability of locomotion. A post hoc Tukey’s multiple comparison test showed significant differences in locomotion between WT and jnk-1(gv7) animals (red, **, p < 0.01) and between WT and jkk-1(km2) animals (****, p < 0.0001). (b) The development of ethanol tolerance through prolonged ethanol vapor (100 µL). A two-way ANOVA comparison shows the impaired development in jnk-1(gv7) and jkk-1(km2) animals [FGenotype(2, 186) = 17.17, p < 0.0001; Ftime(2, 186) = 7.172, p < 0.001; FGenotype x time(4, 186) = 6.259, p < 0.0001]. A significant post hoc differences Tukey’s multiple comparison between the 10 min and 30 min/50 min in each genotype [p < 0.0001, **** for WT; p > 0.05, ns for jnk-1(gv7) and jkk-1(km2)]. The values are mean ± SEM. N ≥ 18 in each genotype across all time points. (c) The development of ethanol tolerance during swimming in liquid environments containing ethanol (400 mM M9). A two-way ANOVA comparison shows the impaired development in nsy-1(ok593), jnk-1(gv7), and jkk-1(km2) animals [FGenotype(3, 336) = 265.7, p < 0.0001; Ftime(2, 336) = 16.16, p < 0.001; FGenotype x time(6, 336) = 23.33, p < 0.0001]. A significant post hoc differences Tukey’s multiple comparison between the 10 min and 30 min/50 min in each genotype [p < 0.0001, **** for WT; p > 0.05, ns for nsy-1(ok593), jnk-1(gv7), and jkk-1(km2)]. The values are mean ± SEM. N ≥ 26 in each genotype across all time points. (d) An example curvature map representing the locomotion of a jnk-1(gv7) worm moving forward under different concentrations of ethanol vapor. Red (top of the scale) represents a 20-degree angle and blue (bottom of the scale) represents a minus 20-degree angle. A, anterior of worms; P, posterior of worms; D, dorsal side of worms; V, ventral side of worms; sample angles, angles along the worm’s centerline. (e,f) jnk-1(gv7) animals exposed to ethanol vapor for 10 min were assessed for speed (e) and exploration distance (f). The solid-colored circle represents the control group (mean ± SEM) to which the mean of each column (open-circle) was compared using Dunnett’s post hoc multiple comparison test. A one-way ANOVA comparison revealed significant differences in both speed [F(3, 48) = 220.4, p < 0.0001] (e) and exploration distance [F(3, 48) = 59.08, p < 0.0001] (f). A significant post hoc difference test (Dunnett’s test) between naïve and ethanol vapor-exposed WT animals across multiple concentrations are denoted (p < 0.0001, ****). The values are mean ± SEM (blue line). N = 13 in each group.
Figure 5
Figure 5
JNK-1 activation in the C. elegans nervous system, primarily in the nerve ring, following exposure to ethanol. (ac). Wild-type C. elegans worms exposed to various stimuli: (a) 400 mM ethanol on a plate, (b) 37 °C heat shock stress, and (c) 400 mM ethanol in M9 buffer. The white arrowheads indicate the distinct expression of activated JNK-1 within the nerve ring. (d) A wild-type C. elegans worm in M9 buffer. The white arrow indicates the location of the nerve ring. The scale bar is 10 µm.

Similar articles

Cited by

References

    1. Pollard M.S., Tucker J.S., Green H.D., Jr. Changes in Adult Alcohol Use and Consequences During the COVID-19 Pandemic in the US. JAMA Netw. Open. 2020;3:e2022942. doi: 10.1001/jamanetworkopen.2020.22942. - DOI - PMC - PubMed
    1. Kaplan H.L., Sellers E.M., Hamilton C., Naranjo C.A., Dorian P. Is there acute tolerance to alcohol at steady state? J. Stud. Alcohol. 1985;46:253–256. doi: 10.15288/jsa.1985.46.253. - DOI - PubMed
    1. Korpi E.R., den Hollander B., Farooq U., Vashchinkina E., Rajkumar R., Nutt D.J., Hyytiä P., Dawe G.S. Mechanisms of Action and Persistent Neuroplasticity by Drugs of Abuse. Pharmacol. Rev. 2015;67:872–1004. doi: 10.1124/pr.115.010967. - DOI - PubMed
    1. Wallace M.J., Newton P.M., Oyasu M., McMahon T., Chou W.-H.H., Connolly J., Messing R.O. Acute functional tolerance to ethanol mediated by protein kinase Cepsilon. Neuropsychopharmacology. 2007;32:127–136. doi: 10.1038/sj.npp.1301059. - DOI - PubMed
    1. Rohsenow D.J., Monti P.M. Does urge to drink predict relapse after treatment? Alcohol. Res. Health. 1999;23:225–232. - PMC - PubMed

MeSH terms

Substances