. 2024 Jun 12;25(12):6475.
doi: 10.3390/ijms25126475.

Impact of Serotonin Deficiency on Circadian Dopaminergic Rhythms

Affiliations

Impact of Serotonin Deficiency on Circadian Dopaminergic Rhythms

Giacomo Maddaloni et al. Int J Mol Sci. .

Abstract

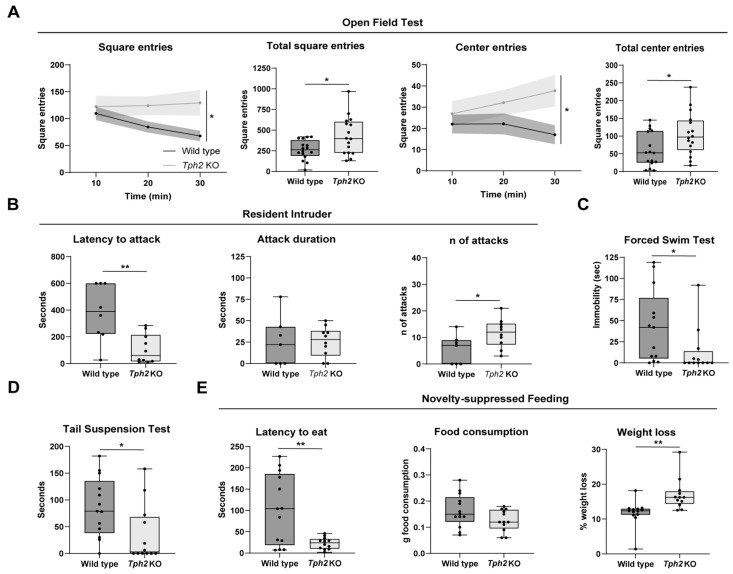
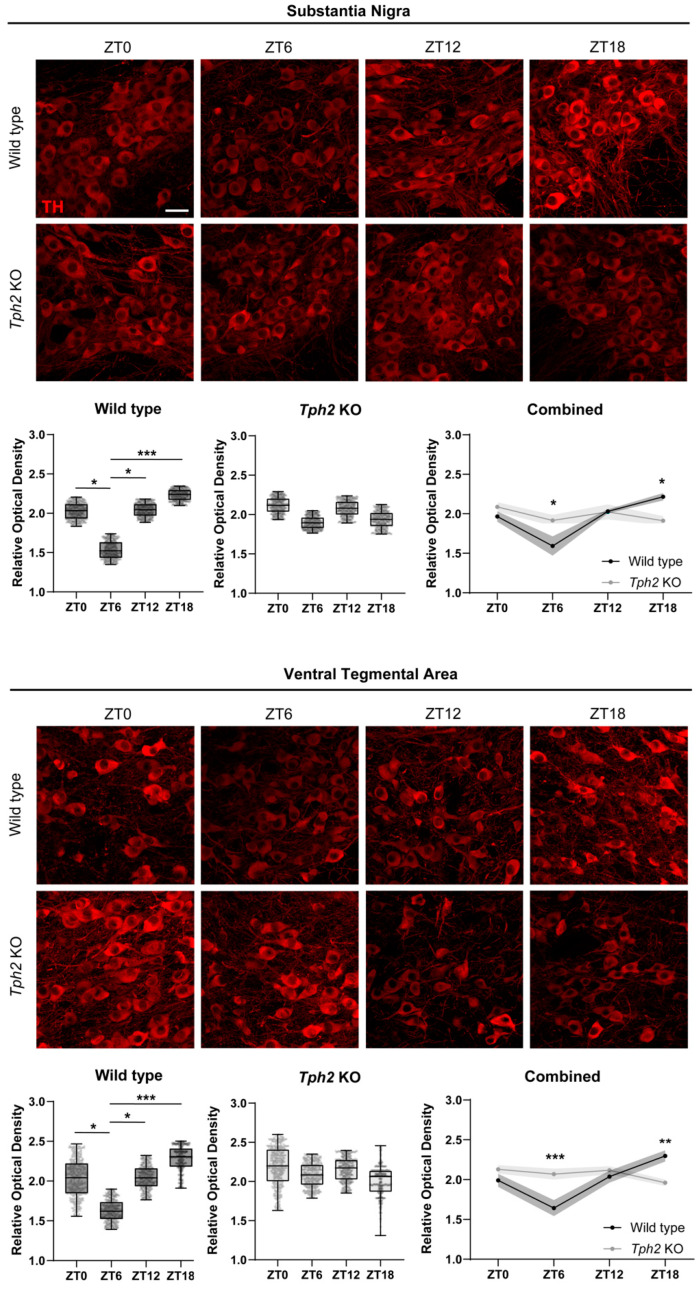
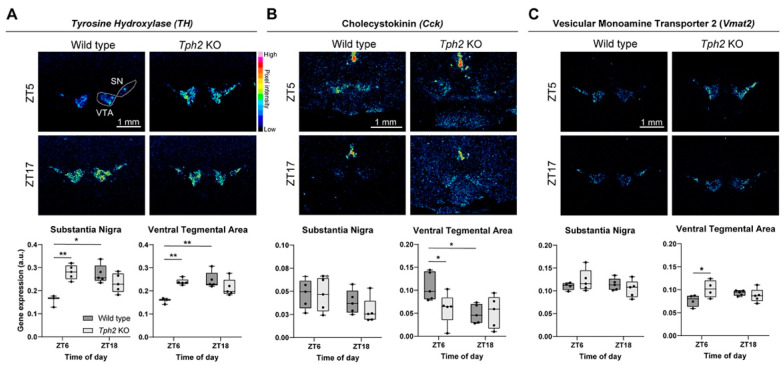
Physiology and behavior are structured temporally to anticipate daily cycles of light and dark, ensuring fitness and survival. Neuromodulatory systems in the brain-including those involving serotonin and dopamine-exhibit daily oscillations in neural activity and help shape circadian rhythms. Disrupted neuromodulation can cause circadian abnormalities that are thought to underlie several neuropsychiatric disorders, including bipolar mania and schizophrenia, for which a mechanistic understanding is still lacking. Here, we show that genetically depleting serotonin in Tph2 knockout mice promotes manic-like behaviors and disrupts daily oscillations of the dopamine biosynthetic enzyme tyrosine hydroxylase (TH) in midbrain dopaminergic nuclei. Specifically, while TH mRNA and protein levels in the Substantia Nigra (SN) and Ventral Tegmental Area (VTA) of wild-type mice doubled between the light and dark phase, TH levels were high throughout the day in Tph2 knockout mice, suggesting a hyperdopaminergic state. Analysis of TH expression in striatal terminal fields also showed blunted rhythms. Additionally, we found low abundance and blunted rhythmicity of the neuropeptide cholecystokinin (Cck) in the VTA of knockout mice, a neuropeptide whose downregulation has been implicated in manic-like states in both rodents and humans. Altogether, our results point to a previously unappreciated serotonergic control of circadian dopamine signaling and propose serotonergic dysfunction as an upstream mechanism underlying dopaminergic deregulation and ultimately maladaptive behaviors.

Keywords: bipolar disorders; cholecystokinin; circadian rhythms; dopamine; hyperdopaminergia; manic-like behavior; serotonin; tryptophan hydroxylase 2; tyrosine hydroxylase.


Conflict of interest statement

The authors declare no conflicts of interest.

Figures

Figure 1
Figure 1
Behavioral tests on Tph2 knockout mice. (A) In the graphs relative to the Open Field Test are shown the number of square entries relative to the time spent in the arena (Two-way ANOVA, interaction time × genotype, F (2, 30) = 3.675, p = 0.0374, followed by Sidak’s multiple comparison tests, at 20′, p = 0.0121; at 30′, p = 0.0001), the total number of square entries (Unpaired t test, t = 2.618, df = 30, p = 0.0137), the number of center square entries relative to the time of experiment (Two-way ANOVA, genotype effect, F (1, 15) = 4.677, p = 0.0471, followed by Sidak’s multiple comparison tests, at 30′, p = 0.0003), and the total number of center entries (Unpaired t test, t = 2.279, df = 30, p = 0.0300); WT n = 16; KO n = 16. (B) Box plot relative to the Resident–Intruder test in which are shown the latency of the first attack (Unpaired t test, t = 2.301, df = 15, p = 0.0361), the attack duration (Unpaired t test, t = 0.03170, df = 15, p = 0.9751), and the total number of attacks for WT and KO mice (Unpaired t test, t = 2.301, df = 15, p = 0.0361); WT n = 8; KO n = 10. (C) The graph shows the immobility of WT and KO mice in the Forced Swim Test (Unpaired t test, t = 2.078, df = 23, p = 0.0491); WT n = 13; KO n = 12. (D) Box plot showing the immobility measured in the Tail Suspension Test (Unpaired t test, t = 2.306, df = 23, p = 0.0305); WT n = 13; KO n = 12. (E) Results of the Novelty-Suppressed Feeding Test expressed as latency of eating (Unpaired t test, t = 3.314, df = 23, p = 0.0030), quantity of food consumed (Unpaired t test, t = 1.732, df = 23, p = 0.0967), and weight loss (Unpaired t test, t = 3.217, df = 23, p = 0.0038); WT n = 13; KO n = 12. Data are expressed as means ± min/max for box plots and ±s.e.m. for XY graphs, with * p < 0.05 and ** p < 0.01.
Figure 2
Figure 2
Disruption of daily oscillations of tyrosine hydroxylase in midbrain dopaminergic nuclei. Representative images showing TH immunoreactivity in both Substantia Nigra pars compacta (top of the panel) and Ventral Tegmental area (bottom panel) at ZT0, ZT6, ZT12, and ZT18 (Scale bar 30 μm). Box plots show an intra-genotype comparison of TH immunofluorescence levels measured as ROD at the different ZTs (WT cohorts in SN: One-way ANOVA, F (3, 12) = 14.02, p = 0.0003, followed by Tukey’s multiple comparison test: ZT0 vs. ZT6 p = 0.0124; ZT6 vs. ZT12 p = 0.0039; ZT6 vs. ZT18 p = 0.0002. KO cohorts in SN: One-way ANOVA, F (3, 12) = 1.523, p = 0.2591. WT cohorts in VTA: One-way ANOVA, F (3, 12) = 11.73, p = 0.0007, followed by Tukey’s multiple comparison test: ZT0 vs. ZT6 p = 0.0381, ZT6 vs. ZT12 p = 0.0180, ZT6 vs. ZT18 p = 0.0004. KO cohorts in VTA: One-way ANOVA, F (3, 12) = 2.431, p = 0.1157). TH expression levels between WT and KO mice are compared at different circadian time points. (SN: Two-way ANOVA, interaction time x genotype, F (3, 24) = 7.086, p = 0.0014, followed by Tukey’s multiple comparison test: KO vs. WT at ZT6 p = 0.0487, KO vs. WT at ZT18 p = 0.0042. VTA: Two-way ANOVA, interaction time x genotype, F (3, 24) = 11.24, p < 0.0001, followed by Tukey’s multiple comparison test: KO vs. WT at ZT6 p = 0.0097, KO vs. WT at ZT18 p = 0.0050). WT n = 5, KO n = 5 per timepoint. Data are expressed as means ± min/max for box plots and ±s.e.m. for XY graphs, with * p < 0.05, ** p < 0.01, and *** p < 0.001.
Figure 3
Figure 3
Altered daily rhythms in mRNA levels of tyrosine hydroxylase, cholecystokinin, and vesicular monoamine transporter 2. (A) Representative autoradiogram of coronal sections showing Th mRNA expression. Box plots show gene expression levels in both SN and VTA measured as relative optical density at ZT6 and ZT18 (SN: Mixed-effect model, time x genotype interaction, F (1, 14) = 37.47, p = 0.0009, followed by Sidak’s multiple comparison test: WT ZT6 vs. ZT18 p = 0.0016, WT vs. KO at ZT6 p = 0.0006. VTA: Mixed-effects model, time × genotype interaction, F (1, 14) = 16.92, p = 0.0011, followed by Sidak’s multiple comparison test: WT ZT6 vs. ZT18 p = 0.0008, WT vs. KO at ZT6 p = 0.0017). (B) Representative images of 35S ISH showing Cck expression and graphs of relative optical density quantification (SN: Two-way ANOVA followed by Sidak’s multiple comparison test; this analysis did not reveal any effects. VTA: Two-way ANOVA, in which no effect was found; Sidak’s multiple-comparison test: WT ZT6 vs. ZT18 p = 0.025, WT vs. KO at ZT6 p = 0.0276). (C) Representative images of 35S ISH showing Vmat2 expression at ZT6 and ZT18. In box plots are shown the relative optical density quantifications (SN: Mixed-effecst model followed by Sidak’s multiple comparison test; no effect was found. VTA: Mixed-effect model, interaction time × genotype, F (1, 14) = 5.747, p = 0.0310, followed by Sidak’s multiple comparison test, WT vs. KO at ZT6 p = 0.0386). WT n = 5 KO n = 5 per timepoint. Data are expressed as means ± min/max; * p < 0.05 and ** p < 0.01. Scale bar: 1 mm.

References

    1. LeGates T.A., Fernandez D.C., Hattar S. Light as a Central Modulator of Circadian Rhythms, Sleep and Affect. Nat. Rev. Neurosci. 2014;15:443–454. doi: 10.1038/nrn3743. - DOI - PMC - PubMed
    1. Hastings M.H., Maywood E.S., Brancaccio M. Generation of Circadian Rhythms in the Suprachiasmatic Nucleus. Nat. Rev. Neurosci. 2018;19:453–469. doi: 10.1038/s41583-018-0026-z. - DOI - PubMed
    1. Beier C., Zhang Z., Yurgel M., Hattar S. Projections of ipRGCs and Conventional RGCs to Retinorecipient Brain Nuclei. J. Comp. Neurol. 2021;529:1863–1875. doi: 10.1002/cne.25061. - DOI - PMC - PubMed
    1. Welsh D.K., Takahashi J.S., Kay S.A. Suprachiasmatic Nucleus: Cell Autonomy and Network Properties. Annu. Rev. Physiol. 2010;72:551–577. doi: 10.1146/annurev-physiol-021909-135919. - DOI - PMC - PubMed
    1. Chung S., Lee E.J., Yun S., Choe H.K., Park S.-B., Son H.J., Kim K.-S., Dluzen D.E., Lee I., Hwang O., et al. Impact of Circadian Nuclear Receptor REV-ERBα on Midbrain Dopamine Production and Mood Regulation. Cell. 2014;157:858–868. doi: 10.1016/j.cell.2014.03.039. - DOI - PubMed

MeSH terms

LinkOut - more resources