. 2024 Jun 17;25(12):6640.
doi: 10.3390/ijms25126640.

Exploring the Potential Role of Oligodendrocyte-Associated PIP4K2A in Alzheimer's Disease Complicated with Type 2 Diabetes Mellitus via Multi-Omic Analysis

Affiliations

Exploring the Potential Role of Oligodendrocyte-Associated PIP4K2A in Alzheimer's Disease Complicated with Type 2 Diabetes Mellitus via Multi-Omic Analysis

Doan Phuong Quy Nguyen et al. Int J Mol Sci. .

Abstract

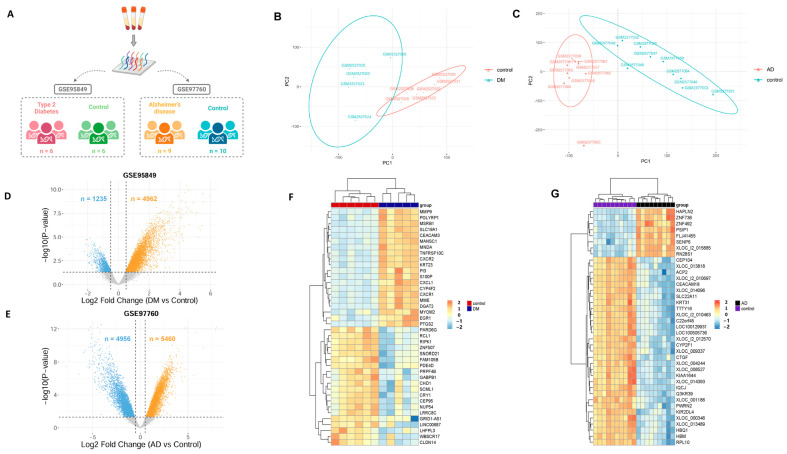
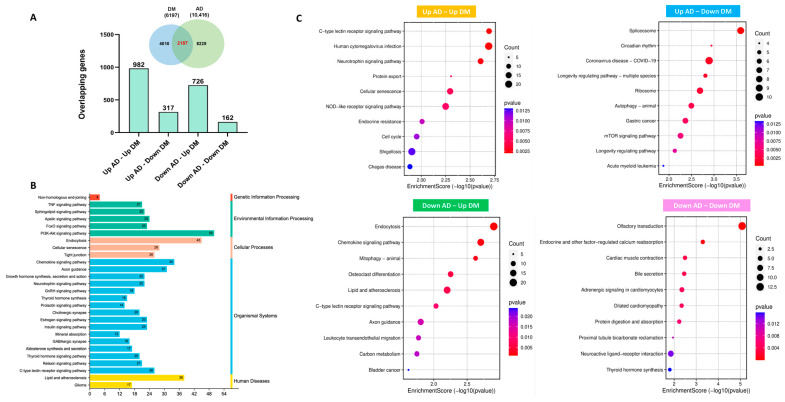
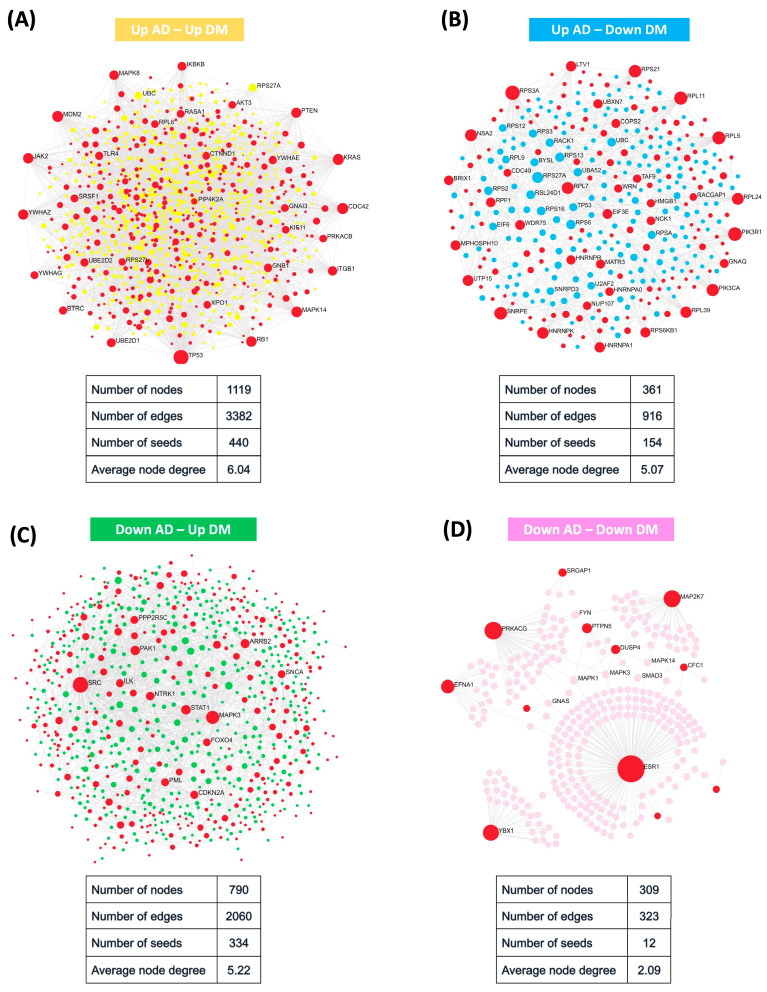
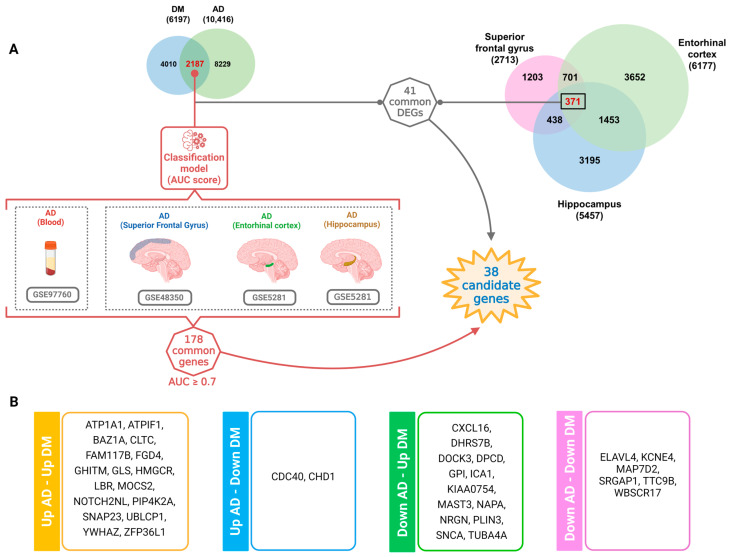
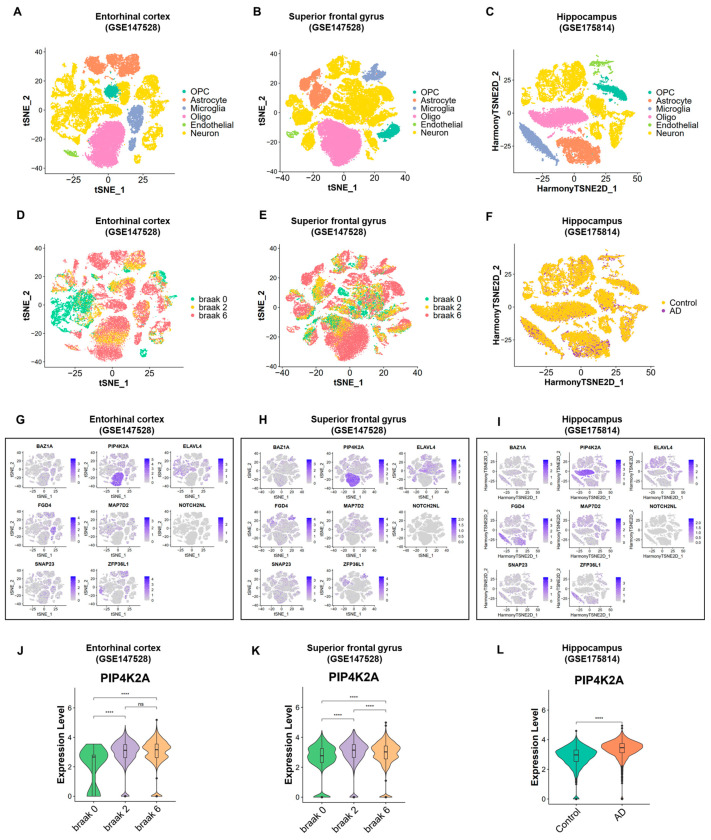
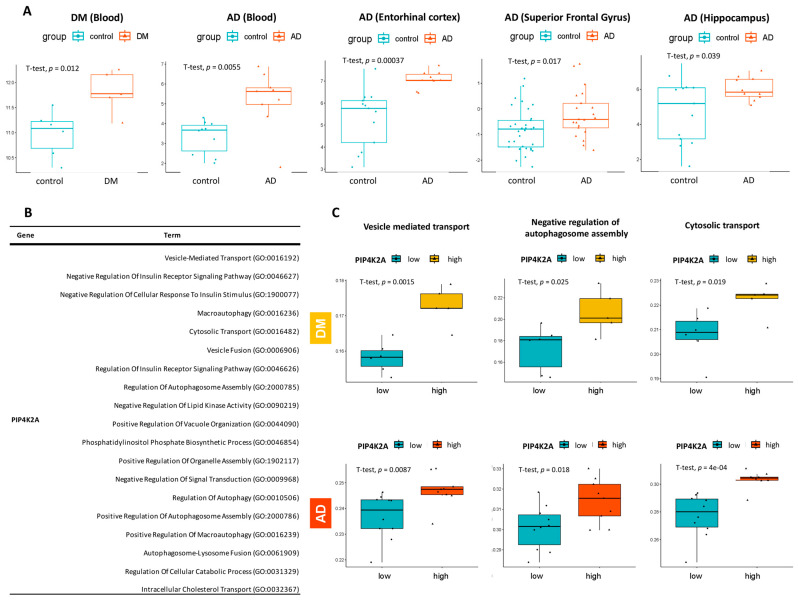
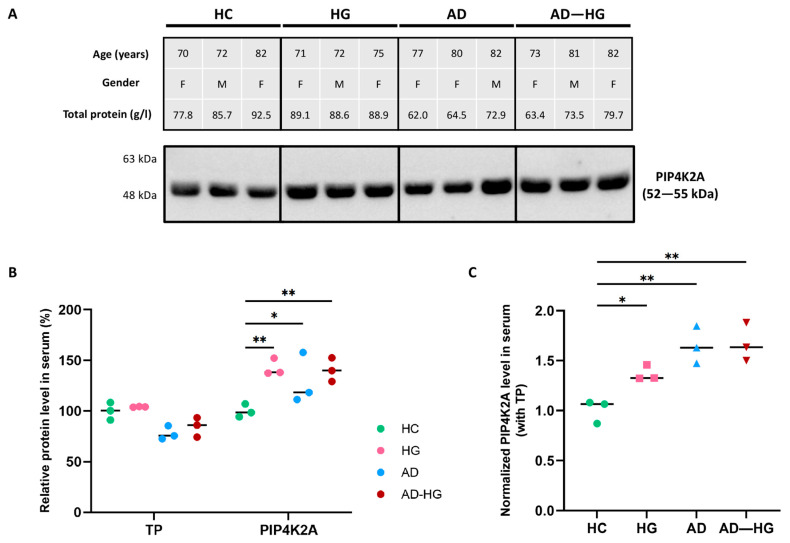
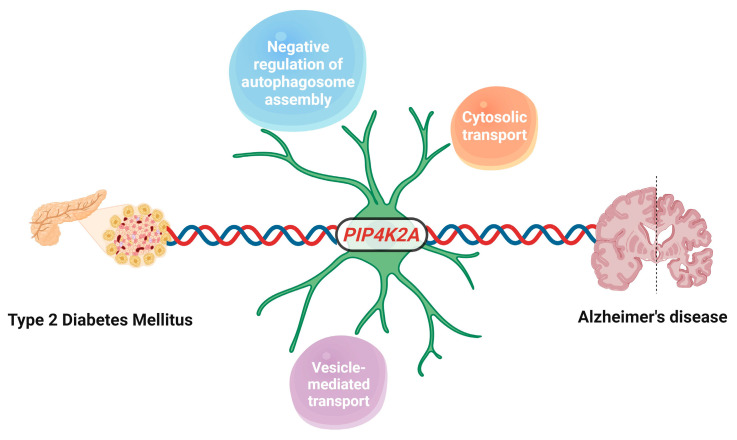
Alzheimer's disease (AD) and type 2 diabetes mellitus (T2DM) are two common diseases that affect the elderly population worldwide. The identification of common genes associated with AD and T2DM holds promise for potential biomarkers and intriguing pathogenesis of these two complicated diseases. This study utilized a comprehensive approach by integrating transcriptome data from multiple cohorts, encompassing both AD and T2DM. The analysis incorporated various data types, including blood and tissue samples as well as single-cell datasets, allowing for a detailed assessment of gene expression patterns. From the brain region-specific single-cell analysis, PIP4K2A, which encodes phosphatidylinositol-5-phosphate 4-kinase type 2 alpha, was found to be expressed mainly in oligodendrocytes compared to other cell types. Elevated levels of PIP4K2A in AD and T2DM patients' blood were found to be associated with key cellular processes such as vesicle-mediated transport, negative regulation of autophagosome assembly, and cytosolic transport. The identification of PIP4K2A's potential roles in the cellular processes of AD and T2DM offers valuable insights into the development of biomarkers for diagnosis and therapy, especially in the complication of these two diseases.

Keywords: Alzheimer’s disease; PIP4K2A; bioinformatics; biomarker; single-cell sequencing; type 2 diabetes mellitus.


Conflict of interest statement

The authors declare no conflicts of interest.

Figures

Figure 1
Figure 1
The expression patterns observed in the microarray dataset provide distinctive characteristics associated with AD and T2DM. (A) Summary of AD and T2DM microarray dataset. (B) The principal component analysis map of GSE95849 (T2DM dataset) in two phenotype samples. (C) The principal component analysis (PCA) map of GSE97760 (AD dataset) in two phenotype samples. (D,E) The volcano plot illustrates two distinct lists of differential gene expressions (DEGs) in T2DM and AD compared to healthy control samples, respectively. The volcano plot depicts upregulated genes as orange dots, while downregulated genes are represented by blue dots. Non-significant genes are shown as gray dots. The thresholds used for defining differential expression were set as p-value < 0.05 and |log2FC| > 0.5. (F,G) The heatmap displays the top significant genes that are differentially expressed in the T2DM, and AD groups compared to the control samples. The gene expression matrix was scaled to a range of (−2, 2), with corresponding colors ranging from blue to red.
Figure 2
Figure 2
The overlapping DEGs of AD and T2DM. (A) The overlap between the DEG lists of AD and T2DM resulted in a total of 2187 DEGs. These DEGs were further categorized into four sub-gene sets: Up AD–Up DM, Up AD–Down DM, Down AD–Up DM, and Down AD–Down DM. (B) The Kyoto Encyclopedia of Genes and Genomes (KEGG) enrichment analysis was performed using the 2187 DEGs as input. The results of the analysis were visualized in a bar chart, which represents the KEGG annotation categories. (C) The distinct enrichment pathways for each gene set in (A) were identified through KEGG analysis. The pathway analysis was conducted using the clusterProfiler package, and pathways with a significance threshold of p-value < 0.05 were considered significant. The resulting pathways were visualized in a dot plot.
Figure 3
Figure 3
Protein–protein interaction networks. (A) Network of “Up AD–Up DM” gene set. (B) Network of “Up AD–Down DM” gene set. (C) Network of “Down AD–Up DM” gene set. (D) Network of “Down AD–Down DM” gene set. In each network, the gene sets were used as input, with the “seed” genes represented in red color. Significant proteins that correspond to the seed proteins were depicted as seed nodes and color-coded accordingly: yellow for ‘Up AD–Up DM’, blue for ‘Up AD–Down DM’, green for ‘Down AD–Up DM’, and pink for ‘Down AD–Down DM’. The transparency gradient of the nodes is based on the node degree.
Figure 4
Figure 4
Identification of AD-predictive significance genes across multiple datasets. (A) Workflow summarizing the identification of AD-predictive significance genes across multiple datasets. (B) Characterization of the 38 genes in the final set, categorized into the four gene sets mentioned above, highlighting their respective characteristics.
Figure 5
Figure 5
Transcriptional diversity in AD and control samples revealed by single-cell Human Brain Region Atlas. (AC) t-distributed Stochastic Neighbor Embedding (t-SNE) visualization of three different single-cell datasets obtained from the superior frontal gyrus (GSE147528), entorhinal cortex (GSE147528), and hippocampus (GSE175814). (DF) Corresponding t-SNEs of the brain regions depict the cellular distribution in different conditions, including Braak 0, Braak 2, and Braak 6 stages (superior frontal gyrus and entorhinal cortex datasets), as well as AD and control states (hippocampus dataset). (GI) Gene expression patterns of 8 selected genes plotted on the t-SNE coordinates shown in (A), PIP4K2A displayed specific expression in oligodendrocytes. (JL) Violin plots depicting the significant differences in gene expression levels of PIP4K2A between AD and control samples (hippocampus), between early and advanced Braak stages (entorhinal cortex and superior frontal gyrus). ns: not significant; **** p < 0.0001.
Figure 6
Figure 6
Comprehensive characterization of PIP4K2A across multiple brain region microarray datasets. (A) Boxplot illustrating the expression level distribution of PIP4K2A in the diseases and control groups, including T2DM blood samples, AD blood samples, and three different brain region tissue samples. The p-value is calculated using a t-test. (B) The table presents the contribution of PIP4K2A in multiple biological process pathways, obtained from the Gene Ontology 2023 database. (C) The high expression of PIP4K2A is associated with the upregulated levels of biological processes such as “vesicle-mediated transport”, “negative regulation of autophagosome assembly”, and “cytosolic transport” in both T2DM and AD datasets.
Figure 7
Figure 7
Western blot analysis of PIP4K2A in human serum. (A) PIP4K2A level in serum samples from healthy control (HC), hyperglycemia (HG), AD, and AD with hyperglycemia (AD–HG) patients via Western blotting. The study included two females and one male in each group. (B) The band densities of PIP4K2A and the total protein (TP) levels were normalized against the average values of the HC samples. (C) Normalized PIP4K2A levels in serum against the TP values within the same sample group; * p < 0.05; ** p < 0.01.
Figure 8
Figure 8
A schematic summary illustrating the potential involvement of PIP4K2A in AD and its possible connection to T2DM, predominantly in oligodendrocyte cell type. This illustration was designed via Biorender (https://app.biorender.com/ accessed on 30 January 2024).

Similar articles

Cited by

References

    1. Breijyeh Z., Karaman R. Comprehensive Review on Alzheimer’s Disease: Causes and Treatment. Molecules. 2020;25:5789. doi: 10.3390/molecules25245789. - DOI - PMC - PubMed
    1. Alzheimer’s Association 2023 Alzheimer’s disease facts and figures. Alzheimer’s Dement. 2023;19:1598–1695. doi: 10.1002/alz.13016. - DOI - PubMed
    1. Wong W. Economic burden of Alzheimer disease and managed care considerations. Am. J. Manag. Care. 2020;26:S177–S183. doi: 10.37765/ajmc.2020.88482. - DOI - PubMed
    1. Gunes S., Aizawa Y., Sugashi T., Sugimoto M., Rodrigues P.P. Biomarkers for Alzheimer’s Disease in the Current State: A Narrative Review. Int. J. Mol. Sci. 2022;23:4962. doi: 10.3390/ijms23094962. - DOI - PMC - PubMed
    1. McKhann G.M., Knopman D.S., Chertkow H., Hyman B.T., Jack C.R., Jr., Kawas C.H., Klunk W.E., Koroshetz W.J., Manly J.J., Mayeux R., et al. The diagnosis of dementia due to Alzheimer’s disease: Recommendations from the National Institute on Aging-Alzheimer’s Association workgroups on diagnostic guidelines for Alzheimer’s disease. Alzheimers Dement. 2011;7:263–269. doi: 10.1016/j.jalz.2011.03.005. - DOI - PMC - PubMed

MeSH terms

Substances