. 2024 Jun 20;25(12):6806.
doi: 10.3390/ijms25126806.

The Extract of Gloiopeltis tenax Enhances Myogenesis and Alleviates Dexamethasone-Induced Muscle Atrophy

Affiliations

The Extract of Gloiopeltis tenax Enhances Myogenesis and Alleviates Dexamethasone-Induced Muscle Atrophy

Si-Hyung Kim et al. Int J Mol Sci. .

Abstract

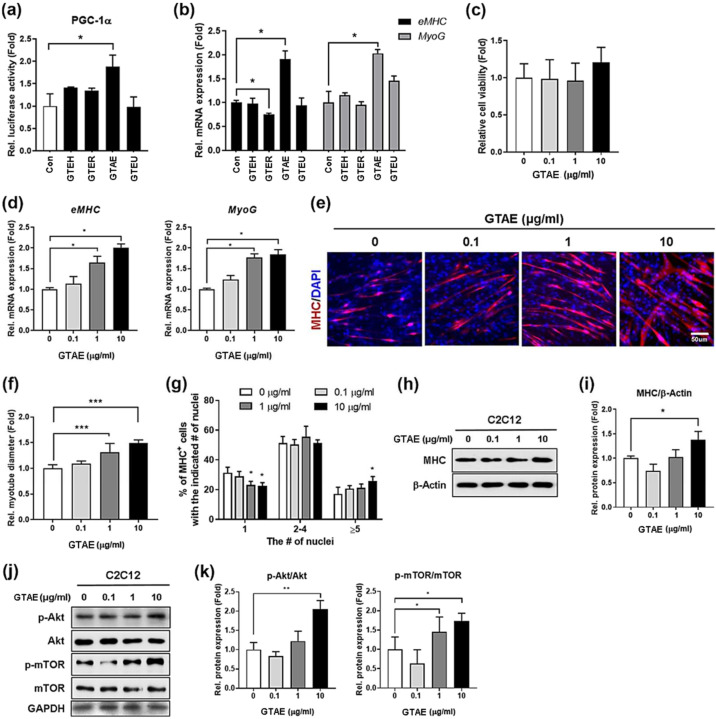
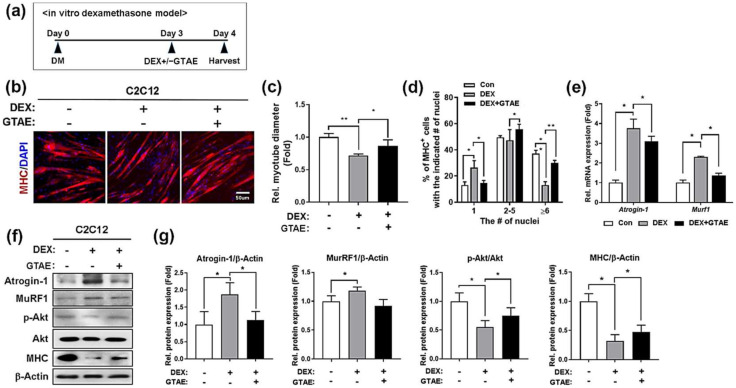
The decline in the function and mass of skeletal muscle during aging or other pathological conditions increases the incidence of aging-related secondary diseases, ultimately contributing to a decreased lifespan and quality of life. Much effort has been made to surmise the molecular mechanisms underlying muscle atrophy and develop tools for improving muscle function. Enhancing mitochondrial function is considered critical for increasing muscle function and health. This study is aimed at evaluating the effect of an aqueous extract of Gloiopeltis tenax (GTAE) on myogenesis and muscle atrophy caused by dexamethasone (DEX). The GTAE promoted myogenic differentiation, accompanied by an increase in peroxisome proliferator-activated receptor γ coactivator α (PGC-1α) expression and mitochondrial content in myoblast cell culture. In addition, the GTAE alleviated the DEX-mediated myotube atrophy that is attributable to the Akt-mediated inhibition of the Atrogin/MuRF1 pathway. Furthermore, an in vivo study using a DEX-induced muscle atrophy mouse model demonstrated the efficacy of GTAE in protecting muscles from atrophy and enhancing mitochondrial biogenesis and function, even under conditions of atrophy. Taken together, this study suggests that the GTAE shows propitious potential as a nutraceutical for enhancing muscle function and preventing muscle wasting.

Keywords: Gloiopeltis tenax; PGC-1α; mitochondria; muscle atrophy; red algae.


Conflict of interest statement

H.E.P., H.-I.J. and J.L. were employed by Redone Technologies Co., Ltd. The remaining authors declare that the research was conducted in the absence of any commercial or financial relationships that could be construed as a potential conflict of interest.

Figures

Figure 1
Figure 1
The aqueous extract of G. tenax (GTAE) promotes PGC-1α activity and enhances myogenic differentiation. (a) Each extract (GTEH, GTER, GTAE, and GTEU) of G. tenax (1 μg/mL) was tested for PGC-1α activation using a PGC-1α-Luc construct in C2C12 cells. (b) qRT-PCR analysis for the expression of early muscle differentiation markers (eMHC and MyoG) in C2C12 cells treated with individual extracts (1 μg/mL) of G. tenax. (c) MTT assay was performed to determine the cell viability in C2C12 cells treated with 0.1, 1, or 10 μg/mL GTAE. (d) qRT-PCR analysis for the expressions of eMHC and MyoG in C2C12 cells that were treated with a vehicle, 0.1, 1, or 10 μg/mL GTAE at D0 and differentiated for 24 h. (e) Immunostaining for MHC in C2C12 cells that were treated with a vehicle, 0.1, 1, or 10 μg/mL GTAE at D0 and were induced for myogenic differentiation until D3. Scale bar = 50 μm. (f) Quantification for the diameter of MHC-positive myotubes shown in panel e (n = 3). (g) The percentages of MHC-positive myotubes containing the indicated number of nuclei, as shown in panel e (n = 3). (h) Western blot analysis for the expression of MHC in C2C12 cells that were treated with a vehicle, 0.1, 1, or 10 μg/mL GTAE at D0 and then induced for myogenic differentiation until D3. β-Actin was used as a loading control. (i) Quantification of the relative protein levels of MHC, shown in panel h (n = 3). (j) Western blot analysis for the levels of p-Akt, Akt, p-mTOR, and mTOR in C2C12 cells that were treated with a vehicle, 0.1, 1, or 10 μg/mL GTAE at D0 and were then induced for differentiation for an additional 3 days. GAPDH was used as a loading control. (k) The relative signal intensity of p-Akt and p-mTOR shown in panel j was quantified and normalized to that of total Akt and mTOR, respectively (n = 3). A one-way ANOVA analysis with a Tukey post hoc test was utilized to determine the statistical significance. Data is represented as the mean ±SD or ± SEM. Asterisks indicate the significant difference from the control. * p < 0.05, ** p < 0.01, and *** p < 0.001.
Figure 2
Figure 2
GTAE upregulates mitochondrial biogenesis and function in myoblasts. (a) qPCR analysis for measuring mtDNA/nDNA ratio in C2C12 cells that were treated with either a vehicle or 10 μg/mL GTAE for 24 h in the GM. (b) Western blot analysis for the expressions of PGC-1α and total OXPHOS complex proteins in C2C12 cells that were treated with a vehicle, 0.1, 1, or 10 μg/mL GTAE at D0 and then differentiated until D3. HSP90 was used as a loading control. (c) Quantification of the levels of PGC-1α and total OXPHOS proteins shown in panel b (n = 3). (d) qRT-PCR analysis for the expressions of PGC-1α and mitochondria-related genes in C2C12 cells that were treated with either a vehicle or 10 μg/mL GTAE at D0 and then differentiated for an additional 3 days. L-32 was selected as an endogenous control. (e) JC-1 staining was performed on C2C12 cells treated with either a vehicle or 10 μg/mL GTAE for 24 h in the GM. The images of the white boxes in the left row panels were enlarged on the right. Scale bar = 20 μm; 10 μm (inset). (f) Quantification of JC-1 staining shown in panel e. The relative intensity of JC-1 aggregates (red) to JC-1 monomers (green) was quantified. A one-way ANOVA analysis with a Tukey post hoc test was used to determine the statistical significance. Data is expressed as the mean ±SD or ± SEM. Asterisks indicate the significant difference from the control. * p < 0.05, ** p < 0.01, and *** p < 0.001.
Figure 3
Figure 3
GTAE alleviates the reduction in myotube size in an in vitro atrophy model. (a) The procedure diagram depicts DEX-induced atrophy in C2C12 cells. C2C12 cells were differentiated for 3 days and were then treated with a vehicle or 10 μg/mL GTAE and/or DEX (100 μM) for an additional 1 day in the DM. (b) Immunostaining for MHC (red) was performed in C2C12 cells that were differentiated for 3 days in the DM. Afterward, they were treated with a vehicle or 10 μg/mL GTAE and/or DEX for an additional day. Nuclei were counter-stained with DAPI (blue). Scale bar = 50 μm. (c) Quantification of the relative diameter of the MHC-positive myotubes shown in panel b (n = 5). (d) Quantification of MHC-positive myotubes containing the indicated number of nuclei, as shown in panel b (n = 5). (e) qRT-PCR for Atrogin-1 and Murf1 in C2C12 cells treated with a vehicle or 10 μg/mL GTAE and/or DEX (100 μM) for 24 h in the DM. (f) Western blot analysis for the levels of MHC, MuRF1, Atrogin-1, p-Akt, and Akt in C2C12 cells treated with a vehicle or 10 μg/mL GTAE and/or DEX (100 μM). β-Actin was used as a loading control. (g) The band intensities of MuRF1, Atrogin-1, and MHC shown in panel f were quantified, and each value was normalized to that of β-Actin. The signal intensity of p-Akt was measured and then normalized to total Akt. An unpaired two-tailed Student’s t-test and ANOVA analysis with Tukey post hoc test were both utilized to determine the statistical significance. Data is presented as the mean ± SD or ± SEM. Asterisks indicate a significant difference from the control. * p < 0.05 and ** p < 0.01.
Figure 4
Figure 4
GTAE alleviates DEX-induced muscle atrophy in mice. (a) The procedure diagram depicts the in vivo study of DEX-induced muscle atrophy. Eight-week-old male mice were administered a vehicle or GTAE (8 mg/kg) by P.O. for 7 days. Then, a P.O. of a vehicle or GTAE and/or an I.P. injection of DEX (20 mg/kg) was conducted for an additional 10 days. For the physical activity tests, the treadmill test and the grip strength test were conducted 2–3 days prior to the sacrifice. (b) The changes in body weights of mice administered with a vehicle or GTAE and/or DEX (Con (n = 9), DEX (n = 9), DEX + GTAE (n = 10). (c) The changes in food intake of mice treated with a vehicle or GTAE and/or DEX (Con (n = 9), DEX (n = 9), DEX + GTAE (n = 10). (d) The difference in grip forces of mice administered with a vehicle or GTAE and/or DEX (Con (n = 9), DEX (n = 9), DEX + GTAE (n = 10). (e) The endurance activity was measured by the treadmill test with mice administered with a vehicle or GTAE and/or DEX (Con (n = 9), DEX (n = 9), DEX + GTAE (n = 10). (f) The wet weights of the EDL muscles from mice administered with a vehicle or SMGL and/or DEX (Con (n = 9), DEX (n = 9), DEX + GTAE (n = 10). (g) The wet weights of the WAT from mice administered with a vehicle or GTAE and/or DEX (Con (n = 9), DEX (n = 9), DEX + GTAE (n = 10). (h) Immunostaining for MyhIIa (green), MyhIIb (green), laminin (red), and DAPI (blue) was performed in the EDL muscles from mice administered with a vehicle or GTAE and/or DEX. Scale bar = 50 μm. (i) The quantification of the cross-sectional area of MyhIIa- or MyhIIb-positive myofibers shown in panel h (n = 3). (j) qRT-PCR for Atrogin-1 and Murf1 expression in the GAS muscles from mice treated with a vehicle or GTAE and/or DEX (n = 3). The two-way ANOVA analysis with Tukey post hoc test was used to determine statistical significance. Data is presented as the mean ± SD or ± SEM. Asterisks indicate a significant difference from the control. * p < 0.05, ** p < 0.01, and *** p < 0.001. # p < 0.05, ## p < 0.01, and ### p < 0.001.
Figure 5
Figure 5
GTAE enhances muscle mitochondrial metabolism in DEX-induced muscle atrophy. (a) qPCR analysis for measuring the mtDNA/nDNA ratio of the TA muscles from mice administered with a vehicle or GTAE and/or DEX (n = 3). (b) Western blot analysis for the expression levels of PGC-1α and OXPHOS proteins in the TA muscles. HSP90 was used as a loading control. (c) Quantification of the levels of PGC-1α and OXPHOS proteins shown in panel b (n = 3). (d) Histochemical staining for SDH and NADH-TR enzymatic activities in the TA muscles. Scale bar = 50 μm. (e) The staining intensities of SDH and NADH-TR were quantified using three different grades (dark, intermediate, and pale) and plotted as percentiles (n = 3). (f) qRT-PCR analysis for the expression of mitochondria-related genes in the TA muscles from mice treated with a vehicle or GTAE and/or DEX (n = 3). The two-way ANOVA analysis with Tukey post hoc test was used to determine statistical significance. Data is presented as the mean ± SD or ± SEM. Asterisks indicate a significant difference from the control. * p < 0.05, ** p < 0.01, and *** p < 0.001.

Similar articles

Cited by

References

    1. Stellavato A., Abate L., Vassallo V., Donniacuo M., Rinaldi B., Schiraldi C. An in vitro study to assess the effect of hyaluronan-based gels on muscle-derived cells: Highlighting a new perspective in regenerative medicine. PLoS ONE. 2020;15:e0236164. doi: 10.1371/journal.pone.0236164. - DOI - PMC - PubMed
    1. Yin L., Li N., Jia W., Wang N., Liang M., Yang X., Du G. Skeletal muscle atrophy: From mechanisms to treatments. Pharmacol. Res. 2021;172:105807. doi: 10.1016/j.phrs.2021.105807. - DOI - PubMed
    1. Walston J.D. Sarcopenia in older adults. Curr. Opin. Rheumatol. 2012;24:623–627. doi: 10.1097/BOR.0b013e328358d59b. - DOI - PMC - PubMed
    1. Santilli V., Bernetti A., Mangone M., Paoloni M. Clinical definition of sarcopenia. Clin. Cases Miner. Bone Metab. 2014;11:177–180. doi: 10.11138/ccmbm/2014.11.3.177. - DOI - PMC - PubMed
    1. Meng S.J., Yu L.J. Oxidative stress, molecular inflammation and sarcopenia. Int. J. Mol. Sci. 2010;11:1509. doi: 10.3390/ijms11041509. - DOI - PMC - PubMed

MeSH terms

Substances

Supplementary concepts

LinkOut - more resources