. 2024 Jun 5;13(6):693.
doi: 10.3390/antiox13060693.

Ergothioneine-Mediated Neuroprotection of Human iPSC-Derived Dopaminergic Neurons

Affiliations

Ergothioneine-Mediated Neuroprotection of Human iPSC-Derived Dopaminergic Neurons

Damien Meng-Kiat Leow et al. Antioxidants (Basel). .

Abstract

Cell death involving oxidative stress and mitochondrial dysfunction is a major cause of dopaminergic neuronal loss in the substantia nigra (SN) of Parkinson's disease patients. Ergothioneine (ET), a natural dietary compound, has been shown to have cytoprotective functions, but neuroprotective actions against PD have not been well established. 6-Hydroxydopamine (6-OHDA) is a widely used neurotoxin to simulate the degeneration of dopaminergic (DA) neurons in Parkinson's disease. In this study, we investigated the protective effect of ET on 6-OHDA treated iPSC-derived dopaminergic neurons (iDAs) and further confirmed the protective effects in 6-OHDA-treated human neuroblastoma SH-SY5Y cells. In 6-OHDA-treated cells, decreased mitochondrial membrane potential (ΔΨm), increased mitochondrial reactive oxygen species (mROS), reduced cellular ATP levels, and increased total protein carbonylation levels were observed. 6-OHDA treatment also significantly decreased tyrosine hydroxylase levels. These effects were significantly decreased when ET was present. Verapamil hydrochloride (VHCL), a non-specific inhibitor of the ET transporter OCTN1 abrogated ET's cytoprotective effects, indicative of an intracellular action. These results suggest that ET could be a potential therapeutic for Parkinson's disease.

Keywords: 6-OHDA; Parkinson’s disease; ergothioneine; mitochondrial dysfunction; neurodegeneration.


Conflict of interest statement

The authors declare no conflicts of interest.

Figures
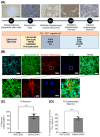
Figure 1
Figure 1
Derivation of day 40 dopaminergic neurons and quality control analysis. (A) Schematic representation of differentiation protocol to derive day-40-induced dopaminergic neurons from hiPSCs (BJ and GM23720) and hESC (H9). Scale bar= 100 µm (B) Confocal imaging of neuronal and dopaminergic markers. DAPI stains the nucleus. Beta-Tubulin III and NeuN are neuronal markers. Tyrosine hydroxylase (TH) is a dopaminergic marker. Scale bar = 100 µm; Scale bar for zoomed in figures = 20 µm (C,D) ImageJ analysis of confocal images of TH and NeuN to quantify the percentage of neurons and dopaminergic neurons present in the culture. Data are represented as mean ± SD (n = 3). Data were analysed by unpaired Student’s t-test. *** p ≤ 0.001.
Figure 2
Figure 2
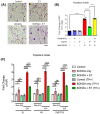
Intracellular uptake of ET, mediated through OCTN1 transporters, protects iDA cultures against 6-OHDA-induced cell death in a concentration-dependent manner. (A) Confocal imaging showing expression of TH and OCTN1 in D40 iDAs. Images are representative of three independent experiments (n = 3). Scale bar = 20 µm (B) Protection of ET against 6-OHDA neurotoxicity was dose-dependent. (C) LC-MS assay showing ET uptake into day 40 iDAs (n = 3). (D) MTT assay showed that 6-OHDA induced a 70–80% loss of metabolic activity in iDA cultures. Co-treatment with a non-specific inhibitor of OCTN1, verapamil hydrochloride (VHCL), abrogated the protective effects of ET. (Control: no treatment; 6OHDA: 15 µM 6-hydroxydopamine; ET: 1 mM ergothioneine; VHCL: 100 µM verapamil hydrochloride). Data were analysed by one-way ANOVA with Bonferroni’s multiple comparison post hoc test. ns: non-significant, * p ≤ 0.05. ** p ≤ 0.01. *** p ≤ 0.001. **** p ≤ 0.0001.
Figure 3
Figure 3
ET-mediated protection of 6-OHDA-treated iDAs and non-iDAs in culture. (A) Haematoxylin and eosin (H&E) staining to show changes of neuronal morphology from various treatment groups. Scale bar = 20 µm (B) Propidium iodide assay using flow cytometry showing changes in quantity of non-viable TH-positive (TH+) cells. Higher MFI readings denote an increase in non-viable TH+ cells from the treatment group and vice versa. (C) Comparison of cell death between iDAs (TH+ neurons) and non-iDAs (TH- neurons) with or without ET. (B,C) Data are represented as mean ± SD (n = 3). (Control: no treatment; 6OHDA: 15 µM 6-hydroxydopamine; ET: 1 mM ergothioneine; VHCL: 100 µM verapamil hydrochloride). Data were analysed by one-way ANOVA with Bonferroni’s multiple comparison post hoc test. ns: non-significant, * p ≤ 0.05. ** p ≤ 0.01. **** p ≤ 0.0001.
Figure 4
Figure 4
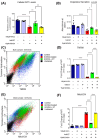
Effect of ET on intracellular ATP levels and dopamine secretion in 6-OHDA-treated iDA cultures; TH+ Day 40 iDAs were also analysed for mitochondrial ROS and mitochondrial membrane potential levels. (A) ATP assay showing relative changes in intracellular ATP levels. Higher absorbance values denote greater quantities of ATP in the cell lysates of the treatment group. (B) Dopamine secretion assay showing the changes in the amounts of dopamine being secreted by the day 40 iDAs in each treatment group. Higher absorbance values denote greater quantities of dopamine. (C) Scatter plot of flow cytometry data (TH-TMRM co-staining) of the day 40 iDAs from the different treatment groups. (D) Bar chart of flow cytometry data for TH and TMRM co-staining to show relative changes in the different treatment groups. (E) Scatter plot of flow cytometry data (TH-MitoSOX co-staining) of the day 40 iDAs from the different treatment groups. (F) Bar chart of flow cytometry data for TH and MitoSOX co-staining to show relative changes in the different treatment groups. (A,B,D,F) Data are represented as mean ± SD (n = 3). (Control: no treatment; 6OHDA: 15 µM 6-hydroxydopamine; ET: 1 mM ergothioneine; VHCL: 100 µM verapamil hydrochloride). Data were analysed by one-way ANOVA with Bonferroni’s multiple comparison post hoc test. * p ≤ 0.05. ** p ≤ 0.01. **** p ≤ 0.0001.
Figure 5
Figure 5
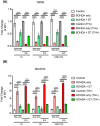
Effect of ET and 6OHDA on mitochondrial membrane potential and mitochondrial ROS in both non-iDAs and TH+ iDAs population. (A) Comparison of the effect of 6-OHDA on mitochondrial membrane potential between iDAs (TH+ neurons) and non-iDAs (TH- neurons) with or without ET. (B) Comparison of the effect of 6-OHDA on mitochondrial ROS levels between iDAs and non-iDAs with or without ET. (A,B) Data are represented as mean ± SD (n = 3). (Control: no treatment; 6OHDA: 15 µM 6-hydroxydopamine; ET: 1 mM ergothioneine). Data were analysed by one-way ANOVA with Bonferroni’s multiple comparison post hoc test. ns: non-significant, ** p ≤ 0.01. *** p ≤ 0.001. **** p ≤ 0.0001.
Figure 6
Figure 6
Intracellular uptake of ET, mediated through OCTN1 transporters, also protects TH+ SH-SY5Y cultures against 6-OHDA-induced cell death. (A) Confocal imaging showing expression of TH and OCTN1 in SH-SY5Y cells. Images are representative of three independent experiments (n = 3). Scale bar = 50 µm (B) LC-MS assay showing ET uptake into day 40 iDAs (n = 3). (C) MTT assay showed that 6-OHDA induced a 70–80% loss of metabolic activity in iDA cultures. (D) Propidium iodide assay using flow cytometry showing changes in quantity of non-viable cells. Higher MFI readings denote an increase in non-viable cells from the treatment group and vice versa. (C,D) Co-treatment with a non-specific inhibitor of OCTN1, verapamil hydrochloride (VHCL), largely abrogated the protective effects of ET. (BD) Data are represented as mean ± SD (n = 3). (Control: no treatment; 6OHDA: 15 µM 6-hydroxydopamine; ET: 1 mM ergothioneine; VHCL: 100 µM verapamil hydrochloride). Data were analysed by one-way ANOVA with Bonferroni’s multiple comparison post hoc test. ns: non-significant, * p ≤ 0.05. *** p ≤ 0.001. **** p ≤ 0.0001.
Figure 7
Figure 7
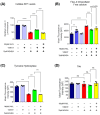
Effect of ET on cellular metabolism and tyrosine hydroxylase levels in 6-OHDA-treated SH-SY5Y cells. (A) ATP assay showing relative levels in intracellular ATP as compared to the control group. (B) Fluo-4 AM assay measures intracellular free calcium levels. Data are represented as mean ± SD (n = 4). (C) Flow cytometry analysis to quantify relative amounts of tyrosine hydroxylase (TH) protein expression as compared to control. (D) Flow cytometry analysis to quantify relative tau neuronal protein expression among the treatment groups as compared to control. (AD) (Control: no treatment; 6OHDA: 15 µM 6-hydroxydopamine; ET: 1 mM ergothioneine; VHCL: 100 µM verapamil hydrochloride). Data were analysed by one-way ANOVA with Bonferroni’s multiple comparison post hoc test. Unless stated in figures, ns: non-significant, ** p ≤ 0.01, *** p ≤ 0.001, **** p ≤ 0.0001.
Figure 8
Figure 8
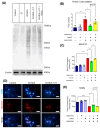
Effect of intracellular ET on oxidative stress and mitochondrial membrane potential in 6-OHDA-treated SH-SY5Y cells. (A) Protein carbonylation immunoblot of the different treatment groups. β-Actin was used as the housekeeping protein for normalisation. (B) ImageJ analysis of immunoblot to quantify relative amounts of oxidised proteins between the treatment groups, as compared to control. (C) MitoSOX assay using flow cytometry showing changes in mROS levels. Data are represented as mean ± SD (n = 3). (D) Fluorescence cytochemistry live-cell imaging for mROS. DAPI (blue) stains for nucleus, whereas MitoSOX (red) stains for mROS. Scale bar = 50 µm (E) TMRM assay measures mitochondrial membrane potential (MMP). (Control: no treatment; 6OHDA: 15 µM 6-hydroxydopamine; ET: 1 mM ergothioneine; VHCL: 100 µM verapamil hydrochloride). Data are represented as mean ± SD (n = 3). Data were analysed by one-way ANOVA with Bonferroni’s multiple comparison post hoc test. Unless stated in figures, * p ≤ 0.05, ** p ≤ 0.01, *** p ≤ 0.001, **** p ≤ 0.0001.

References

    1. Ou Z., Pan J., Tang S., Duan D., Yu D., Nong H., Wang Z. Global Trends in the Incidence, Prevalence, and Years Lived with Disability of Parkinson’s Disease in 204 Countries/Territories from 1990 to 2019. Front. Public Health. 2021;9:776847. doi: 10.3389/fpubh.2021.776847. - DOI - PMC - PubMed
    1. Poewe W., Seppi K., Tanner C.M., Halliday G.M., Brundin P., Volkmann J., Schrag A.E., Lang A.E. Parkinson disease. Nat. Rev. Dis. Primers. 2017;3:17013. doi: 10.1038/nrdp.2017.13. - DOI - PubMed
    1. Chinta S.J., Andersen J.K. Redox imbalance in Parkinson’s disease. Biochim. Biophys. Acta. 2008;1780:1362–1367. doi: 10.1016/j.bbagen.2008.02.005. - DOI - PMC - PubMed
    1. Jenner P., Olanow C.W. Oxidative stress and the pathogenesis of Parkinson’s disease. Neurology. 1996;47:161S–170S. doi: 10.1212/WNL.47.6_Suppl_3.161S. - DOI - PubMed
    1. Dexter D.T., Jenner P. Parkinson disease: From pathology to molecular disease mechanisms. Free Radic. Biol. Med. 2013;62:132–144. doi: 10.1016/j.freeradbiomed.2013.01.018. - DOI - PubMed

LinkOut - more resources