. 2024 Jun 15;14(12):1795.
doi: 10.3390/ani14121795.

Adaptive Expression and ncRNA Regulation of Genes Related to Digestion and Metabolism in Stomach of Red Pandas during Suckling and Adult Periods

Affiliations

Adaptive Expression and ncRNA Regulation of Genes Related to Digestion and Metabolism in Stomach of Red Pandas during Suckling and Adult Periods

Lu Li et al. Animals (Basel). .

Abstract

Red pandas evolved from carnivores to herbivores and are unique within Carnivora. Red pandas and carnivorous mammals consume milk during the suckling period, while they consume bamboo and meat during the adult period, respectively. Red pandas and carnivorous mammal ferrets have a close phylogenetic relationship. To further investigate the molecular mechanisms of dietary changes and nutrient utilization in red pandas from suckling to adult, comparative analysis of the whole transcriptome was performed on stomach tissues from red pandas and ferrets during the suckling and adult periods. The main results are as follows: (1) we identified ncRNAs for the first time in stomach tissues of both species, and found significant expression changes of 109 lncRNAs and 106 miRNAs in red pandas and 756 lncRNAs and 109 miRNAs in ferrets between the two periods; (2) up-regulated genes related to amino acid transport regulated by lncRNA-miRNA-mRNA networks may efficiently utilize limited bamboo amino acids in adult red pandas, while up-regulated genes related to amino acid degradation regulated by lncRNAs may maintain the balance of amino acid metabolism due to larger daily intakes in adult ferrets; and (3) some up-regulated genes related to lipid digestion may contribute to the utilization of rich nutrients in milk for the rapid growth and development of suckling red pandas, while up-regulated genes associated with linoleic acid metabolism regulated by lncRNA-miRNA-mRNA networks may promote cholesterol decomposition to reduce health risks for carnivorous adult ferrets. Collectively, our study offers evidence of gene expression adaptation and ncRNA regulation in response to specific dietary changes and nutrient utilization in red pandas during suckling and adult periods.

Keywords: digestion and metabolism; ferret; gene expression adaptation; ncRNA regulation; red panda.


Conflict of interest statement

The authors declare that they have no competing interests.

Figures

Figure 1
Figure 1
Characteristics of lncRNAs and miRNAs in red pandas and ferrets. The distribution of transcript length of lncRNAs in the stomach samples of red pandas. The dotted line shows average length (A). Exon number distribution of lncRNAs in the stomach samples of red pandas. The dotted line shows average number (B). The length distribution of miRNAs in the stomach samples of red pandas (C). The distribution of transcript length of lncRNAs in the stomach samples of ferrets. The dotted line shows average length (D). Exon number distribution of lncRNAs in the stomach samples of ferrets. The dotted line shows average number (E). The length distribution of miRNAs in the stomach samples of ferrets (F).
Figure 2
Figure 2
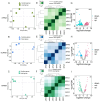
Cluster analyses for all samples and differential analyses between two feeding periods in red pandas. The expression levels of mRNAs (A), lncRNAs (B), and miRNAs (C) were normalized and log-transformed to perform PCA in stomach tissue samples of the suckling group and the adult group in red pandas. Different groups are represented by different shapes. The expression levels of mRNAs (D), lncRNAs (E), and miRNAs (F) were normalized and log-transformed to perform cluster analyses in stomach tissue samples of the suckling group and the adult group in red pandas. Distance between samples was measured using Spearman’s rank correlation coefficient. Volcano plots of mRNAs (G), lncRNAs (H), and miRNAs (I) in stomach samples between the suckling group and the adult group in red pandas. The number in the upper left corner and the number in the upper right corner indicate the number of down-regulated RNAs and up-regulated RNAs in adult group compared with the suckling group in red pandas, respectively. Each dot represents one RNA.
Figure 3
Figure 3
Cluster analyses for all samples and differential analyses between two feeding periods in ferrets. The expression levels of mRNAs (A), lncRNAs (B), and miRNAs (C) were normalized and log-transformed to perform PCA in stomach tissue samples of the suckling group and the adult group in ferrets. Different groups are represented by different shapes. The expression levels of mRNAs (D), lncRNAs (E), and miRNAs (F) were normalized and log-transformed to perform cluster analyses in stomach tissue samples of the suckling group and the adult group in ferrets. Distance between samples was measured using Spearman’s rank correlation coefficient. Volcano plots of mRNAs (G), lncRNAs (H), and miRNAs (I) in stomach samples between the suckling group and the adult group in ferrets. The number in the upper left corner and the number in the upper right corner indicate the number of down-regulated RNAs and up-regulated RNAs in adult group compared with the suckling group in ferrets, respectively. Each dot represents one RNA.
Figure 4
Figure 4
Real-time PCR of some digestion- and metabolism-related DE-mRNAs in red pandas. The relative expression levels of glucose transporter (A), amino acid transporters (BD), proteases (E,F), cholecystokinin receptor (G)-related DE-mRNAs in stomach samples between suckling group and adult group of red pandas. The X axis represents different groups; the Y axis represents the relative mRNA expression levels; * represents significant differences in mRNA expression levels.
Figure 5
Figure 5
Digestion- and metabolism-related lncRNA-mRNA networks in red pandas. The interaction networks of DE-lncRNAs and DE-mRNAs associated with glucose transport (A), amino acid transport (B), and protease (C) in stomach samples between suckling and adult group of red pandas. The palevioletred hexagons represent the up-regulated DE-lncRNAs of adult group; the circles represent the target mRNAs of DE-lncRNAs.
Figure 6
Figure 6
Enrichment analyses and lncRNA-miRNA-mRNA networks in red pandas and ferrets. Significantly enriched GO categories (A) and KEGG pathways (B) for DE-mRNAs of regulatory network composed of up-regulated DE-lncRNAs, down-regulated DE-miRNAs, and up-regulated DE-mRNAs in stomach samples of adult group compared with the suckling group in red pandas. The significantly enriched top 30 categories were selected for display. Regulation network of up-regulated DE-lncRNAs, down-regulated DE-miRNAs, and up-regulated DE-mRNAs that may interact in stomach samples between suckling group and adult group of red pandas (C). Regulation network of up-regulated DE-lncRNAs, down-regulated DE-miRNAs, and up-regulated DE-mRNAs that may interact related to amino acid transport in stomach samples between suckling group and adult group of red pandas (D). Significantly enriched GO categories (E) and KEGG pathways (F) for DE-mRNAs of regulatory network composed of up-regulated DE-lncRNAs, down-regulated DE-miRNAs, and up-regulated DE-mRNAs in stomach samples of adult group compared with the suckling group in ferrets. The significantly enriched top 30 categories were selected for display. Regulation network of up-regulated DE-lncRNAs, down-regulated DE-miRNAs, and up-regulated DE-mRNAs that may interact in stomach samples between suckling group and adult group of ferrets (G). Regulation network of up-regulated DE-lncRNAs, down-regulated DE-miRNAs, and up-regulated DE-mRNAs that may interact related to linoleic acid metabolism in stomach samples between suckling group and adult group of ferrets (H). The gold hexagons represent the up-regulated DE-lncRNAs; the aquamarine diamonds represent the down-regulated DE-miRNAs; the indianred circles represent the up-regulated DE-mRNAs.

References

    1. Mathieson I. Human adaptation over the past 40,000 years. Curr. Opin. Genet. Dev. 2020;62:97–104. doi: 10.1016/j.gde.2020.06.003. - DOI - PMC - PubMed
    1. Harris D.N., Ruczinski I., Yanek L.R., Becker L.C., Becker D.M., Guio H., Cui T., Chilton F.H., Mathias R.A., O’Connor T.D. Evolution of Hominin Polyunsaturated Fatty Acid Metabolism: From Africa to the New World. Genome Biol. Evol. 2019;11:1417–1430. doi: 10.1093/gbe/evz071. - DOI - PMC - PubMed
    1. Lillycrop K.A., Slater-Jefferies J.L., Hanson M.A., Godfrey K.M., Jackson A.A., Burdge G.C. Induction of altered epigenetic regulation of the hepatic glucocorticoid receptor in the offspring of rats fed a protein-restricted diet during pregnancy suggests that reduced DNA methyltransferase-1 expression is involved in impaired DNA methylation and changes in histone modifications. Br. J. Nutr. 2007;97:1064–1073. - PMC - PubMed
    1. Ehara T., Kamei Y., Yuan X., Takahashi M., Kanai S., Tamura E., Tsujimoto K., Tamiya T., Nakagawa Y., Shimano H., et al. Ligand-activated PPARalpha-dependent DNA demethylation regulates the fatty acid beta-oxidation genes in the postnatal liver. Diabetes. 2015;64:775–784. doi: 10.2337/db14-0158. - DOI - PubMed
    1. Girard J., Ferre P., Pegorier J.P., Duee P.H. Adaptations of glucose and fatty acid metabolism during perinatal period and suckling-weaning transition. Physiol. Rev. 1992;72:507–562. doi: 10.1152/physrev.1992.72.2.507. - DOI - PubMed

LinkOut - more resources