

Different Phenotypic, Photosynthetic, and Physiological Responses to Flooding between Q. nuttallii and Q. palustris
- PMID: 38931092
- PMCID: PMC11207582
- DOI: 10.3390/plants13121658
Different Phenotypic, Photosynthetic, and Physiological Responses to Flooding between Q. nuttallii and Q. palustris
Abstract
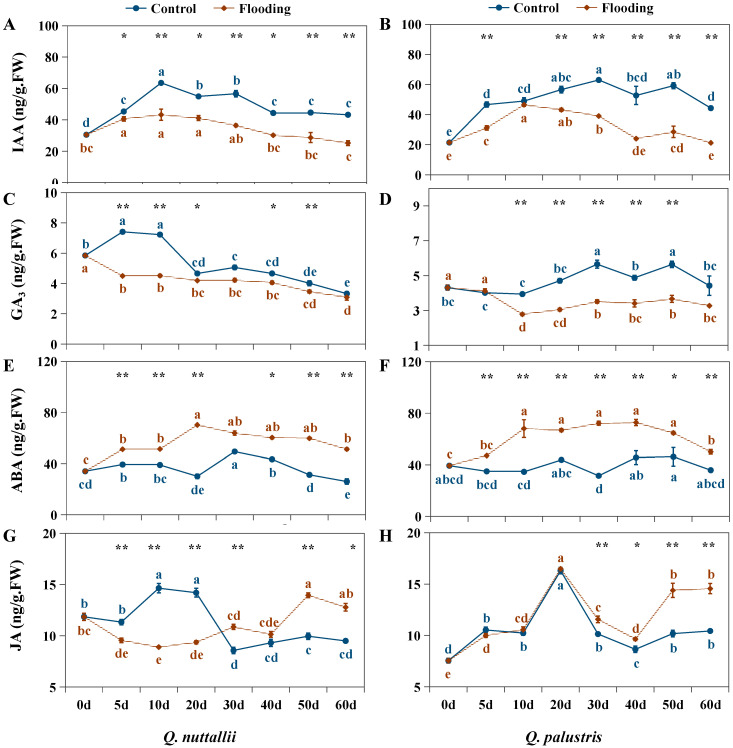
Flooding stress is an increasingly serious problem in wetlands, often affecting large areas of crops and timber production areas. The current study aimed to explore the species differences in responses to flooding stress between Q. nuttallii and Q. palustris in an outdoor environment. All the tested plants survived after a 60-day flooding treatment that left 5 cm of water above the soil surface. This suggests that the two species are flood-tolerant, so they can be applied in the construction of riparian protection forests and wetland restoration. Compared with control conditions, flooding treatment significantly decreased seedling height and diameter and the Pn, Gs, Tr, Fv/Fm, ABS/CSm, TR0/CSm, ET0/CSm, RE0/CSm, IAA, and GA3 content and significantly increased the content of MDA, H2O2, soluble sugars, SOD, POD, ADH, ABA, and JA. Under control conditions, Q. nuttallii showed significantly greater growth and photosynthetic capability than Q. palustris. In contrast, Q. palustris exhibited less inhibition of growth and photosynthesis, oxidative stress levels, and antioxidant enzyme activities than Q. nuttallii under flooding conditions. The findings indicate that Q. palustris has better defense mechanisms against the damage caused by flooding stress than Q. nuttallii. Q. nuttallii was more sensitive and responsive to flooding than Q. palustris.
Keywords: antioxidant defense; flooding stress; physiological response; phytohormone; quercus.
Conflict of interest statement
The authors declare no conflicts of interest.
Figures


Similar articles
-
Transcriptomic and physiological responses of Quercus acutissima and Quercus palustris to drought stress and rewatering.Front Plant Sci. 2024 Aug 6;15:1430485. doi: 10.3389/fpls.2024.1430485. eCollection 2024. Front Plant Sci. 2024. PMID: 39166236 Free PMC article.
-
Physiological, Epigenetic, and Transcriptome Analyses Provide Insights into the Responses of Wheat Seedling Leaves to Different Water Depths under Flooding Conditions.Int J Mol Sci. 2023 Nov 26;24(23):16785. doi: 10.3390/ijms242316785. Int J Mol Sci. 2023. PMID: 38069108 Free PMC article.
-
Co-planting of Quercus nuttallii, Quercus pagoda with Solanum nigrum enhanced their phytoremediation potential to multi-metal contaminated soil.Int J Phytoremediation. 2021;23(10):1104-1112. doi: 10.1080/15226514.2021.1878105. Epub 2021 Jan 27. Int J Phytoremediation. 2021. PMID: 33501836
-
Drought responses of flood-tolerant trees in Amazonian floodplains.Ann Bot. 2010 Jan;105(1):129-39. doi: 10.1093/aob/mcp258. Ann Bot. 2010. PMID: 19880423 Free PMC article. Review.
-
Riparian plant community responses to increased flooding: a meta-analysis.Glob Chang Biol. 2015 Aug;21(8):2881-90. doi: 10.1111/gcb.12921. Epub 2015 Jun 8. Glob Chang Biol. 2015. PMID: 25752818 Review.
References
-
- Luo F.-L., Matsubara S., Chen Y., Wei G.-W., Dong B.-C., Zhang M.-X., Yu F.-H. Consecutive Submergence and De-Submergence Both Impede Growth of a Riparian Plant during Water Level Fluctuations with Different Frequencies. Environ. Exp. Bot. 2018;155:641–649. doi: 10.1016/j.envexpbot.2018.08.015. - DOI
-
- Shen C., Yuan J., Qiao H., Wang Z., Liu Y., Ren X., Wang F., Liu X., Zhang Y., Chen X., et al. Transcriptomic and Anatomic Profiling Reveal the Germination Process of Different Wheat Varieties in Response to Waterlogging Stress. BMC Genet. 2020;21:93. doi: 10.1186/s12863-020-00901-y. - DOI - PMC - PubMed
-
- Zhang M., Zhang D., Qi Q., Tong S., Wang X., An Y., Lu X. Flooding Effects on Population and Growth Characteristics of Bolboschoenus planiculmis in Momoge Wetland, Northeast China. Ecol. Indic. 2022;137:108730. doi: 10.1016/j.ecolind.2022.108730. - DOI
-
- Striker G.G. Botany. Volume 1. Books on Demand GmbH; Norderstedt, Germany: 2012. Flooding Stress on Plants: Anatomical, Morphological and Physiological Responses; pp. 3–28. - DOI
Grants and funding
LinkOut - more resources
Full Text Sources
