

Recruitment and Aggregation Capacity of Tea Trees to Rhizosphere Soil Characteristic Bacteria Affects the Quality of Tea Leaves
- PMID: 38931118
- PMCID: PMC11207862
- DOI: 10.3390/plants13121686
Recruitment and Aggregation Capacity of Tea Trees to Rhizosphere Soil Characteristic Bacteria Affects the Quality of Tea Leaves
Abstract
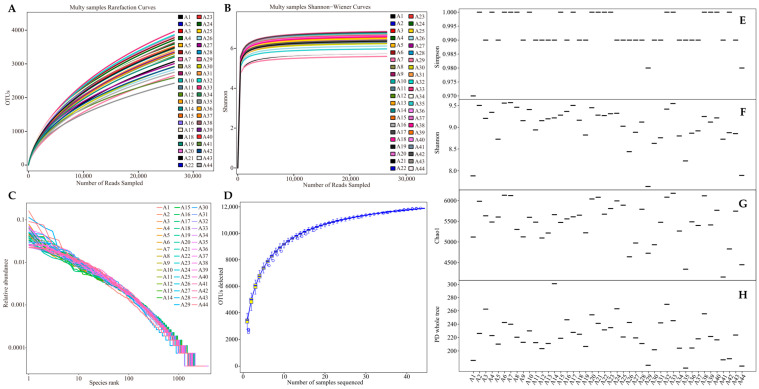
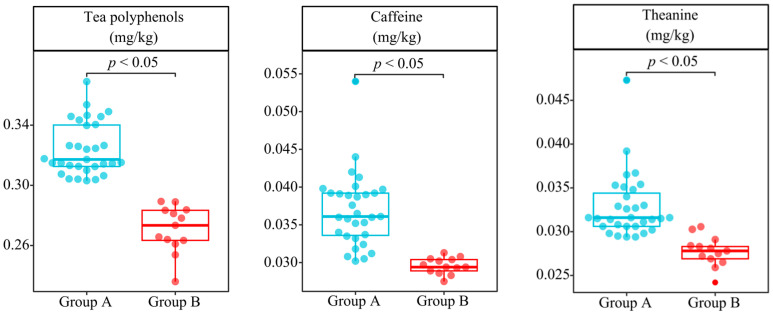
There are obvious differences in quality between different varieties of the same plant, and it is not clear whether they can be effectively distinguished from each other from a bacterial point of view. In this study, 44 tea tree varieties (Camellia sinensis) were used to analyze the rhizosphere soil bacterial community using high-throughput sequencing technology, and five types of machine deep learning were used for modeling to obtain characteristic microorganisms that can effectively differentiate different varieties, and validation was performed. The relationship between characteristic microorganisms, soil nutrient transformation, and tea quality formation was further analyzed. It was found that 44 tea tree varieties were classified into two groups (group A and group B) and the characteristic bacteria that distinguished them came from 23 genera. Secondly, the content of rhizosphere soil available nutrients (available nitrogen, available phosphorus, and available potassium) and tea quality indexes (tea polyphenols, theanine, and caffeine) was significantly higher in group A than in group B. The classification result based on both was consistent with the above bacteria. This study provides a new insight and research methodology into the main reasons for the formation of quality differences among different varieties of the same plant.
Keywords: characteristic bacteria; nutrients; quality; rhizosphere soil; tea tree.
Conflict of interest statement
The authors declare no conflicts of interest.
Figures


Similar articles
-
Analysis of rhizosphere soil microbial diversity and its functions between Dahongpao mother tree and cutting Dahongpao.Front Plant Sci. 2024 Sep 6;15:1444436. doi: 10.3389/fpls.2024.1444436. eCollection 2024. Front Plant Sci. 2024. PMID: 39309180 Free PMC article.
-
The Ability of Different Tea Tree Germplasm Resources in South China to Aggregate Rhizosphere Soil Characteristic Fungi Affects Tea Quality.Plants (Basel). 2024 Jul 24;13(15):2029. doi: 10.3390/plants13152029. Plants (Basel). 2024. PMID: 39124147 Free PMC article.
-
Dahongpao mother tree affects soil microbial community and nutrient cycling by increasing rhizosphere soil characteristic metabolite content.Front Plant Sci. 2025 May 26;16:1508622. doi: 10.3389/fpls.2025.1508622. eCollection 2025. Front Plant Sci. 2025. PMID: 40491818 Free PMC article.
-
A Review on Rhizosphere Microbiota of Tea Plant (Camellia sinensis L): Recent Insights and Future Perspectives.J Agric Food Chem. 2023 Dec 13;71(49):19165-19188. doi: 10.1021/acs.jafc.3c02423. Epub 2023 Nov 29. J Agric Food Chem. 2023. PMID: 38019642 Review.
-
Exploring tea (Camellia sinensis) microbiome: Insights into the functional characteristics and their impact on tea growth promotion.Microbiol Res. 2022 Jan;254:126890. doi: 10.1016/j.micres.2021.126890. Epub 2021 Oct 9. Microbiol Res. 2022. PMID: 34689100 Review.
Cited by
-
Effect of microbial diversity and their functions on soil nutrient cycling in the rhizosphere zone of Dahongpao mother tree and cutting Dahongpao.Front Plant Sci. 2025 May 8;16:1574020. doi: 10.3389/fpls.2025.1574020. eCollection 2025. Front Plant Sci. 2025. PMID: 40406725 Free PMC article.
-
Analysis of rhizosphere soil microbial diversity and its functions between Dahongpao mother tree and cutting Dahongpao.Front Plant Sci. 2024 Sep 6;15:1444436. doi: 10.3389/fpls.2024.1444436. eCollection 2024. Front Plant Sci. 2024. PMID: 39309180 Free PMC article.
-
Differences in bacterial community structure and metabolites between the root zone soil of the new high - Fragrance tea variety Jinlong No. 4 and its grandparent Huangdan.PLoS One. 2025 Feb 21;20(2):e0318659. doi: 10.1371/journal.pone.0318659. eCollection 2025. PLoS One. 2025. PMID: 39982964 Free PMC article.
References
Grants and funding
LinkOut - more resources
Full Text Sources
