. 2024 Jun 9;16(12):1816.
doi: 10.3390/nu16121816.

Modeling of Intracellular Taurine Levels Associated with Ovarian Cancer Reveals Activation of p53, ERK, mTOR and DNA-Damage-Sensing-Dependent Cell Protection

Affiliations

Modeling of Intracellular Taurine Levels Associated with Ovarian Cancer Reveals Activation of p53, ERK, mTOR and DNA-Damage-Sensing-Dependent Cell Protection

Daniel Centeno et al. Nutrients. .

Abstract

Taurine, a non-proteogenic amino acid and commonly used nutritional supplement, can protect various tissues from degeneration associated with the action of the DNA-damaging chemotherapeutic agent cisplatin. Whether and how taurine protects human ovarian cancer (OC) cells from DNA damage caused by cisplatin is not well understood. We found that OC ascites-derived cells contained significantly more intracellular taurine than cell culture-modeled OC. In culture, elevation of intracellular taurine concentration to OC ascites-cell-associated levels suppressed proliferation of various OC cell lines and patient-derived organoids, reduced glycolysis, and induced cell protection from cisplatin. Taurine cell protection was associated with decreased DNA damage in response to cisplatin. A combination of RNA sequencing, reverse-phase protein arrays, live-cell microscopy, flow cytometry, and biochemical validation experiments provided evidence for taurine-mediated induction of mutant or wild-type p53 binding to DNA, activation of p53 effectors involved in negative regulation of the cell cycle (p21), and glycolysis (TIGAR). Paradoxically, taurine's suppression of cell proliferation was associated with activation of pro-mitogenic signal transduction including ERK, mTOR, and increased mRNA expression of major DNA damage-sensing molecules such as DNAPK, ATM and ATR. While inhibition of ERK or p53 did not interfere with taurine's ability to protect cells from cisplatin, suppression of mTOR with Torin2, a clinically relevant inhibitor that also targets DNAPK and ATM/ATR, broke taurine's cell protection. Our studies implicate that elevation of intracellular taurine could suppress cell growth and metabolism, and activate cell protective mechanisms involving mTOR and DNA damage-sensing signal transduction.

Keywords: cell protection; fallopian tube cells; genotoxic stress; growth suppression; ovarian cancer cells; signal transduction; taurine.


Conflict of interest statement

The authors declare no conflicts of interest.

Figures

Figure 1
Figure 1
Modeling of intracellular taurine levels associated with OC in vitro. (A,B) Quantitative mass spectrometry workflow for the determination of free intracellular amino acid concentration in cells isolated from patient ascites; n = 6 patient samples. Data are reported as mean ± SD. (C) Mass spectrometry quantification of intracellular taurine concentration in FNE-m-p53 cells cultured in control media or media supplemented with 160 mM taurine. Each dot is one replicate. (D) Representative histograms and (E) quantification of cell death for FNE-m-p53 cells treated with 160 mM taurine or 10 μM cisplatin for 72 h. Viability was determined by propidium iodide (PI) staining and quantified using flow cytometry. n = 3 replicates. Data are reported as mean ± SD and were analyzed using a one-way ANOVA.
Figure 2
Figure 2
Intracellular taurine accumulation is mediated by the SLC6A6 transporter. (A) RT-q-PCR analysis of SLC6A6 mRNA expression in FNE-m-p53 cells transduced with scramble shRNA (pLKO) or SLC6A6 shRNA (G5 and G8). Each dot is one replicate. Statistical analysis was performed using a one-way ANOVA. (B) Western blot of SLC6A6 expression in FNE-m-p53 cells transduced with scramble shRNA or SLC6A6 shRNA G8. (C) Fold change in intracellular taurine content following treatment with control media or media containing 160 mM taurine for 72 h. Taurine concentration was determined using a Cell Biolabs taurine assay kit. Each dot is one replicate. Statistical analysis was performed using a one-way ANOVA comparing no taurine vs. taurine groups. The line indicates the median. (D) Mass spectrometry quantification of intracellular taurine content in cells treated with 160 mM taurine for 72 h. Each dot is one replicate.
Figure 3
Figure 3
Taurine supplementation suppresses the growth of OC cell lines. (A) Proliferation of OC cell lines was quantified by cell counting. OC cells were treated with 160 mM taurine for 72 h. Data were normalized to the mean cell count for each respective control group and are reported as mean ± SD. Each dot represents one replicate count. Statistical analysis was performed using Student’s t-test. (BD) Bright-field microscopy images of reconstituted basement membrane organotypic structures. The size of each structure was quantified based on area. Each dot represents one structure, and the bar is the mean. Statistical analysis was determined using Student’s t-test. Scale bars are 50 µm.
Figure 4
Figure 4
Taurine supplementation suppresses the growth of patient-derived organoids. (A) Low- and high- (inset) magnification bright-field images of entire wells representing three PDO cultures at day 0 and day 10. Inset scale bar is 200 μm. (B) Quantification of single organoid area at day 0 and day 10. Some 100–700 organoids were quantified per group. Each dot represents one organoid. (C) End-point measurement of ATP levels using a CellTiter-Glo® assay. Each dot represents a luminescence value recorded from one well. Unpaired, non-parametric two-tailed t-tests with Welch’s correction were used to determine the difference between groups.
Figure 5
Figure 5
Taurine promotes mutant and wild-type p53 binding to DNA and p53-mediated p21 activation. (A) Differential transcriptomic analysis of the TP53 gene pathway in FNE-m-p53 cell monolayers grown under normal conditions or in media supplemented with taurine. (B) Quantification of p53 binding to its response element using a p53 Transcription Factor Assay Kit (Cayman). For each cell line, data were normalized to the mean of the respective control group and are reported as a fold change. (C) Histogram representation of flow cytometry-based analysis of taurine-induced p21 promoter activation. Cells were transduced with a plasmid encoding mCherry cloned downstream of either EF1-α (CSII-mCherry) or the p21 promoter (p21-mCherry). (D) Western blots of p21 and p53 expression in OC cell lines expressing mutant or wild-type p53. (E) mRNA expression of various cyclin-dependent kinase inhibitors in FNE-m-p53 cells cultured in the absence or presence of taurine. Each dot is one replicate. Data were analyzed using a two-way ANOVA. (F) mRNA quantification and Western blot analysis of p21 expression in FNE-m-p53 cells cultured in taurine or valine. The p-value represents control vs. taurine as determined by a one-way ANOVA. (G) Western blots of p21 and p53 expression in FNE-m-p53 and FNE (WT p53) cell lines cultured in taurine following transduction with either scramble shRNA or p53 shRNA.
Figure 6
Figure 6
Taurine activates genes involved in the suppression of glycolysis and attenuates glycolytic capacity. (A) Enrichment analysis of transcripts corresponding to genes implicated in the regulation of glycolysis in FNE-m-p53 cells cultured in taurine. (B) Western blot of TIGAR and p21 expression in FNE-m-p53 cells cultured in the absence or presence of taurine. (C) Analysis of ECAR over time showing glycolysis and glycolytic capacity. (D) Bar graph shows average glycolytic capacity with standard deviations (maximal whiskers) across three experiments. An unpaired, two-tailed t-test was used to determine statistical differences between the means. 2-DG: 2-deoxy-D-glucose.
Figure 7
Figure 7
Taurine protects cells both mutant and wild-type p53 expressing cells from cisplatin-induced cell death and DNA damage. (A,B) Representative histograms and corresponding bar graphs of cell viability for FNE-m-p53 and FNE WT cells cultured in taurine, cisplatin, or combination for 72 h. Viability was determined by PI incorporation and quantified using flow cytometry. (C) Representative histograms and (D) quantification of phosphorylated γH2AX staining in FNE-m-p53 cells cultured in taurine, cisplatin, or both for 72 h. Each dot is one replicate. Data are normalized to the mean fluorescence of the control group. The p-value differentiates cisplatin vs. taurine + cisplatin, as determined by a one-way ANOVA. (E) Western blot of phosphorylated and total DNA-PKcs protein levels in FNE-m-p53 treated for 72 h in the indicated conditions. (F) Enrichment analysis of gene sets associated with cisplatin resistance published in the indicated studies [38,39,40,41]. Taurine treatment of FNE-m-p-53 cells positively correlates with cisplatin resistance.
Figure 8
Figure 8
Taurine-induced rescue from cisplatin is not p53-dependent. (A,B) Viability of FNE-m-p53 and FNE (WT p53) cell lines as determined by PI staining and quantified using flow cytometry. Cells were transduced with pLKO scramble shRNA or p53 shRNA and treated with taurine, cisplatin, or both for 72 h. Each dot represents one replicate. The p-values represent cisplatin vs. taurine + cisplatin for each respective shRNA and were determined by a one-way ANOVA. (C,D) Representative histograms from (A,B). The percentage of PI-positive cells is indicated.
Figure 9
Figure 9
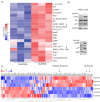
Proteomic and transcriptomic analysis of taurine response. (A) Reverse-phase protein array analysis of FNE-m-p53 cells treated with control culture media or media supplemented with 160 mM taurine. Arrows indicate mTOR activity (phosphorylated S6 ribosomal protein) and phosphorylated MAPK/ERK. (B) Western blot of phosphorylated S6 ribosomal protein and phosphorylated ERK for FNE-m-p53 treated with taurine. (C) RNA-seq heatmap for DNA damage response pathways for FNE-m-p53 cells treated with taurine. Arrows indicate PIKK family members PRKDC (DNAPK), ATM, and ATR.
Figure 10
Figure 10
Torin2 sensitizes taurine-treated cells to cisplatin. (A) Representative histograms and quantification of PI incorporation for FNE-m-p53 cells treated under the indicated conditions for 72 h. Cells were treated with Torin2 (1 μM) for four hours before exposure to cisplatin (10 μM). (B) Representative histograms and quantification of PI incorporation for OVCAR4 cells treated under the indicated conditions for 24 h. Data are reported as mean ± SD. p-values represent DMSO + cisplatin vs. DMSO + taurine + cisplatin and Torin2 + cisplatin vs. Torin2 + taurine + cisplatin. Statistical analysis was performed using a two-way ANOVA.
Figure 11
Figure 11
Schematic representing SLC6A6-mediated intracellular taurine accumulation and activation of cell signaling pathways involved in suppression of proliferation and glycolysis and response to DNA damage.

Update of

References

    1. Ansar M., Ranza E., Shetty M., Paracha S.A., Azam M., Kern I., Iwaszkiewicz J., Farooq O., Pournaras C.J., Malcles A., et al. Taurine treatment of retinal degeneration and cardiomyopathy in a consanguineous family with SLC6A6 taurine transporter deficiency. Hum. Mol. Genet. 2020;29:618–623. doi: 10.1093/hmg/ddz303. - DOI - PMC - PubMed
    1. Singh P., Gollapalli K., Mangiola S., Schranner D., Yusuf M.A., Chamoli M., Shi S.L., Lopes Bastos B., Nair T., Riermeier A., et al. Taurine deficiency as a driver of aging. Science. 2023;380:eabn9257. doi: 10.1126/science.abn9257. - DOI - PMC - PubMed
    1. Xu Y.J., Arneja A.S., Tappia P.S., Dhalla N.S. The potential health benefits of taurine in cardiovascular disease. Exp. Clin. Cardiol. 2008;13:57–65. - PMC - PubMed
    1. Jang H., Lee S., Choi S.L., Kim H.Y., Baek S., Kim Y. Taurine Directly Binds to Oligomeric Amyloid-beta and Recovers Cognitive Deficits in Alzheimer Model Mice. Pt 1Adv. Exp. Med. Biol. 2017;975:233–241. doi: 10.1007/978-94-024-1079-2_21. - DOI - PubMed
    1. Kim K.S., Oh D.H., Kim J.Y., Lee B.G., You J.S., Chang K.J., Chung H.J., Yoo M.C., Yang H.I., Kang J.H., et al. Taurine ameliorates hyperglycemia and dyslipidemia by reducing insulin resistance and leptin level in Otsuka Long-Evans Tokushima fatty (OLETF) rats with long-term diabetes. Exp. Mol. Med. 2012;44:665–673. doi: 10.3858/emm.2012.44.11.075. - DOI - PMC - PubMed

MeSH terms