Comparative Study
. 2024 Jun 11;16(12):1824.
doi: 10.3390/nu16121824.

A Cross-Sectional Validation Study of Camry EH101 versus JAMAR Plus Handheld Dynamometers in Colorectal Cancer Patients and Their Correlations with Bioelectrical Impedance and Nutritional Status

Affiliations
Comparative Study

A Cross-Sectional Validation Study of Camry EH101 versus JAMAR Plus Handheld Dynamometers in Colorectal Cancer Patients and Their Correlations with Bioelectrical Impedance and Nutritional Status

Andrés Jiménez-Sánchez et al. Nutrients. .

Abstract

Background: Reduced muscle strength (dynapenia) and mass (atrophy) are prognostic factors in oncology. Measuring maximal handgrip strength with dynamometers is feasible but limited by the cost of the reference device (JAMAR).

Methods: A cross-sectional study was conducted on colorectal cancer outpatients treated with chemotherapy or under active surveillance in our center from September 2022 to July 2023. Accuracy, reliability, and concordance were compared for two handheld dynamometers: the JAMAR Plus (the gold-standard device) and the Camry EH101 (a low-cost index device). A simultaneous nutritional diagnosis with GLIM criteria and bioelectrical impedance analysis (BIA) was carried out.

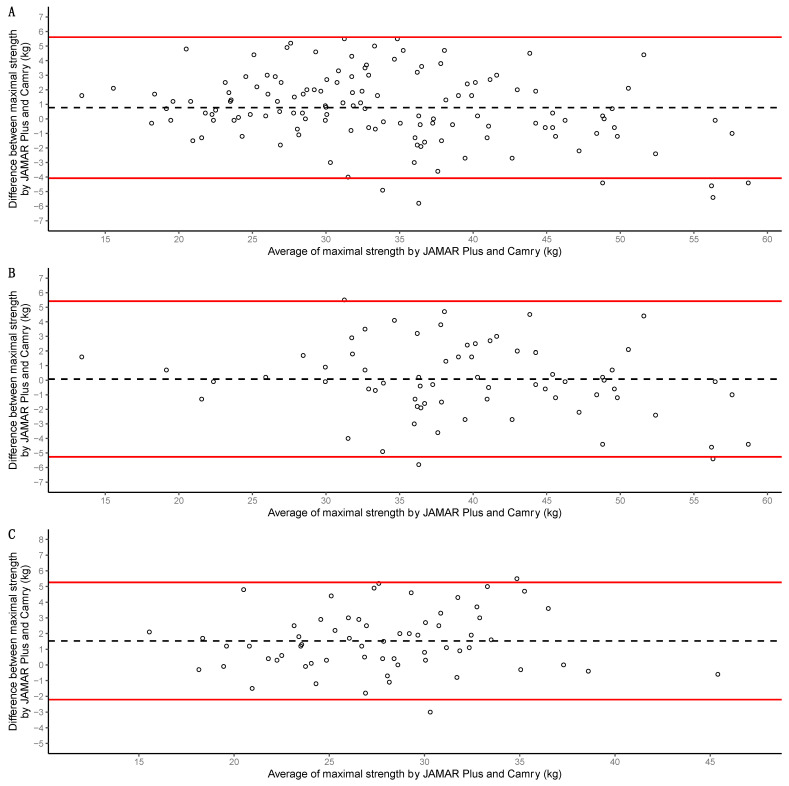
Results: A total of 134 participants were included. The median of maximal strength for the JAMAR Plus had a non-significant difference of 1.4 kg from the Camry EH101. The accuracy and reliability of the devices were high. Bland-Altman analysis showed a 0.8 kg bias and -4.1 to 5.6 kg limits of agreement (LoA); a 0.1 kg bias and -5.3 to 5.4 kg LoA in men; a 1.5 kg bias and -2.2 to 5.3 kg LoA in women. In total, 29.85% of the participants were malnourished. Prevalence of dynapenia increased from 3.67% with the JAMAR Plus to 5.14% with the Camry EH101. Both devices had a moderate and significant correlation with BIA-estimated muscle mass.

Conclusions: The Camry EH101 was a cost-effective alternative to JAMAR Plus in our sample.

Keywords: Camry; GLIM criteria; JAMAR; Smedley; bioelectrical impedance; colorectal cancer; dynamometer; handgrip strength; morphofunctional assessment; muscle mass.


Conflict of interest statement

The authors declare no conflicts of interest.

Figures

Figure 1
Figure 1
Simple linear regression of maximal handgrip strength (A) and average handgrip strength (B) between JAMAR Plus and Camry handheld dynamometers. The perfect bisector of interdevice regression is shown as a solid red line, and the linear regression model between the devices is shown as a solid blue line.
Figure 2
Figure 2
Box-and-whisker plots with overlapping geometries of points to represent the distribution of maximal strength in the sample: overall sample in (A); data grouped by sex in (B). Type of handheld dynamometer on the X-axis; maximal strength (in kg) on the Y-axis. The p-value of the median difference for maximal strength according to the type of dynamometer used (JAMAR Plus or Camry) is shown in square brackets. The dashed grey lines join the results of the same participants according to their identification numbers.
Figure 3
Figure 3
Box-and-whisker plots with overlapping geometries of points to represent the average strength distribution in the sample: overall sample in (A); data faceted by sex in (B). Type of handheld dynamometer on the X-axis; maximal strength (in kg) on the Y-axis. The p-value of the median difference for maximal strength according to the type of dynamometer used is shown in square brackets. The dashed grey lines join the results of the same participants according to their identification numbers.
Figure 4
Figure 4
Histograms of the mean strength differences between dynamometers: overall sample in (A); data grouped by sex in (B). Absolute differences expressed in kg on the X-axis; absolute frequencies presented on the Y-axis.
Figure 5
Figure 5
Bland–Altman analyses of the whole sample in (A), of the men in (B), and of the women in (C). Maximal handgrip strength for both devices (JAMAR Plus and Camry EH101) was used for calculations. Averages of maximal handgrip strength for both devices presented on the X-axis; differences in maximal handgrip strength for both devices presented on the Y-axis. Individual measurements are shown as empty circles; biases are represented as black dashed lines; upper and lower limits of agreement are shown as red solid lines.
Figure 6
Figure 6
BIVA analysis of the sample. Resistance (R) divided by height (H) and expressed in ohm/meters on the X-axis; reactance (Xc) divided by height (H) and expressed in ohm/meters on the Y-axis. Confidence ellipses corresponding to p50, p75, and p95 in the reference population are depicted in green (p50), yellow (p75), and red (p95). (A) Presence (red) or absence (green) of dynapenia is color-coded according to p10 values of Dodds et al. [45], according to maximal strength (in kg) as determined by the JAMAR Plus. (B) Presence (red) or absence (green) of dynapenia is color-coded according to p10 values of Dodds et al. [45], according to maximal strength (in kg) as determined by the Camry device. (C) Presence (red) or absence (green) of muscle atrophy is color-coded according to the Janssen et al. [52] equation with cutoff points from Masanés et al. [49]. Note how n = 33 (94.28% of people with muscle atrophy) appear in the lean quadrant and n = 2 appear in the cachexia quadrant. (D) Presence (red) or absence (green) of an unfavorable standardized phase angle (defined as < −1.65 standard deviations with respect to the reference population) is color-coded. Note how the majority of participants with an unfavorable phase angle are located in the cachexia quadrant (n = 18, 56.25%).

References

    1. Prado C.M., Purcell S.A., Laviano A. Nutrition Interventions to Treat Low Muscle Mass in Cancer. J. Cachexia Sarcopenia Muscle. 2020;11:366–380. doi: 10.1002/jcsm.12525. - DOI - PMC - PubMed
    1. Meyer H.-J., Strobel A., Wienke A., Surov A. Prognostic Role of Low-Skeletal Muscle Mass on Staging Computed Tomography in Metastasized Colorectal Cancer: A Systematic Review and Meta-Analysis. Clin. Colorectal Cancer. 2022;21:e213–e225. doi: 10.1016/j.clcc.2022.03.005. - DOI - PubMed
    1. van Baar H., Winkels R.M., Brouwer J.G.M., Posthuma L., Bours M.J.L., Weijenberg M.P., Boshuizen H.C., van Zutphen M., van Duijnhoven F.J.B., Kok D.E., et al. Associations of Abdominal Skeletal Muscle Mass, Fat Mass, and Mortality among Men and Women with Stage I-III Colorectal Cancer. Cancer Epidemiol. Biomark. Prev. 2020;29:956–965. doi: 10.1158/1055-9965.EPI-19-1134. - DOI - PubMed
    1. Shirdel M., Andersson F., Myte R., Axelsson J., Rutegård M., Blomqvist L., Riklund K., van Guelpen B., Palmqvist R., Gylling B. Body Composition Measured by Computed Tomography Is Associated with Colorectal Cancer Survival, Also in Early-Stage Disease. Acta Oncol. 2020;59:799–808. doi: 10.1080/0284186X.2020.1744716. - DOI - PubMed
    1. Derksen J.W.G., Kurk S.A., Peeters P.H.M., Dorresteijn B., Jourdan M., van der Velden A.M.T., Nieboer P., de Jong R.S., Honkoop A.H., Punt C.J.A., et al. The Association between Changes in Muscle Mass and Quality of Life in Patients with Metastatic Colorectal Cancer. J. Cachexia Sarcopenia Muscle. 2020;11:919–928. doi: 10.1002/jcsm.12562. - DOI - PMC - PubMed