Meta-Analysis
. 2024 Jun 18;16(12):1919.
doi: 10.3390/nu16121919.

Effects of Cocoa Consumption on Cardiometabolic Risk Markers: Meta-Analysis of Randomized Controlled Trials

Affiliations
Meta-Analysis

Effects of Cocoa Consumption on Cardiometabolic Risk Markers: Meta-Analysis of Randomized Controlled Trials

Tainah O P Arisi et al. Nutrients. .

Abstract

Background: We conducted a systematic review and meta-analysis to examine the effect of dietary intake of cocoa on anthropometric measurements, lipid and glycemic profiles, and blood pressure levels in adults, with and without comorbidities.

Methods: The databases used were MEDLINE (PubMed), EMBASE, Web of Science, Cochrane, LILACS, and SciELO. The eligible studies were randomized clinical trials (RCTs) involving adults undergoing cocoa consumption (cocoa extract or ≥70% cocoa dark chocolate) for ≥4 weeks that evaluated at least one of the following markers: body weight, body mass index (BMI), waist/abdominal circumference, total cholesterol, LDL-c, triglycerides, HDL-c, blood glucose, glycated hemoglobin (HbA1c), and systolic and diastolic blood pressure (SBP/DBP).

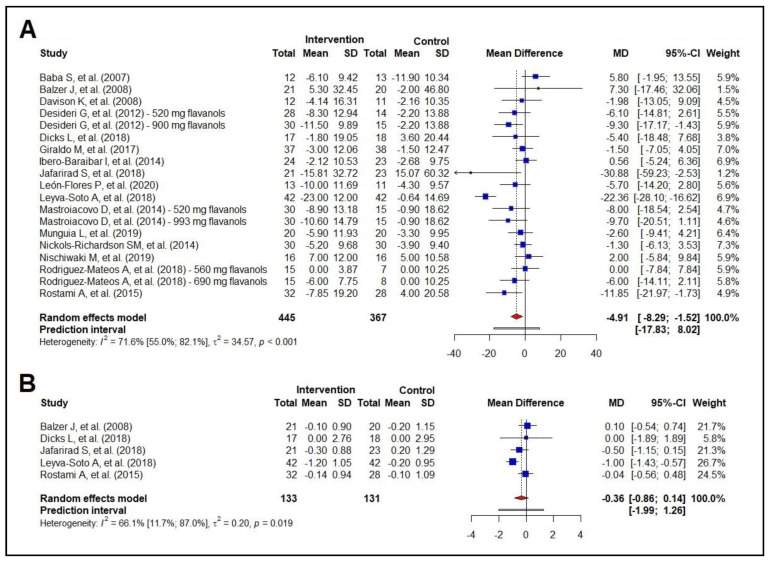
Results: Thirty-one studies were included, totaling 1986 participants. Cocoa consumption showed no effects on body weight, BMI, waist circumference, triglycerides, HDL-c and HbA1c. Yet, there was a reduction in total cholesterol (-8.35 mg/dL, 95% CI -14.01; -2.69 mg/dL), LDL-c (-9.47 mg/dL, 95% CI -13.75; -5.20 mg/dL), fasting blood glucose (-4.91 mg/dL, 95% CI -8.29; -1.52 mg/dL), SBP (-2.52 mmHg, 95% CI -4.17; -0.88 mmHg), and DBP (-1.58 mmHg, 95% CI -2.54; -0.62 mmHg).

Conclusions: The consumption of cocoa showed protective effects on major cardiometabolic risk markers that have a clinical impact in terms of cardiovascular risk reduction.

Keywords: blood pressure; cocoa; dyslipidemia; fasting glucose; obesity; polyphenols.


Conflict of interest statement

The authors declare no conflicts of interest.

Figures

Figure 1
Figure 1
Flowchart of the study selection process.
Figure 2
Figure 2
Forest plot summarizing the results from the meta-analysis regarding the effects of cocoa consumption on anthropometric measurements versus control group. Panel (A): body weight: Ayoobi et al. 2017 [35]; Balzer et al. 2008 [53]; Desideri et al. 2012 [38]; Dicks et al. 2018 [32]; Giraldo et al. 2017 [50]; Ibero-Baraibar et al. 2014 [34]; León-Flores et al. 2020 [51]; Mastroiacovo et al. 2015 [39]; Munguia et al. 2019 [45]; Neufingerl et al 2013 [49]; Nickols-Richardson et al. 2014 [46]. panel (B): body mass index: Ayoobi et al. 2017 [35]; Baba et al. 2007 [37]; Balzer et al. 2008 [53]; Crews et al. 2008 [57]; Davison et al. 2008 [40]; Desideri et al. 2012 [38]; Dicks et al. 2018 [32]; Giraldo et al. 2017 [50]; León-Flores et al. 2020 [51]; Leyva-Soto et al. 2018 [58]; Mastroiacovo et al. 2015 [39]; Munguía et al. 2015 [44]; Nickols-Richardson et al. 2014 [46]; Nishiwaki et al. 2019 [41]; Pereira et al. 2019 [33]. panel (C): waist circumference: Ayoobi et al. 2017 [35]; Balzer et al. 2008 [53]; Davison et al. 2008 [40]; Dicks et al. 2018 [32]; Ibero-Baraibar et al. 2014 [34]; León-Flores et al. 2020 [51]; Munguia et al. 2019 [45]; Nickols-Richardson et al. 2014 [46]; Nishiwaki et al. 2019 [41]. panel (D): abdominal circumference: Giraldo et al. 2017 [50]; Leyva-Soto et al. 2018 [58]; Munguía et al. 2015 [44].
Figure 3
Figure 3
Forest plot summarizing the results from the meta-analysis regarding the effects of cocoa consumption on lipid profile versus control group. Panel (A): total cholesterol; panel (B): low-density lipoprotein cholesterol (LDL-c). Baba et al. 2007 [37]; Baba et al. 2007 [36]; Balzer et al. 2008 [53]; Crews et al. 2008 [57]; Desideri et al. 2012 [38]; Dicks et al. 2018 [32]; Giraldo et al. 2017 [50]; Ibero-Baraibar et al. 2014 [34]; Jafarirad et al. 2018 [52]; León-Flores et al. 2020 [51]; Leyva-Soto et al. 2018 [58]; Mastroiacovo et al. 2015 [39]; Munguia et al. 2019 [45]; Naghdipour-Biregani et al. 2014 [54]; Neufingerl et al 2013 [49]; Nickols-Richardson et al. 2014 [46]; Parsaeyan et al. 2014 [56]; Polagruto et al. 2006 [55]; Rodriguez-Mateos et al. 2018 [47]; Rostami et al. 2015 [42]; Sansone et al. 2015 [48]. panel (C): triglycerides; Baba et al. 2007 [37]; Baba et al. 2007 [36]; Balzer et al. 2008 [53]; Crews et al. 2008 [57]; Davison et al. 2008 [40]; Desideri et al. 2012 [38]; Dicks et al. 2018 [32]; Giraldo et al. 2017 [50]; Ibero-Baraibar et al. 2014 [34]; Jafarirad et al. 2018 [52]; León-Flores et al. 2020 [51]; Leyva-Soto et al. 2018 [58]; Mastroiacovo et al. 2015 [39]; Munguia et al. 2019 [45]; Naghdipour-Biregani et al. 2014 [54]; Neufingerl et al 2013 [49]; Nickols-Richardson et al. 2014 [46]; Parsaeyan et al. 2014 [56]; Polagruto et al. 2006 [55]; Rodriguez-Mateos et al. 2018 [47]; Rostami et al. 2015 [42]; and panel (D): high-density lipoprotein cholesterol (HDL-c). Panel (A,D): Baba et al. 2007 [37]; Baba et al. 2007 [36]; Balzer et al. 2008 [53]; Crews et al. 2008 [57]; Davison et al. 2008 [40]; Desideri et al. 2012 [38]; Dicks et al. 2018 [32]; Giraldo et al. 2017 [50]; Ibero-Baraibar et al. 2014 [34]; Jafarirad et al. 2018 [52]; León-Flores et al. 2020 [51]; Leyva-Soto et al. 2018 [58]; Mastroiacovo et al. 2015 [39]; Munguia et al. 2019 [45]; Naghdipour-Biregani et al. 2014 [54]; Neufingerl et al 2013 [49]; Nickols-Richardson et al. 2014 [46]; Parsaeyan et al. 2014 [56]; Polagruto et al. 2006 [55]; Rodriguez-Mateos et al. 2018 [47]; Rostami et al. 2015 [42]; Sansone et al. 2015 [48].
Figure 4
Figure 4
Forest plot summarizing the results from the meta-analysis regarding the effects of cocoa consumption on glycemic markers versus control group. Panel (A): fasting blood glucose, Baba et al. 2007 [37]; Balzer et al. 2008 [53]; Davison et al. 2008 [40]; Desideri et al. 2012 [38]; Dicks et al. 2018 [32]; Giraldo et al. 2017 [50]; Ibero-Baraibar et al. 2014 [34]; Jafarirad et al. 2018 [52]; León-Flores et al. 2020 [51]; Leyva-Soto et al. 2018 [58]; Mastroiacovo et al. 2015 [39]; Munguia et al. 2019 [45]; Nickols-Richardson et al. 2014 [46]; Nishiwaki et al. 2019 [41]; Rodriguez-Mateos et al. 2018 [47]; Rostami et al. 2015 [42]; panel (B): glycated hemoglobin. Balzer et al. 2008 [53]; Dicks et al. 2018 [32]; Jafarirad et al. 2018 [52]; Leyva-Soto et al. 2018 [58]; Rostami et al. 2015 [42].
Figure 5
Figure 5
Forest plot summarizing the results from the meta-analysis regarding the effects of cocoa consumption on blood pressure versus control group. Panel (A): systolic blood pressure. Ayoobi et al. 2017 [35]; Baba et al. 2007 [37]—26 g; Crews et al. 2008 [57]; Davison et al. 2008 [40]; Desch et al. 2010 [43]; Desideri et al. 2012 [38]; Dicks et al. 2018 [32]; Ibero-Baraibar et al. 2014 [34]; Leyva-Soto et al. 2018 [58]; Massee et al. 2015 [30]; Mastroiacovo et al. 2015 [39]; Mozaffari-Khosravi et al. 2016 [29]; Munguía et al. 2015 [44]; Neufingerl et al 2013 [49]; Nickols-Richardson et al. 2014 [46]; Nishiwaki et al. 2019 [41]; Ottaviani et al. 2015 [31]; Pereira et al. 2019 [33]; Rodriguez-Mateos et al. 2018 [47]; Rostami et al. 2015 [42]; Sansone et al. 2015 [48]; panel (B): diastolic blood pressure. Ayoobi et al. 2017 [35]; Baba et al. 2007 [37]—26 g; Crews et al. 2008 [57]; Davison et al. 2008 [40]; Desch et al. 2010 [43]; Desideri et al. 2012 [38]; Dicks et al. 2018 [32]; Ibero-Baraibar et al. 2014 [34]; Leyva-Soto et al. 2018 [58]; Massee et al. 2015 [30]; Mastroiacovo et al. 2015 [39]; Mozaffari-Khosravi et al. 2016 [29]; Munguía et al. 2015 [44]; Neufingerl et al 2013 [49].

References

    1. Oliveira G., Brant L., Polanczyk C., Malta D., Biolo A., Nascimento B., Souza M., Lorenzo A., Fagundes Júnior A., Schaan B., et al. Estatística Cardiovascular–Brasil 2021. Arq. Bras. Cardiol. 2022;118:115–373. doi: 10.36660/abc.20211012. - DOI - PMC - PubMed
    1. Mahmood S.S., Levy D., Vasan R.S., Wang T.J. The Framingham Heart Study and the epidemiology of cardiovascular disease: A historical perspective. Lancet. 2014;383:999–1008. doi: 10.1016/s0140-6736(13)61752-3. - DOI - PMC - PubMed
    1. D’Agostino R.B., Vasan R.S., Pencina M.J., Wolf P.A., Cobain M., Massaro J.M., Kannel W.B. General cardiovascular risk profile for use in primary care: The Framingham Heart Study. Circulation. 2008;117:743–753. doi: 10.1161/circulationaha.107.699579. - DOI - PubMed
    1. Parretti H.M., Jebb S.A., Johns D.J., Lewis A.L., Christian-Brown A.M., Aveyard P. Clinical effectiveness of very-low-energy diets in the management of weight loss: A systematic review and meta-analysis of randomized controlled trials. Obes. Rev. 2016;17:225–234. doi: 10.1111/obr.12366. - DOI - PubMed
    1. Sofi F., Dinu M., Pagliai G., Cesari F., Gori A.M., Sereni A., Becatti M., Fiorillo C., Marcucci R., Casini A. Low-Calorie Vegetarian Versus Mediterranean Diets for Reducing Body Weight and Improving Cardiovascular Risk Profile: CARDIVEG Study (Cardiovascular Prevention With Vegetarian Diet) Circulation. 2018;137:1103–1113. doi: 10.1161/CIRCULATIONAHA.117.030088. - DOI - PubMed

MeSH terms