Review
. 2024 Jun 6;17(6):744.
doi: 10.3390/ph17060744.

Dichloroacetate for Cancer Treatment: Some Facts and Many Doubts

Affiliations
Review

Dichloroacetate for Cancer Treatment: Some Facts and Many Doubts

Tomas Koltai et al. Pharmaceuticals (Basel). .

Abstract

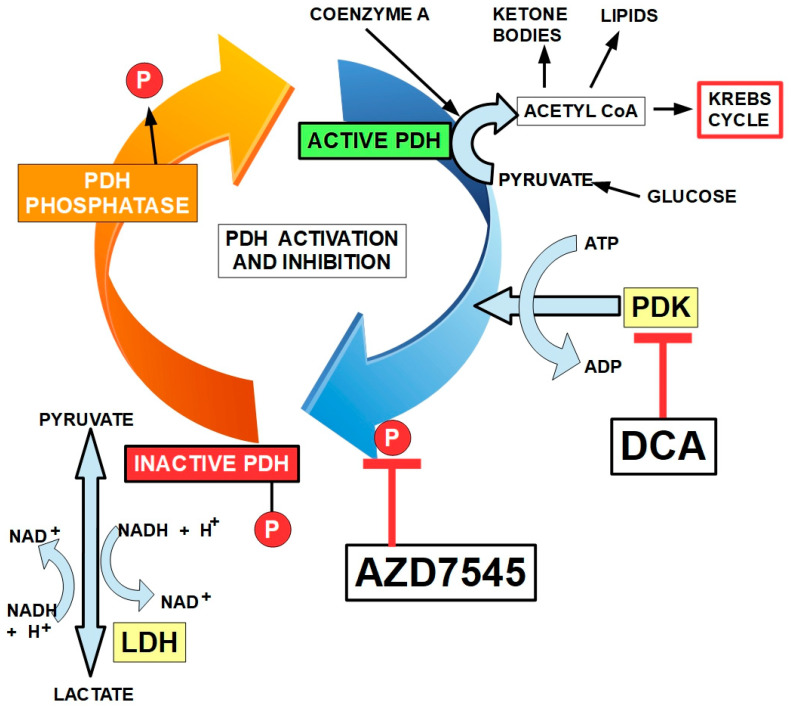
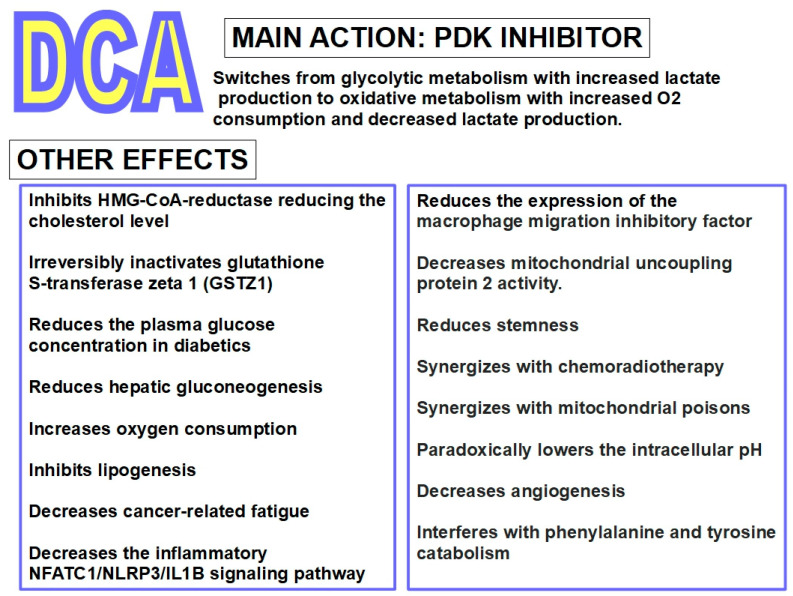
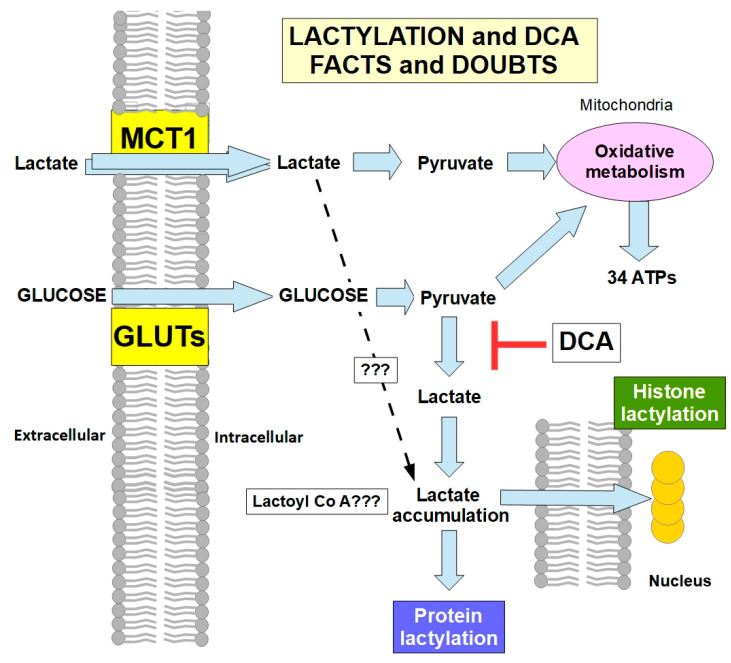
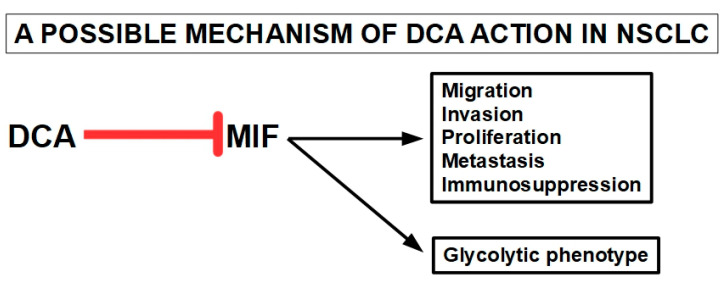
Rarely has a chemical elicited as much controversy as dichloroacetate (DCA). DCA was initially considered a dangerous toxic industrial waste product, then a potential treatment for lactic acidosis. However, the main controversies started in 2008 when DCA was found to have anti-cancer effects on experimental animals. These publications showed contradictory results in vivo and in vitro such that a thorough consideration of this compound's in cancer is merited. Despite 50 years of experimentation, DCA's future in therapeutics is uncertain. Without adequate clinical trials and health authorities' approval, DCA has been introduced in off-label cancer treatments in alternative medicine clinics in Canada, Germany, and other European countries. The lack of well-planned clinical trials and its use by people without medical training has discouraged consideration by the scientific community. There are few thorough clinical studies of DCA, and many publications are individual case reports. Case reports of DCA's benefits against cancer have been increasing recently. Furthermore, it has been shown that DCA synergizes with conventional treatments and other repurposable drugs. Beyond the classic DCA target, pyruvate dehydrogenase kinase, new target molecules have also been recently discovered. These findings have renewed interest in DCA. This paper explores whether existing evidence justifies further research on DCA for cancer treatment and it explores the role DCA may play in it.

Keywords: cancer; dichloroacetate; glioma; lactic acidosis; pyruvate dehydrogenase; pyruvate dehydrogenase kinase; pyruvate dehydrogenase phosphatase.


Conflict of interest statement

The authors declare no conflicts of interest.

Figures

Figure 7
Figure 7
Carbohydrate metabolism in cancer cells. PDK is controlled by the HIF (hypoxia-inducible factor) complex. Upregulation of PDK results in PDH inhibition and elevated aerobic glycolysis and lactic acid levels (see also Section 2.2).
Figure 8
Figure 8
Glucose metabolism in normal cells (oxidative metabolism, left side) and in cancer cells (glycolytic metabolism, right side). In normal cells, the chemical end products are CO2 and H2O. In cancer cells, the end product is lactic acid, which is extruded from the cell through MCTs. The activity of PDH is the cornerstone that defines which way metabolism will go. In this case, mitochondrial PDH irreversibly decarboxylates pyruvate to acetyl-coenzyme A, linking glycolysis to the tricarboxylic acid cycle (left panel). This is a critical step in carbohydrate metabolism where a decision point is reached: the glycolytic or oxidative pathway. If PDH is inhibited by phosphorylation by PDK (right panel), pyruvate will be taken care of by the glycolytic pathway. An important fact is that malignant cells show 2-to-20-fold higher glucose intake, which means an average 60-fold increase in lactate production. When this lactate is extruded, it has an impact on extracellular acidity. However, lactate does not seem to be the main cause of extracellular acidity (Figure 9).
Figure 1
Figure 1
The first evidence of DCA’s antitumor effects and its mechanisms. Plas and Thompson have shown that glycolytic metabolism increased resistance to apoptosis [72].
Figure 2
Figure 2
DCA is produced by many laboratories and is sold over the counter. The quality of the product from these laboratories is not well established. This explains many of the doubts about DCA’s real value as a therapeutic tool.
Figure 3
Figure 3
Chemical structure of DCA, also known as dichloroethanoic acid. It is a halogenated carboxylic acid and a structural analog of pyruvate. The lower panel shows its metabolization to glyoxylate by the enzyme glutathione transferase zeta 1 (GSTZ1), also known as maleylacetoacetate isomerase (MAAI). GSTZ1 dechlorinates DCA and GSTZ1 genetic variations influence the metabolic rate of DCA processing [75]. Glyoxylate is oxidized to oxalate, which is excreted in the urine. DCA has a high oral bioavailability [76].
Figure 4
Figure 4
The PDH enzymatic complex introduces pyruvate into the Krebs cycle after removing a molecule of CO2 and binding it to coenzyme A, forming acetyl-CoA.
Figure 5
Figure 5
Differences in DCA potency according to the PDK isoform.
Figure 6
Figure 6
Pathway of pyruvic acid in normal cells during normoxia.
Figure 9
Figure 9
Mechanism of the regulation of PDH (pyruvate dehydrogenase) by PDK (pyruvate dehydrogenase kinase). PDK phosphorylates PDH and inactivates it. PDH phosphatase de-phosphorylates PDH and activates the enzyme. Two different mechanisms of PDK inhibition are shown: DCA and AZD7545 [108]. DCA binding to PDK1 induces local conformational changes that inactivate the kinase activity. Radicicol, another PDK inhibitor, binds to the ATP-binding pocket of PDK3. Inactivated PDH may have up to three phosphorylated sites. Only one is shown in the diagram.
Figure 10
Figure 10
Summary of DCA’s multiple pharmacological effects, many of which stem from PDK inhibition. These include effects on lipid and glucose metabolism, cell stemness, angiogenesis, and pH. The summary is based on references [119,120,121,122,123,124,125,126,127].
Figure 11
Figure 11
Histone and protein lactylation in cancer and their prevention by DCA are facts supported by evidence [145]. However, there are still certain questions and unknowns. These include the following:
Figure 12
Figure 12
DCA modifies glycolytic metabolism and decreases tumor growth in mice with NSCLC cell xenografts. The DCA-induced downregulation of MIF seems to be an essential antitumor mechanism of this compound in this tumor type.
Figure 13
Figure 13
Schematic diagram of activated pathways of the most frequently found mutations in HNSCC and their proglycolytic pathways. Red boxes represent the average percentage of frequency of occurrence of these mutations. EGFR has the highest frequency and is the usual driver gene [284]. Inactivating mutations in the tumor suppressor TP53 deregulate its antiglycolytic effects [285]. Notch signaling recruits hexokinase to the mitochondrial membrane, promoting glycolysis. Inactivating mutations of Notch can also promote glycolysis by depressing oxidative phosphorylation [286,287,288].
Figure 14
Figure 14
Proposed structure of SMCT1 illustrating the compounds it can transport into the cell on the left side and inhibitors of transport on the right.
Figure 15
Figure 15
Proposed mechanism by which inhibition of PDK and complex I increases ROS levels and creates oxidative stress. Mitochondria release high levels of superoxide in the presence of electron transport chain (ETC) inhibitors. The figure is based on references [339] and [340] but is controversial. According to Wheaton et al. [341], metformin does not increase the production of reactive oxygen species [342,343], while rotenone does. However, other research shows increased ROS production with metformin [344]. Therefore, the explanation for the synergy between DCA and metformin is still in question. According to other authors, metformin inhibits complex I through ubiquinone inhibition but stimulates ROS production through flavin in complex I [345].
Figure 16
Figure 16
Chemical formula of diisopropyl dichloroacetate.
Figure 17
Figure 17
Chemical structures of four different experimental DCA derivatives that have shown increased cytotoxic effects. The DCA moieties are circled.
Figure 18
Figure 18
The figure illustrates the maximum tolerable DCA concentration that can be reached safely in humans with the administration of a high but safe dose (left line). The peak concentration can only be maintained for a short time. The few in vitro experiments that showed cytostatic effects were performed with concentrations between 1 and 2 mM (center panel). Most in vitro experiments published in the literature were carried out with concentrations above 10 mM and up to 50 mM (right bar). These may have also shown cytotoxic effects.

Similar articles

Cited by

References

    1. Warburg O., Wind F., Negelein E. The metabolism of tumors in the body. J. Gen. Physiol. 1927;8:519–530. doi: 10.1085/jgp.8.6.519. - DOI - PMC - PubMed
    1. Warburg O. On the Origin of Cancer Cells. Science. 1956;123:309–314. doi: 10.1126/science.123.3191.309. - DOI - PubMed
    1. Hsu P.P., Sabatini D.M. Cancer Cell Metabolism: Warburg and Beyond. Cell. 2008;134:703–707. doi: 10.1016/j.cell.2008.08.021. - DOI - PubMed
    1. Pavlova N.N., Thompson C.B. The Emerging Hallmarks of Cancer Metabolism. Cell Metab. 2016;23:27–47. doi: 10.1016/j.cmet.2015.12.006. - DOI - PMC - PubMed
    1. Carracedo A., Cantley L.C., Pandolfi P.P. Cancer metabolism: Fatty acid oxidation in the limelight. Nat. Rev. Cancer. 2013;13:227–232. doi: 10.1038/nrc3483. - DOI - PMC - PubMed

LinkOut - more resources