

Inhibition of SARS-CoV-2-Induced NLRP3 Inflammasome-Mediated Lung Cell Inflammation by Triphala-Loaded Nanoparticle Targeting Spike Glycoprotein S1
- PMID: 38931873
- PMCID: PMC11206841
- DOI: 10.3390/pharmaceutics16060751
Inhibition of SARS-CoV-2-Induced NLRP3 Inflammasome-Mediated Lung Cell Inflammation by Triphala-Loaded Nanoparticle Targeting Spike Glycoprotein S1
Abstract
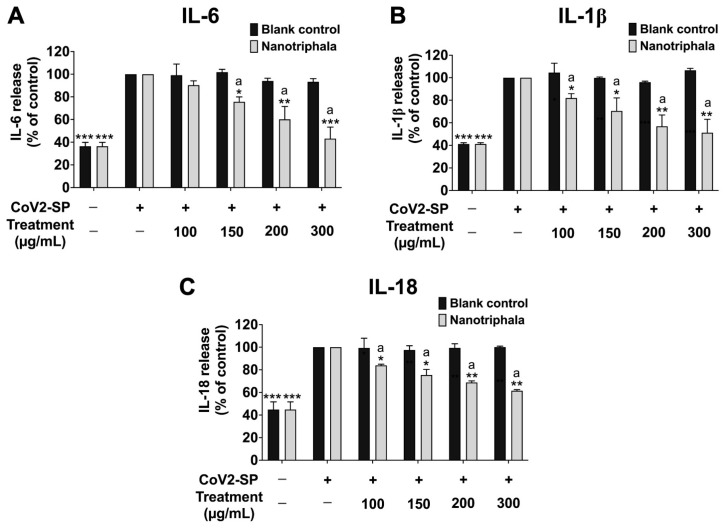
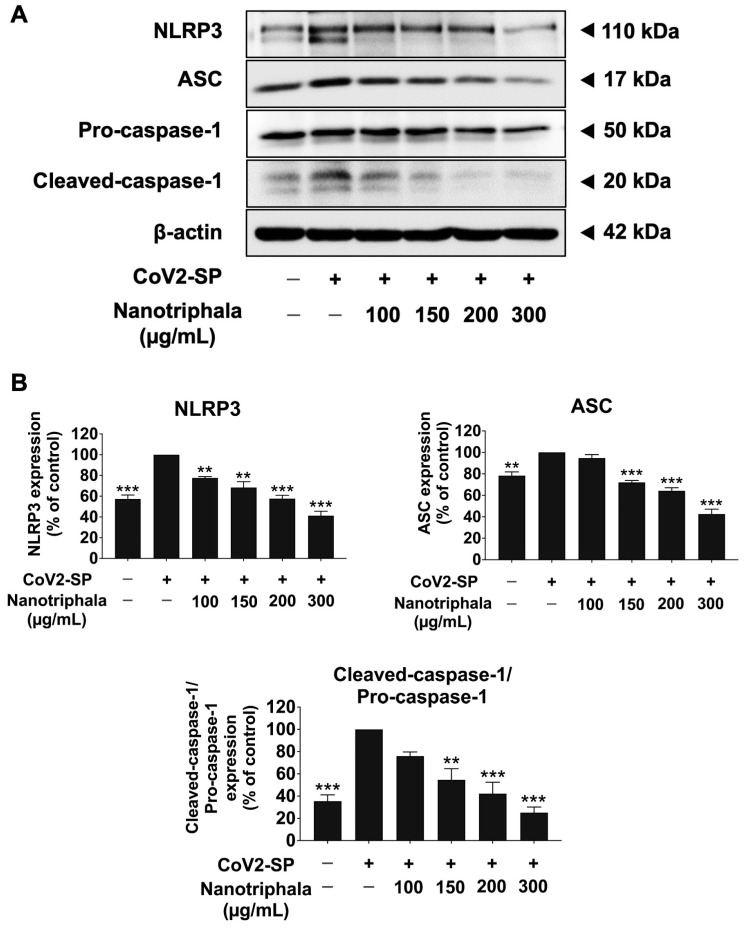
The COVID-19 pandemic, caused by SARS-CoV-2, poses a significant global health threat. The spike glycoprotein S1 of the SARS-CoV-2 virus is known to induce the production of pro-inflammatory mediators, contributing to hyperinflammation in COVID-19 patients. Triphala, an ancient Ayurvedic remedy composed of dried fruits from three plant species-Emblica officinalis (Family Euphorbiaceae), Terminalia bellerica (Family Combretaceae), and Terminalia chebula (Family Combretaceae)-shows promise in addressing inflammation. However, the limited water solubility of its ethanolic extract impedes its bioavailability. In this study, we aimed to develop nanoparticles loaded with Triphala extract, termed "nanotriphala", as a drug delivery system. Additionally, we investigated the in vitro anti-inflammatory properties of nanotriphala and its major compounds, namely gallic acid, chebulagic acid, and chebulinic acid, in lung epithelial cells (A549) induced by CoV2-SP. The nanotriphala formulation was prepared using the solvent displacement method. The encapsulation efficiency of Triphala in nanotriphala was determined to be 87.96 ± 2.60% based on total phenolic content. In terms of in vitro release, nanotriphala exhibited a biphasic release profile with zero-order kinetics over 0-8 h. A549 cells were treated with nanotriphala or its active compounds and then induced with 100 ng/mL of spike S1 subunit (CoV2-SP). The results demonstrate that chebulagic acid and chebulinic acid are the active compounds in nanotriphala, which significantly reduced cytokine release (IL-6, IL-1β, and IL-18) and suppressed the expression of inflammatory genes (IL-6, IL-1β, IL-18, and NLRP3) (p < 0.05). Mechanistically, nanotriphala and its active compounds notably attenuated the expression of inflammasome machinery proteins (NLRP3, ASC, and Caspase-1) (p < 0.05). In conclusion, the nanoparticle formulation of Triphala enhances its stability and exhibits anti-inflammatory properties against CoV2-SP-induction. This was achieved by suppressing inflammatory mediators and the NLRP3 inflammasome machinery. Thus, nanotriphala holds promise as a supportive preventive anti-inflammatory therapy for COVID-19-related chronic inflammation.
Keywords: NLRP3 inflammasome pathway; SARS-CoV-2; anti-inflammation; nanoparticles; nanotriphala.
Conflict of interest statement
The authors declare they have no conflicts of interest. The funders had no role in the design of the study; in the collection, analyses, or interpretation of data; in the writing of the manuscript; or in the decision to publish the results.
Figures


Similar articles
-
Targeting Spike Glycoprotein S1 Mediated by NLRP3 Inflammasome Machinery and the Cytokine Releases in A549 Lung Epithelial Cells by Nanocurcumin.Pharmaceuticals (Basel). 2023 Jun 9;16(6):862. doi: 10.3390/ph16060862. Pharmaceuticals (Basel). 2023. PMID: 37375809 Free PMC article.
-
Luteolin-rich fraction from Perilla frutescens seed meal inhibits spike glycoprotein S1 of SARS-CoV-2-induced NLRP3 inflammasome lung cell inflammation via regulation of JAK1/STAT3 pathway: A potential anti-inflammatory compound against inflammation-induced long-COVID.Front Med (Lausanne). 2023 Jan 9;9:1072056. doi: 10.3389/fmed.2022.1072056. eCollection 2022. Front Med (Lausanne). 2023. PMID: 36698809 Free PMC article.
-
Hesperetin from Root Extract of Clerodendrum petasites S. Moore Inhibits SARS-CoV-2 Spike Protein S1 Subunit-Induced NLRP3 Inflammasome in A549 Lung Cells via Modulation of the Akt/MAPK/AP-1 Pathway.Int J Mol Sci. 2022 Sep 7;23(18):10346. doi: 10.3390/ijms231810346. Int J Mol Sci. 2022. PMID: 36142258 Free PMC article.
-
Exploring scientific validation of Triphala Rasayana in ayurveda as a source of rejuvenation for contemporary healthcare: An update.J Ethnopharmacol. 2021 Jun 12;273:113829. doi: 10.1016/j.jep.2021.113829. Epub 2021 Jan 17. J Ethnopharmacol. 2021. PMID: 33465446 Review.
-
Immunomodulatory effects of triphala and its individual constituents: a review.Indian J Pharm Sci. 2014 Nov-Dec;76(6):467-75. Indian J Pharm Sci. 2014. PMID: 25593379 Free PMC article. Review.
Cited by
-
Phytochemical Characterization, Bioactivities, and Nanoparticle-Based Topical Gel Formulation Development from Four Mitragyna speciosa Varieties.Gels. 2025 Jun 26;11(7):494. doi: 10.3390/gels11070494. Gels. 2025. PMID: 40710656 Free PMC article.
-
Investigation of a Thermoresponsive In Situ Hydrogel Loaded with Nanotriphala: Implications for Antioxidant, Anti-Inflammatory, and Antimicrobial Therapy in Nasal Disorders.Gels. 2025 Feb 2;11(2):106. doi: 10.3390/gels11020106. Gels. 2025. PMID: 39996649 Free PMC article.
-
Role of Lipopolysaccharides in the Inflammation and Pyroptosis of Alveolar Epithelial Cells in Acute Lung Injury and Acute Respiratory Distress Syndrome.J Inflamm Res. 2024 Aug 30;17:5855-5869. doi: 10.2147/JIR.S479051. eCollection 2024. J Inflamm Res. 2024. PMID: 39228678 Free PMC article. Review.
-
Thermosensitive In Situ Ophthalmic Gel for Effective Local Delivery and Antifungal Activity of Ketoconazole Nanoparticles.Gels. 2024 Dec 27;11(1):13. doi: 10.3390/gels11010013. Gels. 2024. PMID: 39851983 Free PMC article.
-
Anti-Inflammatory and Anti-Migratory Effects of Morin on Non-Small-Cell Lung Cancer Metastasis via Inhibition of NLRP3/MAPK Signaling Pathway.Biomolecules. 2025 Jan 10;15(1):103. doi: 10.3390/biom15010103. Biomolecules. 2025. PMID: 39858497 Free PMC article.
References
-
- Augustin M., Schommers P., Stecher M., Dewald F., Gieselmann L., Gruell H., Horn C., Vanshylla K., Cristanziano V.D., Osebold L., et al. Post-COVID syndrome in non-hospitalised patients with COVID-19: A longitudinal prospective cohort study. Lancet Reg. Health Eur. 2021;6:100122. doi: 10.1016/j.lanepe.2021.100122. - DOI - PMC - PubMed
-
- Teodoro A.G.F., Rodrigues W.F., Farnesi-de-Assunção T.S., Borges A., Obata M.M.S., Neto J., da Silva D.A.A., Andrade-Silva L.E., Desidério C.S., Costa-Madeira J.C., et al. Inflammatory Response and Activation of Coagulation after COVID-19 Infection. Viruses. 2023;15:938. doi: 10.3390/v15040938. - DOI - PMC - PubMed
Grants and funding
LinkOut - more resources
Full Text Sources
Miscellaneous
