. 2024 Jun 20;16(6):838.
doi: 10.3390/pharmaceutics16060838.

In Vitro and In Vivo Antipsoriatic Efficacy of Protected and Unprotected Sugar-Zinc Phthalocyanine Conjugates

Affiliations

In Vitro and In Vivo Antipsoriatic Efficacy of Protected and Unprotected Sugar-Zinc Phthalocyanine Conjugates

Sebastian Makuch et al. Pharmaceutics. .

Abstract

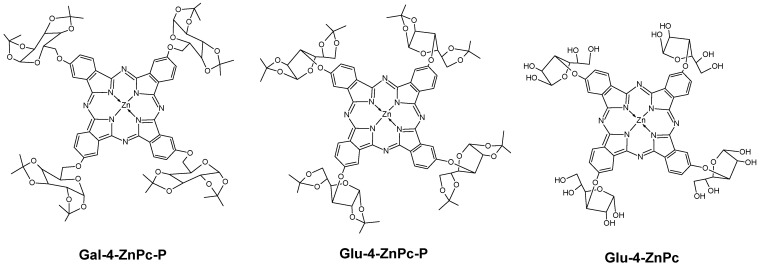
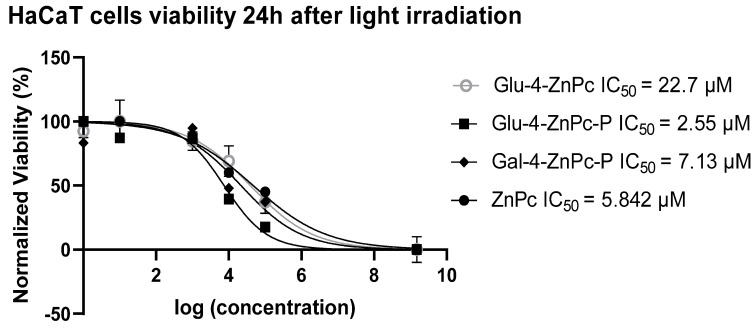
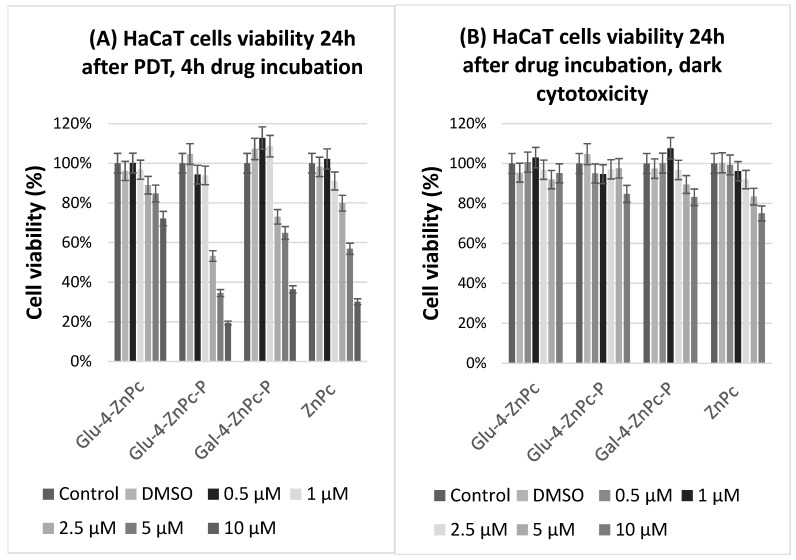
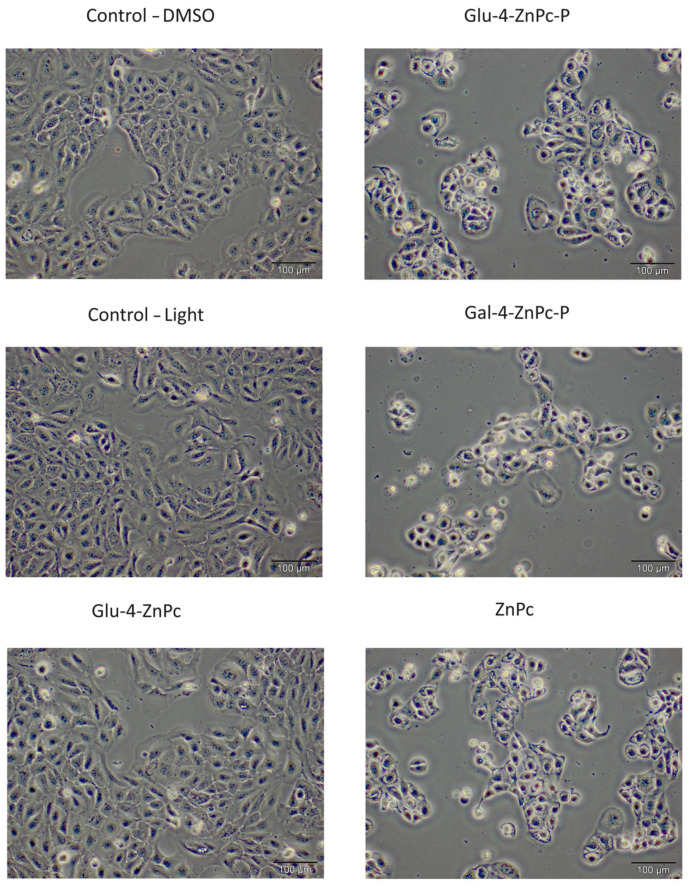
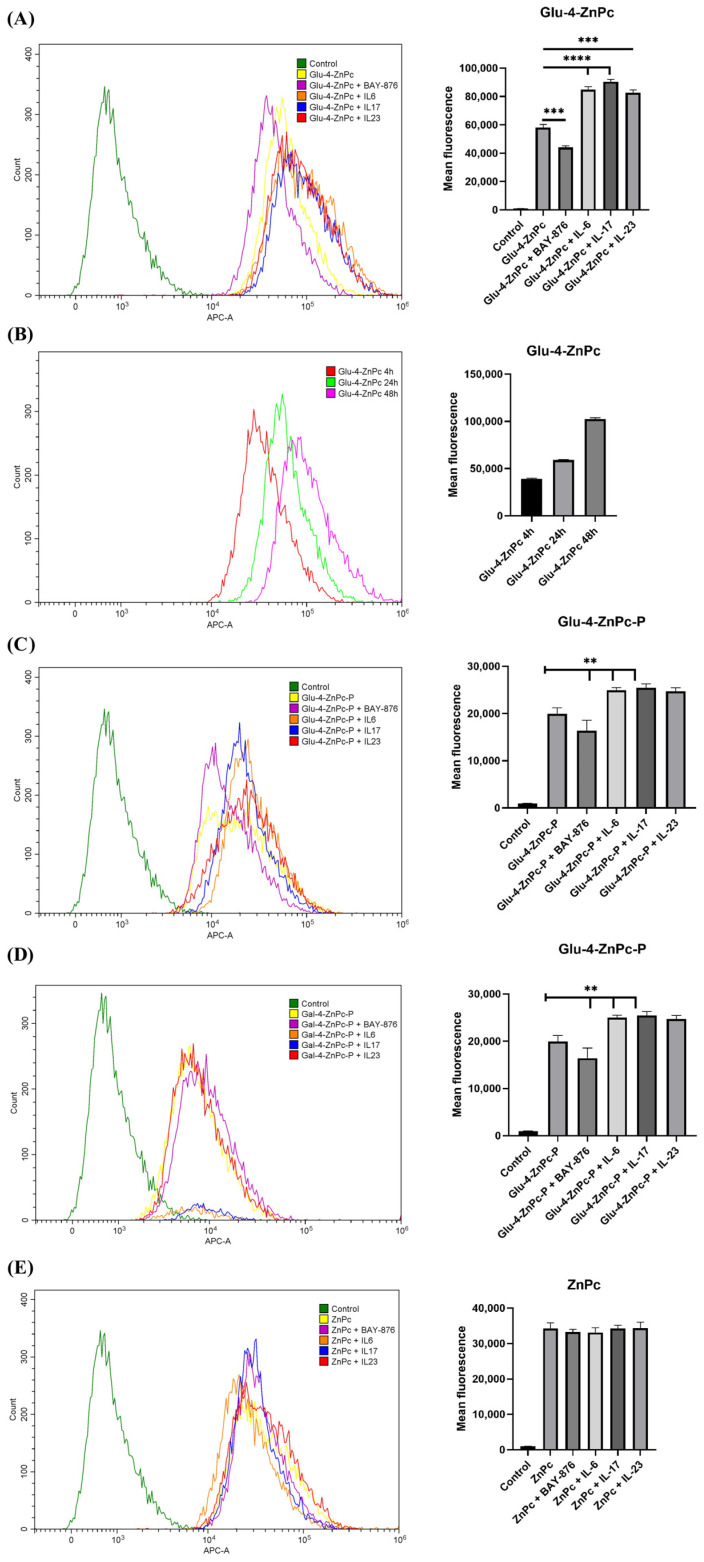
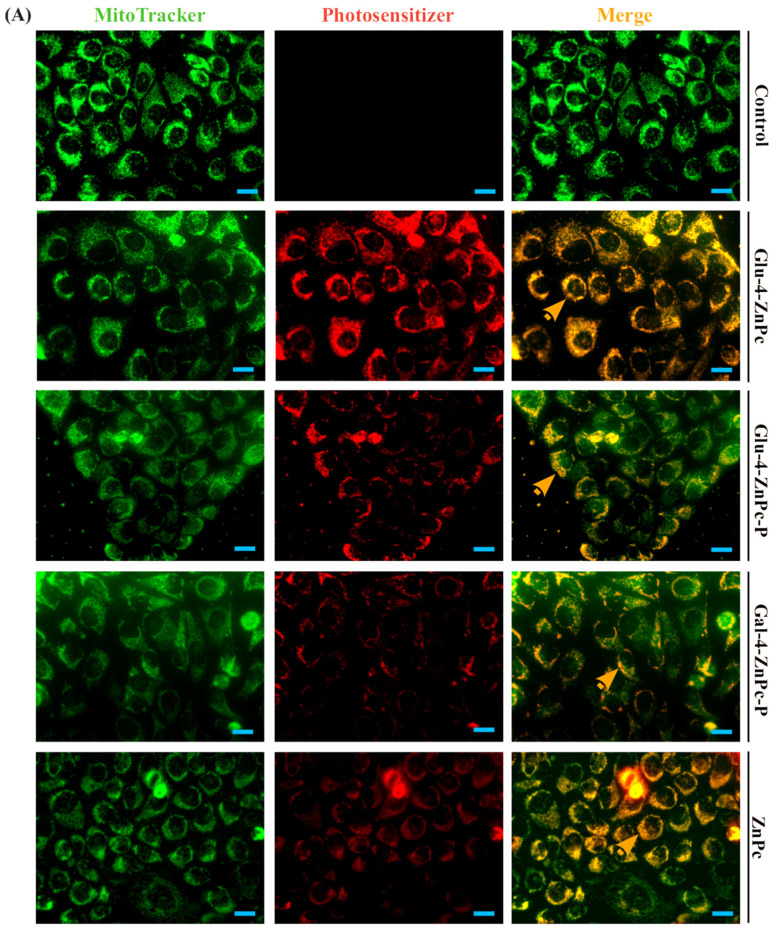
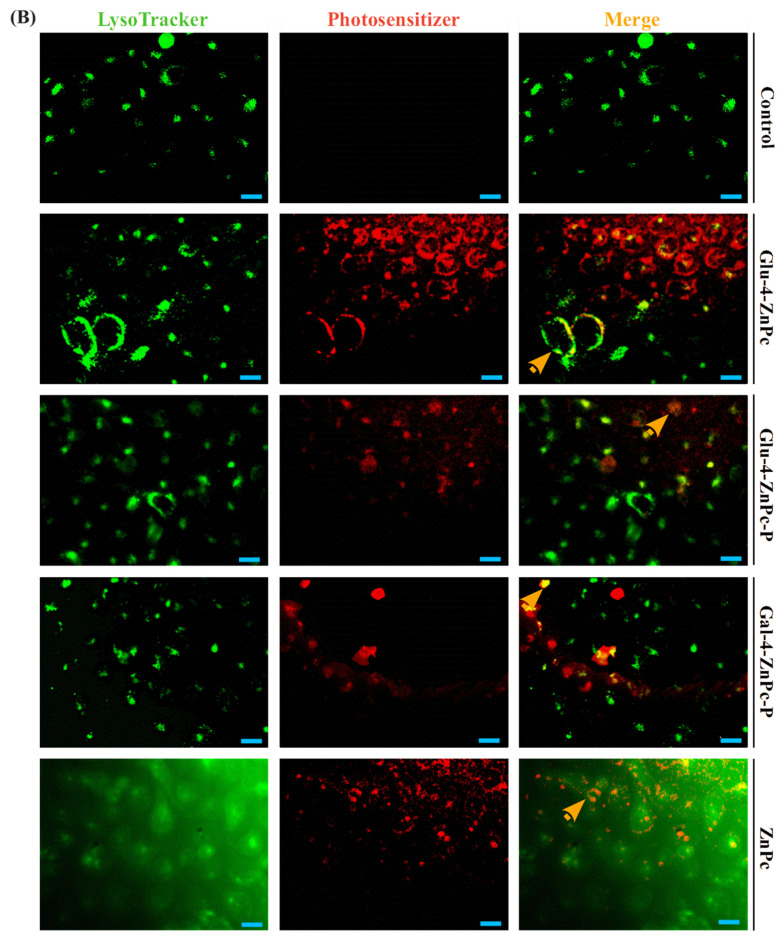
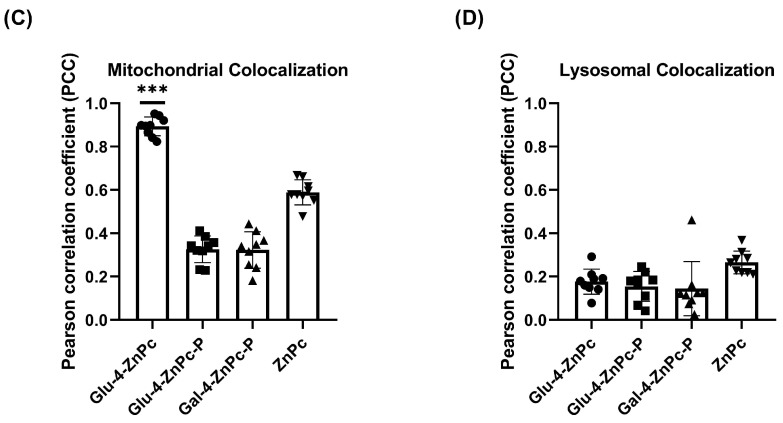
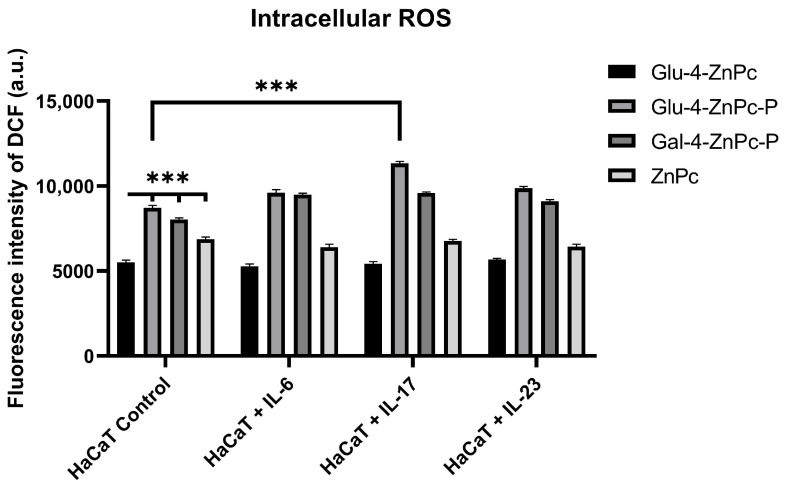
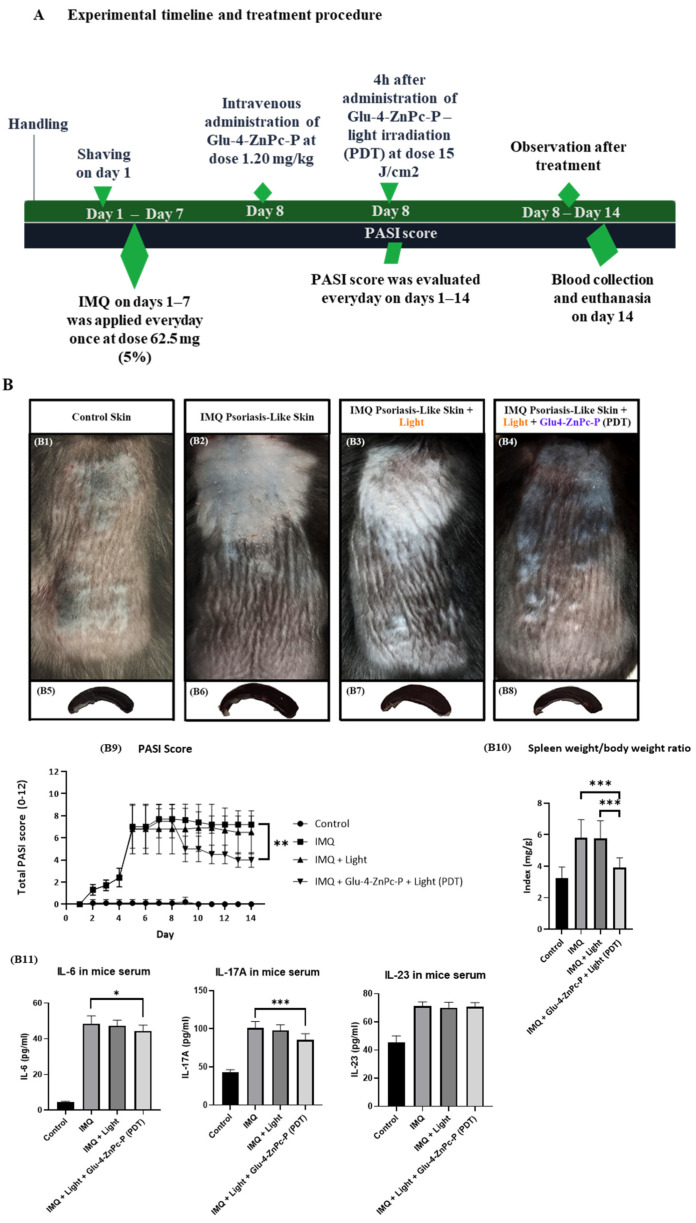
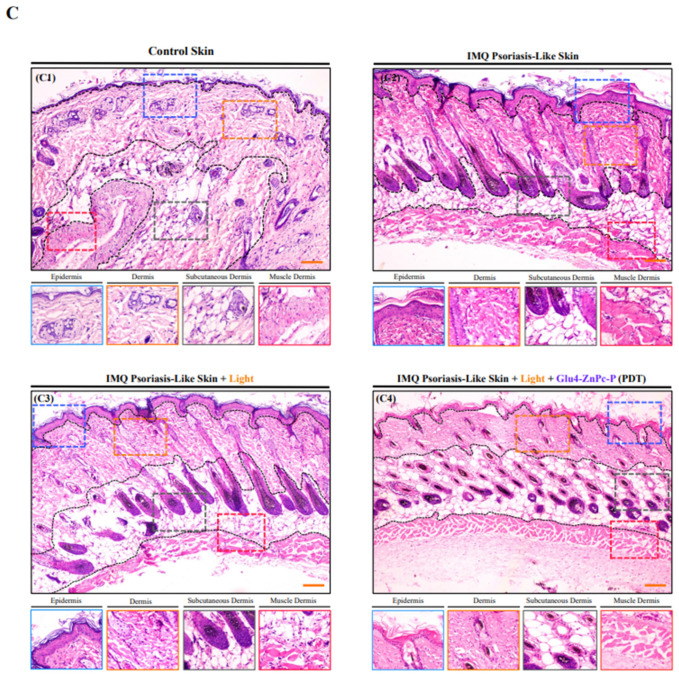
Psoriasis, a chronic immune-mediated skin disorder affecting over 125 million people globally, is characterized by abnormal keratinocyte proliferation and immune cell infiltration. Photodynamic therapy (PDT) remains underutilized in the treatment of psoriasis despite its potential as a promising and effective therapeutic approach. This study aimed to explore the efficacy of zinc phthalocyanine (ZnPc) and its sugar conjugates as potential antipsoriatic agents. We successfully synthesized protected and unprotected sugar-conjugated zinc phthalocyanines and evaluated their potential against cytokine-stimulated HaCaT keratinocytes, as well as an established IMQ psoriasis-like in vivo model. Tetrasubstituted protected glucose-ZnPc (Glu-4-ZnPc-P) demonstrated superior phototoxicity (IC50 = 2.55 µM) compared to unprotected glucose conjugate (IC50 = 22.7 µM), protected galactose-ZnPc (IC50 = 7.13 µM), and free ZnPc in cytokine-stimulated HaCaT cells (IC50 = 5.84 µM). Cellular uptake analysis revealed that IL-17A, a cytokine that plays a central role in the pathogenesis of psoriasis, enhanced unprotected Glu-4-ZnPc uptake by 56.3%, while GLUT1 inhibitor BAY-876 reduced its accumulation by 23.8%. Intracellular ROS generation following Glu-4-ZnPc-P-PDT was significantly increased after stimulation with IL-17A, correlating with in vitro photocytotoxicity. In vivo PDT using Glu-4-ZnPc-P exhibited significant improvement in Psoriasis Area and Severity Index (PASI), inhibiting splenomegaly and restoring normal skin morphology. This study highlights sugar-conjugated zinc phthalocyanines as potential candidates for targeted PDT in psoriasis, providing a basis for further clinical investigations.

Keywords: cytokines; drug uptake; psoriasis; sugar conjugates; zinc phthalocyanine.


Conflict of interest statement

The authors declare no conflicts of interest.

Figures

Figure 1
Figure 1
Structural formulas of glycosubstituted zinc phthalocyanines.
Figure 2
Figure 2
IC50 values of sugar-conjugated ZnPc compared to free ZnPc against HaCaT cells at a light dose of 0.9 J/cm2 24 h after light irradiation.
Figure 3
Figure 3
Cell viability of HaCaT cells stimulated with proinflammatory cytokines following 4 h or 24 h incubation with sugar–ZnPc conjugates or free ZnPc; (A) photocytotoxicity at 0.9 J/cm2; (B) dark cytotoxicity.
Figure 4
Figure 4
The morphology of cytokine-stimulated HaCaT cells 24 h after photodynamic effect with sugar-conjugated ZnPc and free ZnPc at a drug dose of 2.5 µM and light dose of 0.9 J/cm2.
Figure 5
Figure 5
Flow cytometry analysis of uptake of sugar-conjugated zinc phthalocyanines compared to free ZnPc, after stimulation with proinflammatory cytokines IL-6, IL-17A, and IL-23 or inhibition with BAY-876; (A) Glu-4-ZnPc after 24 h; (B) Glu-4-ZnPc after 4 h, 24 h and 48 h; (C) Glu-4-ZnPc-P after 24 h; (D) Gal-4-ZnPc-P after 24 h; (E) ZnPc after 24 h. ** (p < 0.01); *** (p < 0.001); **** (p < 0.0001).
Figure 6
Figure 6
Subcellular localization of sugar-conjugated zinc phthalocyanine and free ZnPc in HaCaT cells after 24 h incubation. The red fluorescence of the compounds was mainly colocalized with (A) MitoTracker®. In contrast, the red fluorescence of the compounds displayed scant colocalization with (B) LysoTracker® green fluorescence; Pearson’s correlation coefficients (PCCs) of images (n = 9) of phthalocyanines and green MitoTracker® (C,D) LysoTracker® in HaCaT cells using Pearson’s correlation coefficient and one-way ANOVA. n = 9 images for each group. *** p < 0.001. Orange arrows show areas of colocalization of autofluorescent signal with mitochondrial or lysosomal probes. Scale bars = 20 μm.
Figure 6
Figure 6
Subcellular localization of sugar-conjugated zinc phthalocyanine and free ZnPc in HaCaT cells after 24 h incubation. The red fluorescence of the compounds was mainly colocalized with (A) MitoTracker®. In contrast, the red fluorescence of the compounds displayed scant colocalization with (B) LysoTracker® green fluorescence; Pearson’s correlation coefficients (PCCs) of images (n = 9) of phthalocyanines and green MitoTracker® (C,D) LysoTracker® in HaCaT cells using Pearson’s correlation coefficient and one-way ANOVA. n = 9 images for each group. *** p < 0.001. Orange arrows show areas of colocalization of autofluorescent signal with mitochondrial or lysosomal probes. Scale bars = 20 μm.
Figure 7
Figure 7
Cellular ROS generation efficiency Glu-4-ZnPc, Glu-4-ZnPc-P, Gal-4-ZnPc-P, and ZnPc (all at 2.5 µM) with the light dose of 0.9 J/cm2; *** (p < 0.001).
Figure 8
Figure 8
(A) The diagram illustrates the steps of experimental design in time. (B) The safety and therapeutic effects of PDT were analyzed in several ways. The daily imaging of skin backs of (B1): control skin; (B2): IMQ-Psoriasis-Like Skin; (B3): IMQ-Psoriasis-Like Skin with Light irradiation; (B4): complete PDT: IMQ-Psoriasis-Like Skin following Light Irradiation and intravenous administration of Glu-4-ZnPc-P; (B5B8): macroscopic assessment of spleens in the studied groups; (B9): Total PASI score; (B10): calculation of spleen/body weight ratio index; (B11): determination of IL-6, IL-17A and IL-23 levels in mice serum by ELISA; (C) hematoxylin and eosin (H&E) staining of all skin compartments, including the epidermis, dermis, subcutaneous dermis and muscle dermis in (C1): control group; (C2): IMQ-Psoriatic-like skin; (C3) IMQ-Psoriasis-Like Skin with Light irradiation; (C4): Glu-4-ZnPc-P-PDT. The whole skin tissue from all four groups was additionally selected as squares and enlarged below main images for epidermis (blue), dermis (orange), subcutaneous (gray), and muscle (red) dermis for better visualization of skin compartments. * (p < 0.05); ** (p < 0.01); *** (p < 0.001); the main images are under magnification of ×10, scale bars = 100 µm.
Figure 8
Figure 8
(A) The diagram illustrates the steps of experimental design in time. (B) The safety and therapeutic effects of PDT were analyzed in several ways. The daily imaging of skin backs of (B1): control skin; (B2): IMQ-Psoriasis-Like Skin; (B3): IMQ-Psoriasis-Like Skin with Light irradiation; (B4): complete PDT: IMQ-Psoriasis-Like Skin following Light Irradiation and intravenous administration of Glu-4-ZnPc-P; (B5B8): macroscopic assessment of spleens in the studied groups; (B9): Total PASI score; (B10): calculation of spleen/body weight ratio index; (B11): determination of IL-6, IL-17A and IL-23 levels in mice serum by ELISA; (C) hematoxylin and eosin (H&E) staining of all skin compartments, including the epidermis, dermis, subcutaneous dermis and muscle dermis in (C1): control group; (C2): IMQ-Psoriatic-like skin; (C3) IMQ-Psoriasis-Like Skin with Light irradiation; (C4): Glu-4-ZnPc-P-PDT. The whole skin tissue from all four groups was additionally selected as squares and enlarged below main images for epidermis (blue), dermis (orange), subcutaneous (gray), and muscle (red) dermis for better visualization of skin compartments. * (p < 0.05); ** (p < 0.01); *** (p < 0.001); the main images are under magnification of ×10, scale bars = 100 µm.

Similar articles

References

    1. Parisi R., Iskandar I.Y.K., Kontopantelis E., Augustin M., Griffiths C.E.M., Ashcroft D.M. National, Regional, and Worldwide Epidemiology of Psoriasis: Systematic Analysis and Modelling Study. BMJ. 2020;369:m1590. doi: 10.1136/bmj.m1590. - DOI - PMC - PubMed
    1. Armstrong A.W., Read C. Pathophysiology, Clinical Presentation, and Treatment of Psoriasis: A Review. JAMA—J. Am. Med. Assoc. 2020;323:1945–1960. doi: 10.1001/jama.2020.4006. - DOI - PubMed
    1. Lowes M.A., Bowcock A.M., Krueger J.G. Pathogenesis and Therapy of Psoriasis. Nature. 2007;445:866–873. doi: 10.1038/nature05663. - DOI - PubMed
    1. Rendon A., Schäkel K. Psoriasis Pathogenesis and Treatment. Int. J. Mol. Sci. 2019;20:1475. doi: 10.3390/ijms20061475. - DOI - PMC - PubMed
    1. Yamanaka K., Yamamoto O., Honda T. Pathophysiology of Psoriasis: A Review. J. Dermatol. 2021;48:722–731. doi: 10.1111/1346-8138.15913. - DOI - PubMed

LinkOut - more resources