. 2024 Jun 12;16(6):945.
doi: 10.3390/v16060945.

Elucidation of the Epitranscriptomic RNA Modification Landscape of Chikungunya Virus

Affiliations

Elucidation of the Epitranscriptomic RNA Modification Landscape of Chikungunya Virus

Belinda Baquero-Pérez et al. Viruses. .

Abstract

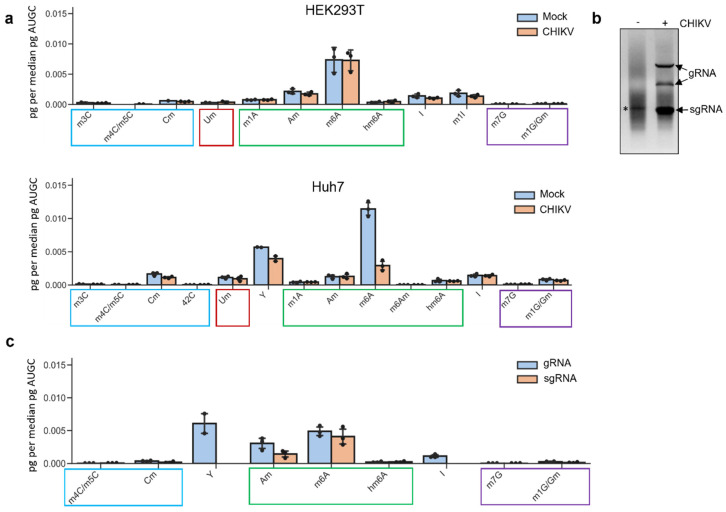
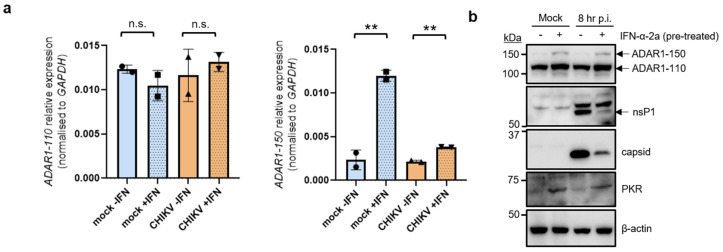
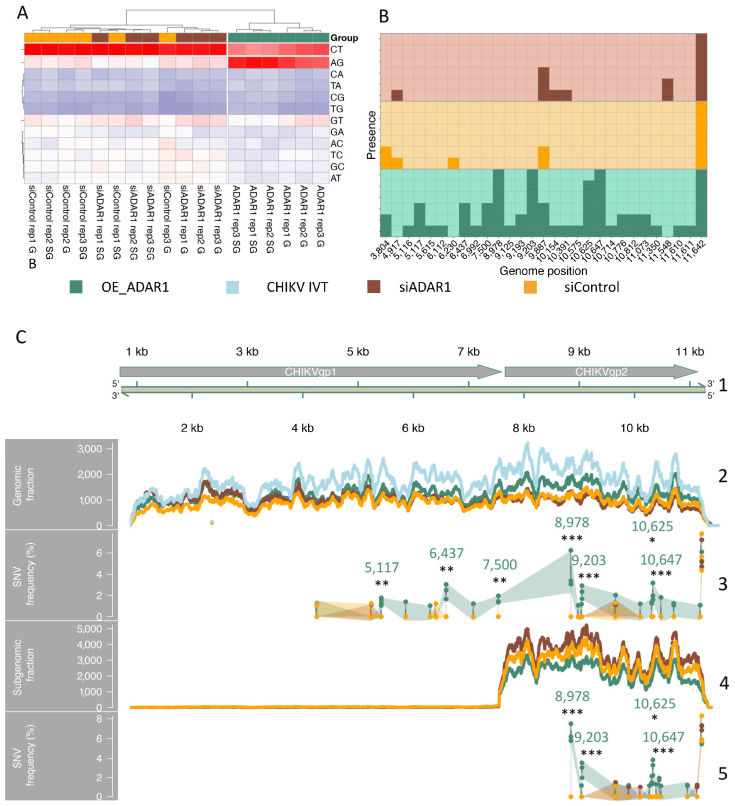
The genomes of positive-sense (+) single-stranded RNA (ssRNA) viruses are believed to be subjected to a wide range of RNA modifications. In this study, we focused on the chikungunya virus (CHIKV) as a model (+) ssRNA virus to study the landscape of viral RNA modification in infected human cells. Among the 32 distinct RNA modifications analysed by mass spectrometry, inosine was found enriched in the genomic CHIKV RNA. However, orthogonal validation by Illumina RNA-seq analyses did not identify any inosine modification along the CHIKV RNA genome. Moreover, CHIKV infection did not alter the expression of ADAR1 isoforms, the enzymes that catalyse the adenosine to inosine conversion. Together, this study highlights the importance of a multidisciplinary approach to assess the presence of RNA modifications in viral RNA genomes.

Keywords: ADAR1; RNA modifications; alphaviruses; chikungunya virus; epitranscriptome; inosine.


Conflict of interest statement

The authors declare no conflicts of interest.

Figures

Figure 1
Figure 1
Analyses of the CHIKV RNA epitranscriptome by LC-MS/MS. (a) Cells were infected for 12 h p.i. with CHIKV at an MOI of 4, and poly(A)-selected RNAs were isolated from mock-infected or CHIKV-infected HEK 293T and Huh7 cells. A total of ~100 ng of digested ribonucleosides were analysed per sample for HEK 293T cells and ~75 ng for Huh7 cells. The bar chart shows mean values from three biological replicates with the error bars showing SD. Of the 32 RNA modifications screened, only those that were detected in at least two replicates are displayed. (b) A total of 5 μg of poly(A)+ RNA was isolated from mock-infected (−) or CHIKV-infected (+) (12 h p.i. MOI of 4) HEK 293T cells and then separated using a native 1% (w/v) agarose gel (containing ethidium bromide). The gel electrophoresis was carried out in 1× tris-acetate-EDTA (TAE) buffer. The asterisk indicates residual 28S rRNA. (c) HEK 293T cells were infected for 12 h p.i. with CHIKV at an MOI of 4. Poly(A)-selected RNAs were isolated from these and gRNA and sgRNA were further purified by gel-extraction. A total of ~150 ng of digested ribonucleosides were analysed per sample. The bar chart shows mean values from three biological replicates with the error bars showing SD. Of the 32 RNA modifications screened, only those that were detected in at least two replicates are displayed.
Figure 2
Figure 2
Protein expression levels of ADAR1 isoforms 150 and 110 are not affected by CHIKV infection. HEK 293T cells either were left untreated or treated with IFN-α-2a for 24 h. Cells were then either mock-infected or CHIKV-infected (MOI of 4) for 8 h. (a) qRT-PCR analyses to measure the expression of ADAR1 isoforms. The bar chart shows mean values from two biological replicates with the error bars showing SD. All statistical analyses were performed using a two-tailed t-test. n.s. = not significant, ** p < 0.01. (b) Western blot analyses of ADAR1 isoforms and viral proteins. β-actin is shown as a loading control. Western blots are representative of two independent infections.
Figure 3
Figure 3
ADAR1 knockdown decreases viral RNA, viral protein levels, and viral titers. HEK 293T cells were transfected with siControl or siADAR1 for two consecutive days. A total of 48 h after the first transfection, cells were mock-infected or CHIKV-infected (MOI of 4) for 8 h. (a) β-actin is shown as a loading control. β-actin-normalised values from depleted samples, below each band, are shown relative to their controls. Western blot quantification analyses are representative of two independent infections. (b) Intracellular viral RNA levels were quantified by qRT-PCR and normalised against the housekeeping gene GAPDH. Viral RNA levels in depleted samples are shown relative to the corresponding controls. (c) Supernatants were collected at 8 h p.i. (MOI of 4) from CHIKV-infected control and knockdown cells were titered by plaque assay in HEK 293T cells. (b,c) The bar chart shows mean values from three independent infections with the error bars showing SD. All statistical analyses were performed using a two-tailed t-test. ** p < 0.01, * p < 0.05.
Figure 4
Figure 4
ADAR1 knockdown leads to phosphorylation of eukaryotic translation initiation factor 2α (eIF2α). HEK 293T cells were transfected with siControl or siADAR1 two consecutive days. 48 h after the first transfection, cells were mock-infected or CHIKV-infected (MOI of 4) for 8 h. β-actin is shown as a loading control. β-actin-normalised values from depleted samples, below each band, are shown relative to their controls. Western blot quantification analyses are representative of two independent infections.
Figure 5
Figure 5
Inosine mapping by RNA-seq analyses. The three panels refer to CHIKV RNA reads from RNA-seq samples obtained from HEK 293T cells treated with specific ADAR1 Silencer siRNA (siADAR1, brown), non-targeting siRNA (siControl, yellow), ADAR1 overexpression vector (OE_ADAR1, green) or, as negative in vitro transcribed (IVT) control, from SP6-transcription of the chikungunya virus (CHIKV) genome (light blue). (A) Heatmap reporting the relative amount of all possible single nucleotide variations (SNV) in samples from the above-mentioned experimental groups. (B) The tile plot displays the occurrence of ADAR-compatible single nucleotide variants (SNVs) for each analysed sample (y-axis) across various positions in the CHIKV genome (x-axis), and each square along the y-axis represents one sample. Different groups are indicated by varying background colours, as explained above, and samples positive for editing sites are marked with a darker shade. (C) Representation of the sequencing depth and specific AG SNVs detected along the CHIKV genome. The different colours represent samples from different experimental conditions, as explained above. From the top to the bottom, arrows depict the viral transcripts CHIKVgp1 (non-structural polyprotein, NP_690588.1) and CHIKVgp2 (structural polyprotein, NP_690589.2) over the linear CHIKV genome track (1); the sequencing depth along the viral genome (2) or along the size-selected viral subgenome (4) are reported for each sample group (colours as reported above). Dots show the AG SNV frequency along the entire virus genome (3) or size-selected viral subgenome (5) (three samples per treatment group), whereas coloured areas indicate the confidence interval. Empty areas in (3) (0–3803 bp) and (5) (0–8977) indicate the absence of detectable AG SNV. The position and associated p-value symbol are reported (Fisher’s exact test, p-value * < 0.05, ** < 0.01, *** < 0.001).

Similar articles

Cited by

References

    1. Jonkhout N., Tran J., Smith M.A., Schonrock N., Mattick J.S., Novoa E.M. The RNA Modification Landscape in Human Disease. RNA. 2017;23:1754–1769. doi: 10.1261/rna.063503.117. - DOI - PMC - PubMed
    1. Frye M., Harada B.T., Behm M., He C. RNA Modifications Modulate Gene Expression during Development. Science. 2018;361:1346–1349. doi: 10.1126/science.aau1646. - DOI - PMC - PubMed
    1. Motorin Y., Helm M. RNA Nucleotide Methylation. WIREs RNA. 2011;2:611–631. doi: 10.1002/wrna.79. - DOI - PubMed
    1. Meyer K.D., Saletore Y., Zumbo P., Elemento O., Mason C.E., Jaffrey S.R. Comprehensive Analysis of mRNA Methylation Reveals Enrichment in 3′ UTRs and near Stop Codons. Cell. 2012;149:1635–1646. doi: 10.1016/j.cell.2012.05.003. - DOI - PMC - PubMed
    1. Dominissini D., Moshitch-Moshkovitz S., Schwartz S., Salmon-Divon M., Ungar L., Osenberg S., Cesarkas K., Jacob-Hirsch J., Amariglio N., Kupiec M., et al. Topology of the Human and Mouse m6A RNA Methylomes Revealed by m6A-Seq. Nature. 2012;485:201–206. doi: 10.1038/nature11112. - DOI - PubMed

Publication types

Associated data