

Interleukin 27, Similar to Interferons, Modulates Gene Expression of Tripartite Motif (TRIM) Family Members and Interferes with Mayaro Virus Replication in Human Macrophages
- PMID: 38932287
- PMCID: PMC11209095
- DOI: 10.3390/v16060996
Interleukin 27, Similar to Interferons, Modulates Gene Expression of Tripartite Motif (TRIM) Family Members and Interferes with Mayaro Virus Replication in Human Macrophages
Abstract
Background: The Tripartite motif (TRIM) family includes more than 80 distinct human genes. Their function has been implicated in regulating important cellular processes, including intracellular signaling, transcription, autophagy, and innate immunity. During viral infections, macrophages are key components of innate immunity that produce interferons (IFNs) and IL27. We recently published that IL27 and IFNs induce transcriptional changes in various genes, including those involved in JAK-STAT signaling. Furthermore, IL27 and IFNs share proinflammatory and antiviral pathways in monocyte-derived macrophages (MDMs), resulting in both common and unique expression of inflammatory factors and IFN-stimulated genes (ISGs) encoding antiviral proteins. Interestingly, many TRIM proteins have been recognized as ISGs in recent years. Although it is already very well described that TRIM expression is induced by IFNs, it is not fully understood whether TRIM genes are induced in macrophages by IL27. Therefore, in this study, we examined the effect of stimulation with IL27 and type I, II, and III IFNs on the mRNA expression profiles of TRIM genes in MDMs.
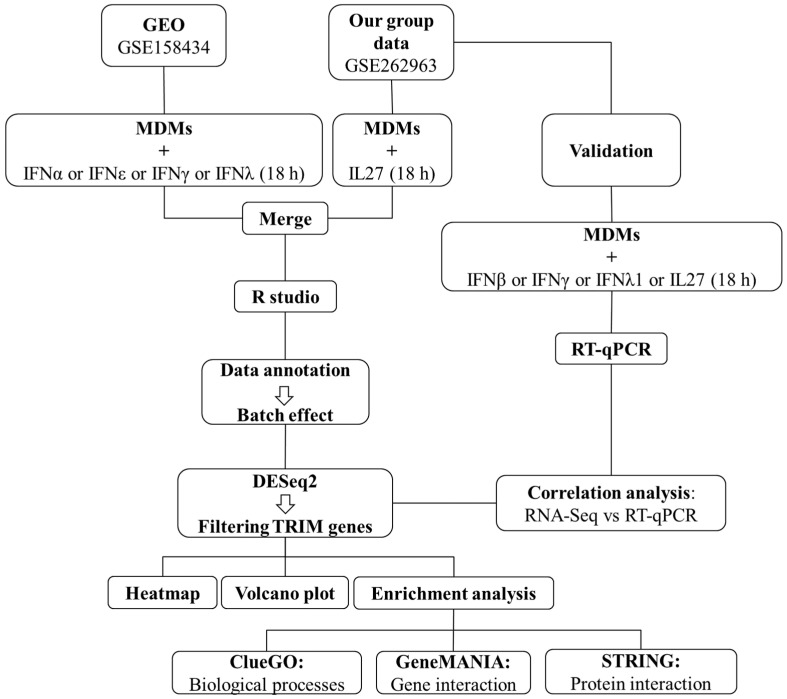
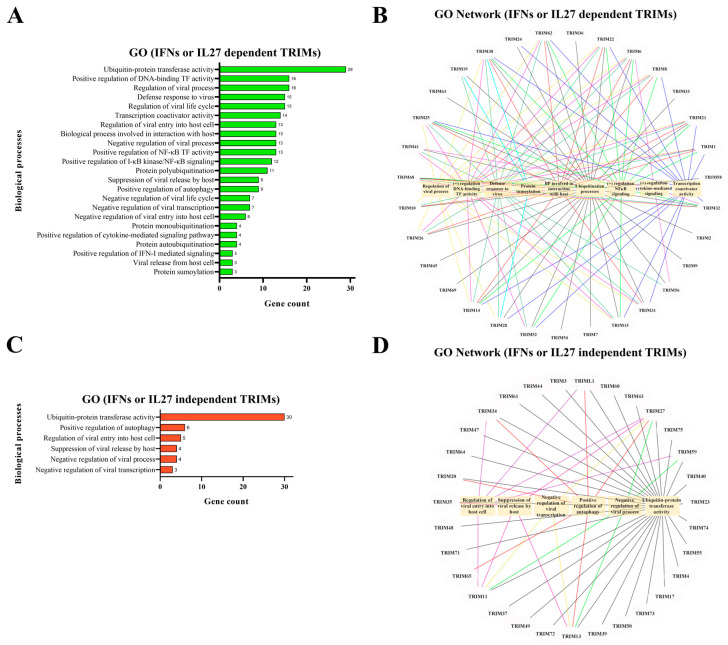
Methods: We used bulk RNA-seq to examine the TRIM expression profile of MDMs treated with IFNs or IL27. Initially, we characterized the expression patterns of different TRIM subfamilies using a heatmap. Subsequently, a volcano plot was employed to identify commonly differentially expressed TRIM genes. Additionally, we conducted gene ontology analysis with ClueGO to explore the biological processes of the regulated TRIMs, created a gene-gene interaction network using GeneMANIA, and examined protein-protein interactions with the STRING database. Finally, RNA-seq data was validated using RT-qPCR. Furthermore, the effect of IL27 on Mayaro virus replication was also evaluated.
Results: We found that IL27, similar to IFNs, upregulates several TRIM genes' expression in human macrophages. Specifically, we identified three common TRIM genes (TRIM19, 21, and 22) induced by IL27 and all types of human IFNs. Additionally, we performed the first report of transcriptional regulation of TRIM19, 21, 22, and 69 genes in response to IL27. The TRIMs involved a broad range of biological processes, including defense response to viruses, viral life cycle regulation, and negative regulation of viral processes. In addition, we observed a decrease in Mayaro virus replication in MDMs previously treated with IL27.
Conclusions: Our results show that IL27, like IFNs, modulates the transcriptional expression of different TRIM-family members involved in the induction of innate immunity and an antiviral response. In addition, the functional analysis demonstrated that, like IFN, IL27 reduced Mayaro virus replication in MDMs. This implies that IL27 and IFNs share many similarities at a functional level. Moreover, identifying distinct TRIM groups and their differential expressions in response to IL27 provides new insights into the regulatory mechanisms underlying the antiviral response in human macrophages.
Keywords: RNA-seq; interferons; interleukin 27; macrophages; tripartite motif.
Conflict of interest statement
The authors declare that they have no known competing financial interests or personal relationships that could have appeared to influence the work reported in this paper.
Figures


Similar articles
-
Interleukin 27, like interferons, activates JAK-STAT signaling and promotes pro-inflammatory and antiviral states that interfere with dengue and chikungunya viruses replication in human macrophages.Front Immunol. 2024 Apr 24;15:1385473. doi: 10.3389/fimmu.2024.1385473. eCollection 2024. Front Immunol. 2024. PMID: 38720890 Free PMC article.
-
Interleukin 27 as an inducer of antiviral response against chikungunya virus infection in human macrophages.Cell Immunol. 2021 Sep;367:104411. doi: 10.1016/j.cellimm.2021.104411. Epub 2021 Jul 21. Cell Immunol. 2021. PMID: 34325085
-
Mayaro virus infection elicits a robust pro-inflammatory and antiviral response in human macrophages.Acta Trop. 2024 Apr;252:107146. doi: 10.1016/j.actatropica.2024.107146. Epub 2024 Feb 9. Acta Trop. 2024. PMID: 38342287
-
The Roles of TRIMs in Antiviral Innate Immune Signaling.Front Cell Infect Microbiol. 2021 Mar 15;11:628275. doi: 10.3389/fcimb.2021.628275. eCollection 2021. Front Cell Infect Microbiol. 2021. PMID: 33791238 Free PMC article. Review.
-
Induction and regulation of IFNs during viral infections.J Interferon Cytokine Res. 2004 Aug;24(8):439-54. doi: 10.1089/1079990041689665. J Interferon Cytokine Res. 2004. PMID: 15320958 Review.
Cited by
-
Interleukin-27-polarized HIV-resistant M2 macrophages are a novel subtype of macrophages that express distinct antiviral gene profiles in individual cells: implication for the antiviral effect via different mechanisms in the individual cell-dependent manner.Front Immunol. 2025 Mar 10;16:1550699. doi: 10.3389/fimmu.2025.1550699. eCollection 2025. Front Immunol. 2025. PMID: 40129989 Free PMC article.
-
TRIMming down Flavivirus Infections.Viruses. 2024 Aug 6;16(8):1262. doi: 10.3390/v16081262. Viruses. 2024. PMID: 39205236 Free PMC article. Review.
References
Publication types
MeSH terms
Substances
Associated data
- Actions
- Actions
Grants and funding
LinkOut - more resources
Full Text Sources
Molecular Biology Databases
