. 2024 Dec;79(12):3430-3447.
doi: 10.1111/all.16202. Epub 2024 Jun 23.

The impact of high-IgE levels on metabolome and microbiome in experimental allergic enteritis

Affiliations

The impact of high-IgE levels on metabolome and microbiome in experimental allergic enteritis

Elisa Zubeldia-Varela et al. Allergy. 2024 Dec.

Abstract

Background: The pathological mechanism of the gastrointestinal forms of food allergies is less understood in comparison to other clinical phenotypes, such as asthma and anaphylaxis Importantly, high-IgE levels are a poor prognostic factor in gastrointestinal allergies.

Methods: This study investigated how high-IgE levels influence the development of intestinal inflammation and the metabolome in allergic enteritis (AE), using IgE knock-in (IgEki) mice expressing high levels of IgE. In addition, correlation of the altered metabolome with gut microbiome was analysed.

Results: Ovalbumin-sensitized and egg-white diet-fed (OVA/EW) BALB/c WT mice developed moderate AE, whereas OVA/EW IgEki mice induced more aggravated intestinal inflammation with enhanced eosinophil accumulation. Untargeted metabolomics detected the increased levels of N-tau-methylhistamine and 2,3-butanediol, and reduced levels of butyric acid in faeces and/or sera of OVA/EW IgEki mice, which was accompanied with reduced Clostridium and increased Lactobacillus at the genus level. Non-sensitized and egg-white diet-fed (NC/EW) WT mice did not exhibit any signs of AE, whereas NC/EW IgEki mice developed marginal degrees of AE. Compared to NC/EW WT mice, enhanced levels of lysophospholipids, sphinganine and sphingosine were detected in serum and faecal samples of NC/EW IgEki mice. In addition, several associations of altered metabolome with gut microbiome-for example Akkermansia with lysophosphatidylserine-were detected.

Conclusions: Our results suggest that high-IgE levels alter intestinal and systemic levels of endogenous and microbiota-associated metabolites in experimental AE. This study contributes to deepening the knowledge of molecular mechanisms for the development of AE and provides clues to advance diagnostic and therapeutic strategies of allergic diseases.

Keywords: IgE; food allergy; metabolomics; microbiome; microbiota; murine model.


Conflict of interest statement

Dr. Stefan Vieths reports personal honorarium from AAAAI as Associate Editor of J. Allergy Clin Immunol, non‐financial support from European Academy of Allergy and Clinical Immunology.

Figures
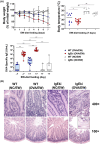
FIGURE 1
FIGURE 1
Induction of allergic enteritis in wild type and IgEki mice. WT and IgEki mice were i.p. sensitized with OVA plus ALUM and fed EW diet for 7 days. As controls, mice were fed EW diet without sensitization. (A) During EW diet feeding, the weight of the mice was monitored daily. Body temperature and the serum levels of OVA‐specific IgE levels of each mouse on day 7 of EW diet were measured. (B) Jejunum tissues were harvested from mice and stained with H&E. The data is representative for three independent experiments. NC/EW, Non‐sensitized and EW diet‐fed mice; OVA/EW, OVA‐sensitized and EW diet‐fed mice. *p < .05, **p < .01.
FIGURE 2
FIGURE 2
The number of significantly annotated metabolites in NC/EW or OVA/EW WT and IgEki mice. Stacked bar chart of biochemical classes of the significant annotated metabolites in the four comparisons of faeces and serum samples. The biochemical class was taken from HMDB website. NC/EW, Non‐sensitized and EW diet‐fed mice; OVA/EW, OVA‐sensitized and EW diet‐fed mice.
FIGURE 3
FIGURE 3
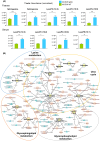
Characterization of key faecal and serum metabolites in NC/EW IgEki versus NC/EW WT comparison. (A) Trajectories of significant annotated metabolites in faeces and serum between NC/EW IgEki and NC/EW WT groups. Asterisks denote significance of the MWU test with a post hoc Bonferroni correction: *p < .05; **p < .01; ***p < .001. (B) Significant metabolic pathways (p < .05) detected using faeces samples. Yellow hexagons are the metabolites significantly altered. The blue border means that it is decreased in that comparison and the red one that it is increased. Orange hexagons are the metabolites that participate in the route. Grey diamonds are the reactions that take place. Reactions are described in Table S9. Blue triangles are the enzymes that participate in each of the reactions. NC/EW, Non‐sensitized and Non‐sensitized and EW diet‐fed mice.
FIGURE 4
FIGURE 4
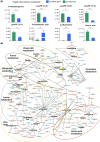
Characterization of key faecal metabolites in e OVA/EW WT versus NC/EW WT comparison. (A) Trajectories of significant annotated metabolites in faeces between OVA/EW WT versus NC/EW WT groups. Asterisks denote significance of the MWU test with a post hoc Bonferroni correction: *p < .05; **p < .01; ***p < .001. (B) Significant metabolic pathways (p < .05) detected using the faeces samples. Yellow hexagons are the metabolites significantly altered. The blue border means that it is decreased in that comparison and the red one that it is increased. Orange hexagons are the metabolites that participate in the route. Grey diamonds are the reactions that take place. Reactions are described in Table S12. Blue triangles are the enzymes that participate in each of the reactions. NC/EW, Non‐sensitized and EW diet‐fed mice; OVA/EW, OVA‐sensitized and EW diet‐ed mice.
FIGURE 5
FIGURE 5
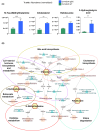
Characterization of key faecal metabolites in OVA/EW IgEki versus OVA/EW WT comparison. (A) Trajectories of significant annotated metabolites in faeces between OVA/EW IgEki versus OVA/EW WT groups. Asterisks denote significance of the MWU test with a post hoc Bonferroni correction: **p < .01; ***p < .001. (B) Significant metabolic pathways (p < .05) detected using faeces. Yellow hexagons are the metabolites significantly altered. The blue border means that it is decreased in that comparison and the red one that it is increased. Orange hexagons are the metabolites that participate in the route. Grey diamonds are the reactions that take place. Reactions are described in Table S10. Blue triangles are the enzymes that participate in each of the reactions. OVA/EW, OVA‐sensitized and EW diet‐ed mice.
FIGURE 6
FIGURE 6
Characterization of key serum metabolites in OVA/EW IgEki versus OVA/EW WT comparison. (A) Trajectories of significant annotated metabolites in sera between OVA/EW IgEki versus OVA/EW WT groups. Asterisks denote significance of the MWU test with a post hoc Bonferroni correction: **p < .01; ***p < .001. (B) Significant metabolic pathways (p < .05) detected using serum samples. Yellow hexagons are the metabolites significantly altered. The blue border means that it is decreased in that comparison and the red one that it is increased. Orange hexagons are the metabolites that participate in the route. Grey diamonds are the reactions that take place. Reactions are described in Table S11. Blue triangles are the enzymes that participate in each of the reactions. OVA/EW, OVA‐sensitized and EW diet‐ed mice.
FIGURE 7
FIGURE 7
Analysis of gut microbiome in NC/EW or OVA/EW WT and IgEki mice. (A) Relative abundance of the main phyla, family and genus in the mouse groups. (B) Linear discriminant analysis (LDA) scores resulting from the LDA‐effect size (LEfSe) tool in the Galaxy/Hutlab webpage. (C) Cladogram of the LEfSe analysis. NC/EW, Non‐sensitized and EW diet‐fed mice; OVA/EW, OVA‐sensitized and EW diet‐ed mice.
FIGURE 8
FIGURE 8
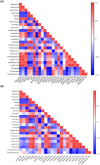
Correlation matrices between metabolites and gut microbiome at the levels of genera. Pearson correlation index: *p‐value <.05; **p‐value <.01. (A) Correlation matrix identified in faecal samples. (B) Correlation matrix identified in serum samples.

References

    1. Waserman S, Bégin P, Watson W. IgE‐mediated food allergy. Allergy Asthma Clin Immunol. 2018;14:55. - PMC - PubMed
    1. Anvari S, Miller J, Yeh C‐Y, Davis CM. IgE‐mediated food allergy. Clin Rev Allergy Immunol. 2019;57:244‐260. - PubMed
    1. Ho MH‐K, Wong WH‐S, Chang C. Clinical spectrum of food allergies. A comprehensive review. Clin Rev Allergy Immunol. 2014;46:225‐240. - PubMed
    1. Burggraf M, Nakajima‐Adachi H, Hachimura S, et al. Oral tolerance induction does not resolve gastrointestinal inflammation in a mouse model of food allergy. Mol Nutr Food Res. 2011;55:1475‐1483. - PubMed
    1. Zubeldia‐Varela E, Barker‐Tejeda TC, Blanco‐Pérez F, Infante S, Zubeldia JM, Pérez‐Gordo M. Non‐IgE‐mediated gastrointestinal food protein‐induced allergic disorders. Clinical perspectives and analytical approaches. Foods. 2021;10:2662. - PMC - PubMed

Substances

LinkOut - more resources