. 2024 Jul 22;52(13):7740-7760.
doi: 10.1093/nar/gkae547.

ONECUT2 acts as a lineage plasticity driver in adenocarcinoma as well as neuroendocrine variants of prostate cancer

Affiliations

ONECUT2 acts as a lineage plasticity driver in adenocarcinoma as well as neuroendocrine variants of prostate cancer

Chen Qian et al. Nucleic Acids Res. .

Abstract

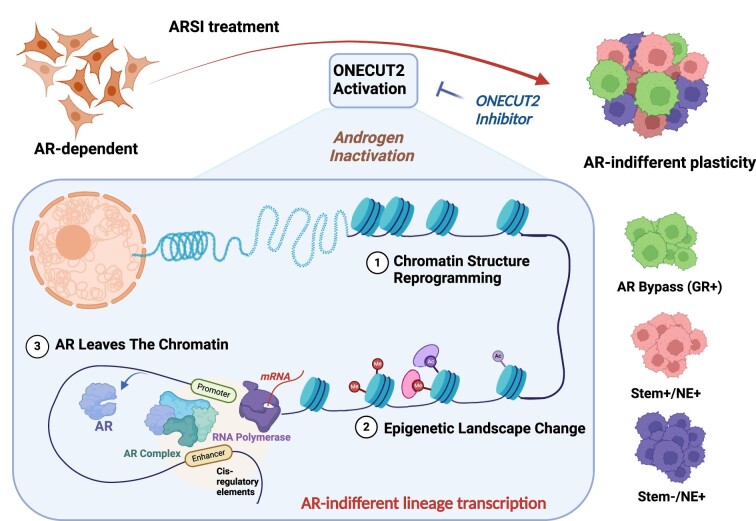
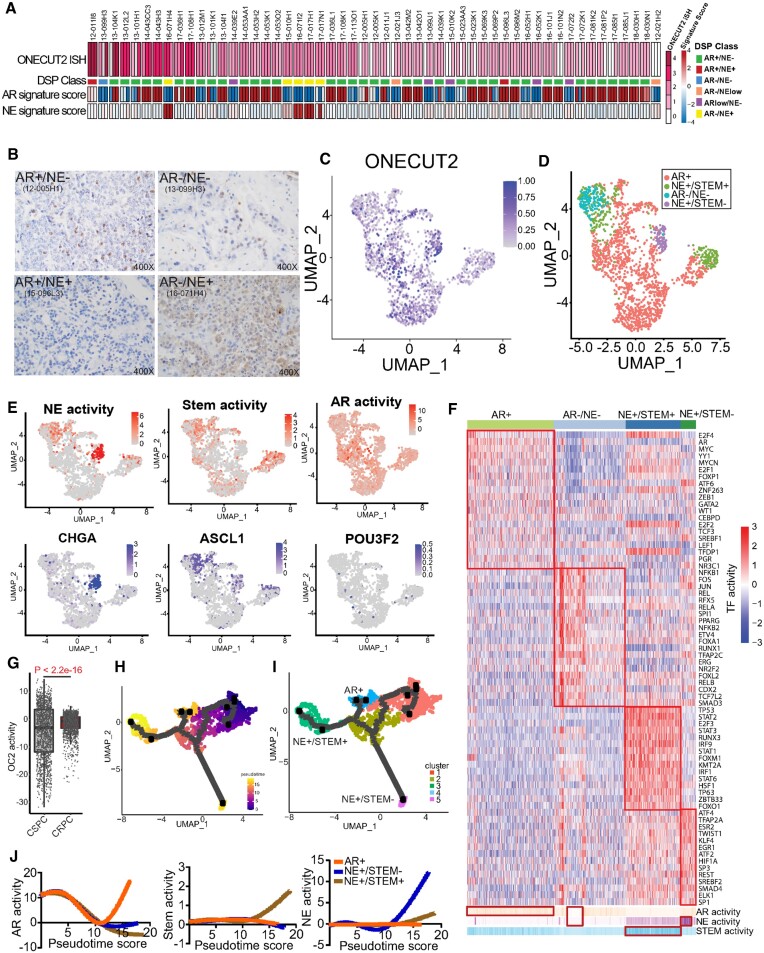
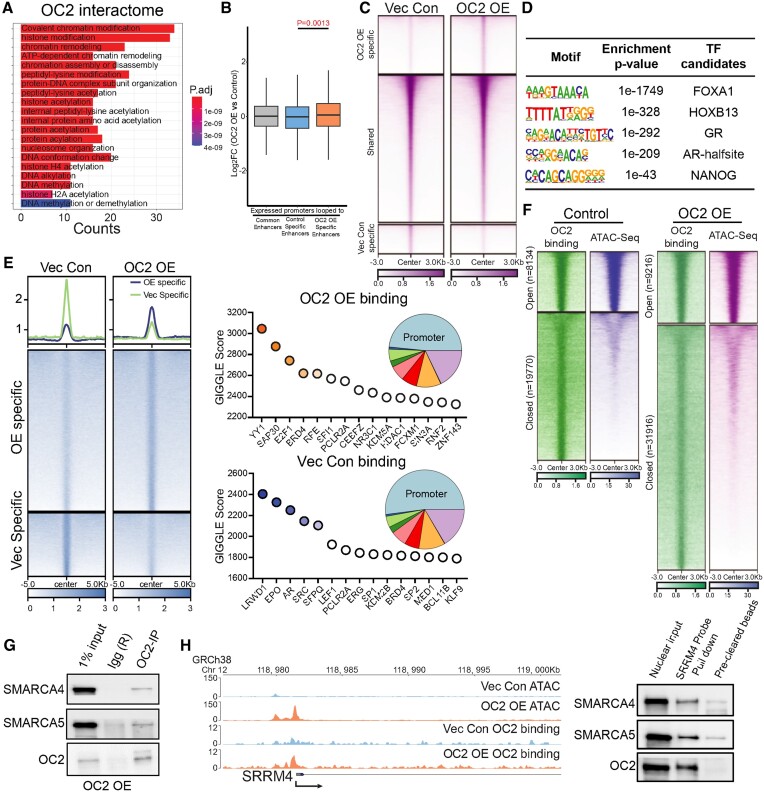
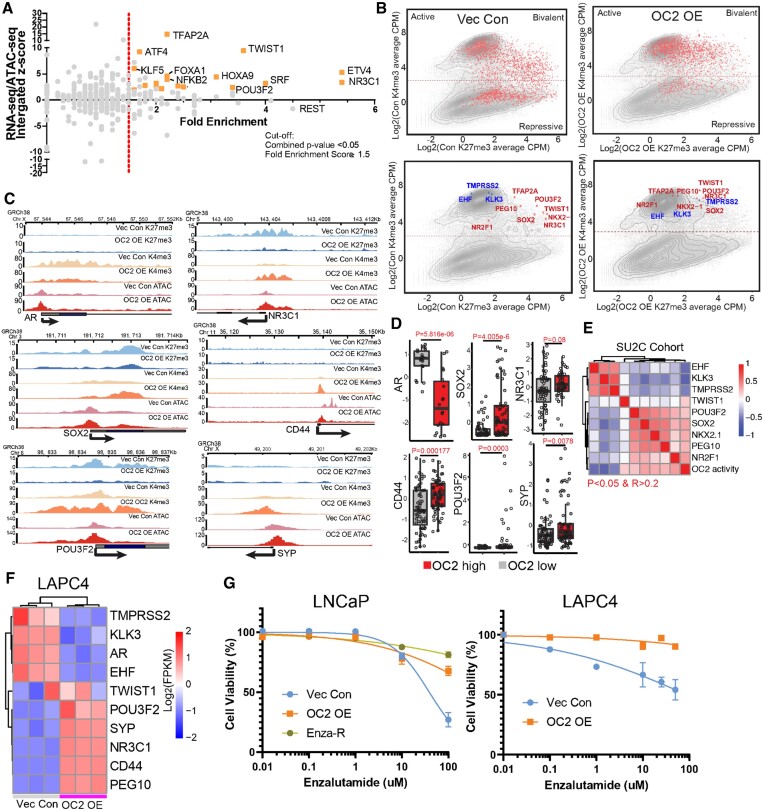
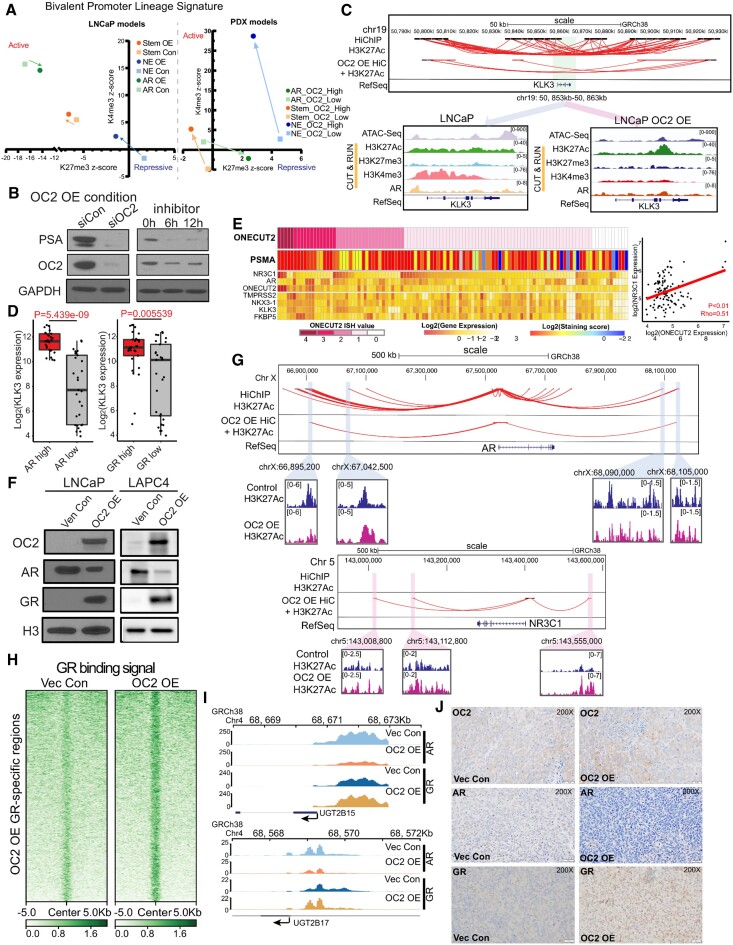
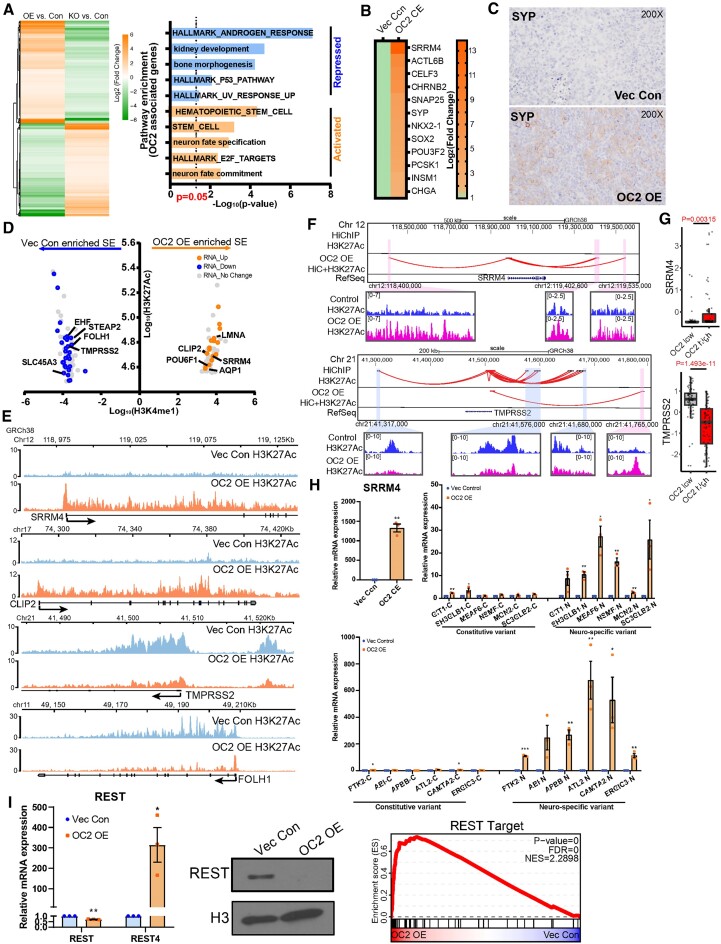
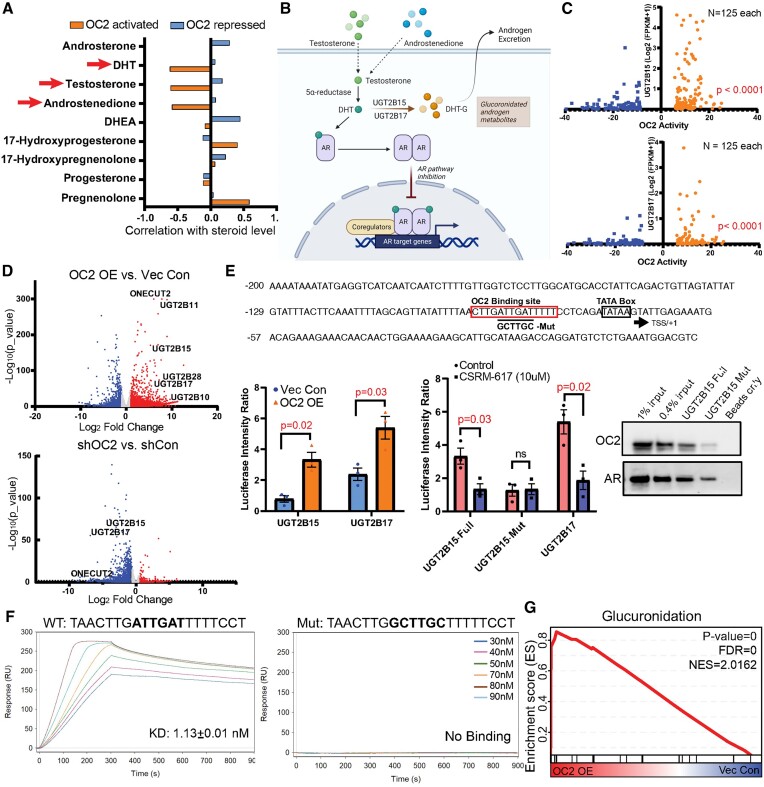
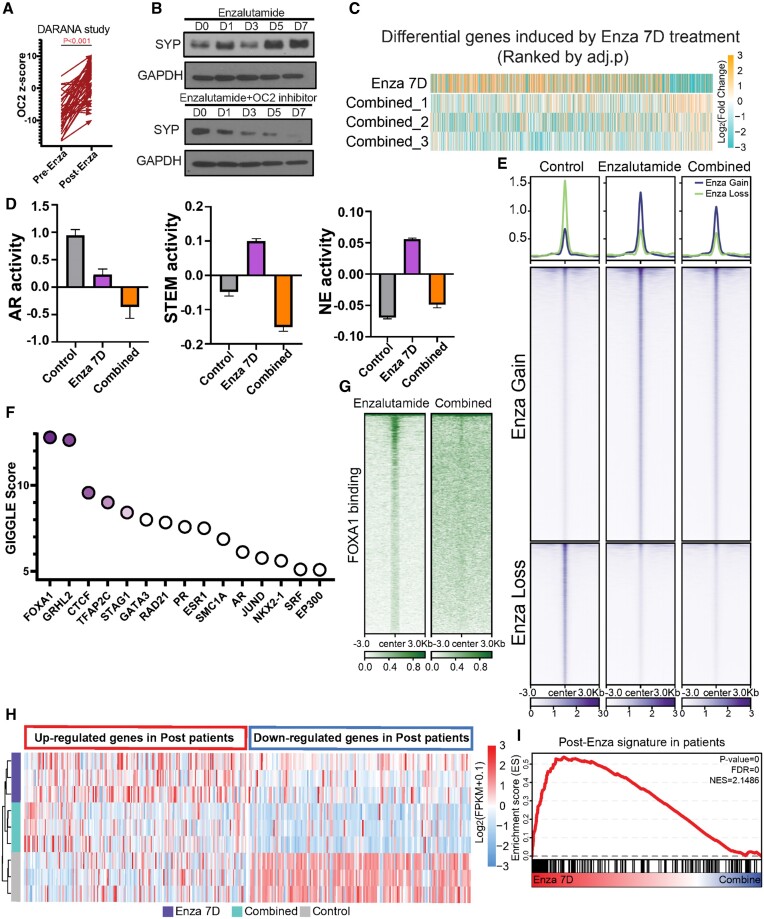
Androgen receptor- (AR-) indifference is a mechanism of resistance to hormonal therapy in prostate cancer (PC). Here we demonstrate that ONECUT2 (OC2) activates resistance through multiple drivers associated with adenocarcinoma, stem-like and neuroendocrine (NE) variants. Direct OC2 gene targets include the glucocorticoid receptor (GR; NR3C1) and the NE splicing factor SRRM4, which are key drivers of lineage plasticity. Thus, OC2, despite its previously described NEPC driver function, can indirectly activate a portion of the AR cistrome through epigenetic activation of GR. Mechanisms by which OC2 regulates gene expression include promoter binding, enhancement of genome-wide chromatin accessibility, and super-enhancer reprogramming. Pharmacologic inhibition of OC2 suppresses lineage plasticity reprogramming induced by the AR signaling inhibitor enzalutamide. These results demonstrate that OC2 activation promotes a range of drug resistance mechanisms associated with treatment-emergent lineage variation in PC and support enhanced efforts to therapeutically target OC2 as a means of suppressing treatment-resistant disease.


Figures

Graphical Abstract
Graphical Abstract
Figure 1.
Figure 1.
OC2 is expressed in multiple CRPC lineages. (A) RNA scope in-situ hybridization of OC2 on UW-TMA95 series ((8)). NE and AR signature scores were calculated using RNA-seq data and established digital spatial profiling (DSP) class annotation from the matched samples collected from GSE147250. (Refer to methods).(B) Representative IHC staining of OC2 in CRPC specimens in established phenotypes. (C) UMAP plot illustrating OC2-expressing epithelial cells from 6 CRPC patients scRNA-seq datasets selected for further analysis. (D) UMAP plot illustrating OC2-expressing cells annotated to distinct lineages in CRPC. (E) UMAP plots illustrating OC2-expressing cells colored by three lineage signature activities (AR, NE, Stem) and expression levels of representative markers (CHGA, ASCL1 and POU3F2). (F) Unsupervised clustering of OC2 expressing epithelial cells from 6 CRPC scRNA-seq datasets using transcription factor (TF) activity from the high-confidence DoRothEA database. (Refer to methods). (G) CRPC patient samples show higher OC2 activity compared to CSPC patient samples (Refer to methods). (H) UMAP plot showing the pseudotime trajectory of OC2-expressing cells with progression from CSPC (M0 status) cells to CRPC. (I) UMAP plot showing development of three distinct lineages along the pseudotime trajectory. (J) AR, NE and Stem signatures were computed to track the development of three lineages.
Figure 2.
Figure 2.
OC2 interacts with CRCs and alters chromatin accessibility. (A) Gene Ontology analysis of the OC2 interactome proteins identified by IP-MS experiments (N = 2) showed enrichment of chromatin remodeling complexes. (B) HiC-seq was integrated with histone H3K27Ac CUT&RUN-seq to identify specific enhancers in LNCaP Vec Con and OC2 OE cells (N = 2). RNA-seq was then integrated to access the specific enhancer looped those upregulated gene promoter regions, suggesting the newly formed looping structures contributed to OC2-directed gene expression changes. (C) Normalized tag densities for ATAC-seq in LNCaP Vec Con and OC2 OE cells showed OC2 induced chromatin remodeling (N = 2). (D) Motif enrichment analysis for hyper-accessible regions in OC2 OE from ATAC-seq data. (E) Normalized tag densities for the OC2 cistrome in LNCaP Vec Con and OC2 OE cells through CUT&RUN-seq (Left). GIGGLE analysis for TF binding similarity in the OC2-specific cistrome in both conditions (Right) (N = 2). (F) Normalized tag densities for integrated analysis of ATAC-seq and OC2 CUT&RUN-seq. 75% of the OC2-bound regions consisted of closed chromatin. (G) IP-WB showed OC2 interacts with SMARCA4 and SMARCA5. (H) ATAC-seq suggested OC2 binds to the chromatin and induced chromatin opening in the SRRM4 promoter region (left). DNA affinity precipitation assay (DAPA) showed binding of SMARCA4 and SMARCA5 to the SRRM4 promoter region under OC2-enforced conditions (right) (Refer to methods).
Figure 3.
Figure 3.
OC2 activates multiple AR-independent lineage-defining factors. (A) Integrated analysis for identifying OC2-driven candidate TFs based on RNA-seq, ATAC-seq and fold enrichment of downstream targets (refer to methods). Selected candidate genes were labeled in orange. Full candidates list is in Supplementary Table S3 (Cut-off: Fold enrichment score ≥1.5; Combined P < 0.05). (B) Log2 (CPM + 0.1) signal intensity of H3K4me3 and H3K27me3 within ±2 kb of the transcription start site (TSS) where OC2 binds. Each dot represents a unique transcript start site. The cutoff for H3K4me3 separation to indicate active and repression is based on two normal distributions of the signal. Selected genes are highlighted in the bottom row (Red in upregulated genes and Blue in downregulated genes). (C) H3K27me3, H3K4me3 and ATAC-seq signals in LNCaP Vec Con and OC2 OE cells for AR bypass genes AR and GR (NR3C1), NEPC genes (POU3F2 and SYP), Stem genes (SOX2 and CD44). (D) The expression levels of matched selected genes in the SU2C CRPC cohort based on stratification of OC2 activity. (E) Correlation of OC2 activity with candidate TF expression in the SU2C cohort. (F) OC2-driven TFs were also activated in LAPC4 Vec Con and OC2 OE cells (N = 3). (G) OC2 overexpression promotes enzalutamide resistance in LNCaP and LAPC4 cells. LogIC50: LNCaP (1.59 (Vec) versus 2.75 (OC2 OE) versus 4.46 (Enza-R)); LAPC4 (1.95 (Vec) versus 5.49 (OC2 OE))
Figure 4.
Figure 4.
OC2 activates AR-bypass pathways through GR. (A) Epigenetic status (H3K27me3 and H3K4me3 signal) of the promoters of a panel of lineage signature genes (AR/Stem/NE) represented by average z-score in LNCaP Vec Con and OC2 OE cells (left), and patient derived xenografts (PDX) with OC2 high and OC2 low phenotype (N = 3 for each). (B) OC2 knockdown with siRNA (10 uM) suppressed PSA in the OC2 OE condition, indicating OC2 in controls PSA-expressing lineage in OC2 OE cells. (C) Integrated analysis showed loss of enhancer looping to the KLK3 promoter with OC2 OE (Top). ATAC-seq and CUT&RUN-seq of H3K27Ac, H3K27me3, H3K4me3 and AR binding signals were aligned at KLK3 in LNCaP Vec Con and OC2 OE cells (Bottom). (D) KLK3 expression in AR and GR high versus low groups in SU2C cohorts. (E) mCRPC specimens (8) with evidence of AR activity, based on AR signature and positive PSMA staining, which show high OC2 expression, also exhibited either high AR or high GR expression (left). OC2 mRNA level is positively correlated with GR mRNA with Spearman's correlation coefficient (right). (F) OC2-induced GR upregulation with AR suppression in both LNCaP and LAPC4 cells. (G) Integrated HiC with H3K27Ac loops indicating enhancer regions near AR and NR3C1 (GR) promoter loci. (H) Normalized tag densities of CUT&RUN-seq at specific GR binding regions showed increased GR binding on the chromatin. (I) Loss of AR binding and gain of GR binding at the promoter loci of UGT2B15 and UGT2B17 in LNCaP OC2 OE cells. (J) OC2, AR and GR IHC staining in xenograft models created by subcutaneous injection of LNCaP Vec Con and OC2 OE cells.
Figure 5.
Figure 5.
OC2 promotes neuroendocrine features through super-enhancer reprogramming. (A) OC2 signature genes derived from AR-dependent LNCaP cells (Left). And the Gene Set enrichment analysis of OC2 signature genes (Right). (B) Enforced OC2 expression upregulates multiple NE signature genes in LNCaP cells. Non-expressing genes were removed from the heatmap. (C) SYP IHC staining in LNCaP Vec Con and OC2 OE cells xenograft models. (D) Genes proximal to super-enhancer regions identified as newly formed in OC2 OE cells versus control cells with corresponding change in RNA level. (E) Visualization of H3K27Ac signals around TMPRSS2 / FOLH1 (encoding PSMA) and SRRM4 / CLIP2 are shown. (F) Integrated HiC and H3K27Ac signal showed enhancers looped to promoter loci of TMPRSS2 and SRRM4. (G) Expression of TMPRSS2 and SRRM4 in SU2C cohorts stratified by OC2 activity. (H) Upregulation of the splicing factor SRRM4 promotes neural-specific splicing variants with OC2 overexpression (unpaired two-tailed Student's t-test, **P < 0.01, *P< 0.05). (I) Master neuronal suppressor REST was suppressed in the nucleus (middle) through SRRM4-mediated spicing variant REST4 (left), which promotes NE differentiation (right).
Figure 6.
Figure 6.
OC2 is a direct suppressor of active androgen. (A) The same mCRPC patient specimens showing OC2 activity inversely correlated with DHT, testosterone and androstenedione levels. (B) A graphic summary of UGT2B15 and UGT2B17 regulation of androgen glucuronidation to suppress the AR axis. (C) UGT2B15 and UGT2B17 are highly expressed in patients with high OC2 activity. (D) RNA-seq data showing OC2 overexpression induced UGT2B15/17 upregulation while knockdown of OC2 suppressed expression of both genes. (E) Loss of OC2 binding to the UGT2B15 promoter region when the predicted binding site is mutated. Luciferase reporter system showing OC2 upregulates UGT2B15 and UGT2B17. The luciferase signal with the OC2 binding site mutation was not affected by the OC2 inhibitor. (F) In a cell-free system using surface plasmon resonance, the OC2 DNA binding region exhibited high affinity to the wild-type UGT2B15 promoter while the mutated DNA sequence (90 nM) exhibited no binding signal. (G) Glucuronidation is highly activated in the OC2 OE condition.
Figure 7.
Figure 7.
OC2 inhibition suppresses lineage plasticity evoked by enzalutamide. (A) Pre- and post-enzalutamide treatment in the same patients showed OC2 activation following ARSI therapy (GSE197780). (B) OC2 inhibitor blocks enzalutamide-induced SYP expression in LNCaP cells. (Enzalutamide: 10uM; OC2 inhibitor: 10 uM). (C) Simultaneous combination (Combined) treatment of OC2 inhibitor with enzalutamide broadly suppressed enzalutamide-induced gene expression changes versus control. (D) AR, Stem and NE lineages were repressed by combined treatment with OC2 inhibitor. Heatmap of gene expression in these three lineages is shown. Non-expressing genes were removed from the heatmap. (E) Combined treatment with OC2 inhibitor greatly suppressed enzalutamide-induced chromatin accessibility changes (enzalutamide: 10 uM; OC2 inhibitor: 10 uM). (F) GIGGLE analysis identified FOXA1 as the most enriched TF in suppressed hyper-accessible regions of combination treatment versus enzalutamide alone. (G) FOXA1 CUT&RUN-seq showed combined treatment with OC2 inhibitor suppressed FOXA1-driven chromatin accessibility changes. (H-I) A gene signature derived from post-enzalutamide patient samples was consistent with perturbed genes seen in enzalutamide-treated LNCaP cells. SC treatment with OC2 inhibitor blocked enzalutamide-induced gene perturbation.

References

    1. Yamada Y., Beltran H. Clinical and biological features of neuroendocrine prostate cancer. Curr. Oncol. Rep. 2021; 23:15. - PMC - PubMed
    1. Arora V.K., Schenkein E., Murali R., Subudhi S.K., Wongvipat J., Balbas M.D., Shah N., Cai L., Efstathiou E., Logothetis C. et al. . Glucocorticoid receptor confers resistance to antiandrogens by bypassing androgen receptor blockade. Cell. 2013; 155:1309–1322. - PMC - PubMed
    1. Rotinen M., You S., Yang J., Coetzee S.G., Reis-Sobreiro M., Huang W.C., Huang F., Pan X., Yanez A., Hazelett D.J. et al. . ONECUT2 is a targetable master regulator of lethal prostate cancer that suppresses the androgen axis. Nat. Med. 2018; 24:1887–1898. - PMC - PubMed
    1. Guo H., Ci X., Ahmed M., Hua J.T., Soares F., Lin D., Puca L., Vosoughi A., Xue H., Li E. et al. . ONECUT2 is a driver of neuroendocrine prostate cancer. Nat. Commun. 2019; 10:278. - PMC - PubMed
    1. Liberzon A., Birger C., Thorvaldsdottir H., Ghandi M., Mesirov J.P., Tamayo P. The Molecular Signatures Database (MSigDB) hallmark gene set collection. Cell Syst. 2015; 1:417–425. - PMC - PubMed

MeSH terms