. 2024 Jun 26;14(6):e11571.
doi: 10.1002/ece3.11571. eCollection 2024 Jun.

The devil is in the detail: Environmental variables frequently used for habitat suitability modeling lack information for forest-dwelling bats in Germany

Affiliations

The devil is in the detail: Environmental variables frequently used for habitat suitability modeling lack information for forest-dwelling bats in Germany

Lisa Bald et al. Ecol Evol. .

Abstract

In response to the pressing challenges of the ongoing biodiversity crisis, the protection of endangered species and their habitats, as well as the monitoring of invasive species are crucial. Habitat suitability modeling (HSM) is often treated as the silver bullet to address these challenges, commonly relying on generic variables sourced from widely available datasets. However, for species with high habitat requirements, or for modeling the suitability of habitats within the geographic range of a species, variables at a coarse level of detail may fall short. Consequently, there is potential value in considering the incorporation of more targeted data, which may extend beyond readily available land cover and climate datasets. In this study, we investigate the impact of incorporating targeted land cover variables (specifically tree species composition) and vertical structure information (derived from LiDAR data) on HSM outcomes for three forest specialist bat species (Barbastella barbastellus, Myotis bechsteinii, and Plecotus auritus) in Rhineland-Palatinate, Germany, compared to commonly utilized environmental variables, such as generic land-cover classifications (e.g., Corine Land Cover) and climate variables (e.g., Bioclim). The integration of targeted variables enhanced the performance of habitat suitability models for all three bat species. Furthermore, our results showed a high difference in the distribution maps that resulted from using different levels of detail in environmental variables. This underscores the importance of making the effort to generate the appropriate variables, rather than simply relying on commonly used ones, and the necessity of exercising caution when using habitat models as a tool to inform conservation strategies and spatial planning efforts.

Keywords: bats; habitat suitability modeling; land cover/land use; nature conservation; spatialMaxent; species distribution modeling.


Conflict of interest statement

The authors have no conflict of interest to declare.

Figures

FIGURE 1
FIGURE 1
Study area. (a) Location of the study area, the federal state of Rhineland‐Palatinate, in Europe, Germany. (b) Forest cover of the study area (dark shading indicates forest cover and light shading indicates no forest cover). Data: EEA (2022) and OpenStreetMap (2023).
FIGURE 2
FIGURE 2
Spatial folds delineating occurrence records for each bat species. Roosting sites of three bat species in Rhineland‐Palatinate, Germany, partitioned into spatial folds for validation and testing. Each fold encompasses multiple roosting sites.
FIGURE 3
FIGURE 3
Habitat suitability modeling workflow. This flowchart outlines the comprehensive modeling process for three bat species, employing two modeling approaches with distinct sets of variables. Environmental variables from eight different variable groups, namely global canopy height data (Potapov et al., 2021), OpenStreetMap (OSM) waterways data (OpenStreetMap, 2023), climate data (DWD Climate Data Center [CDC], 2014, 2023a, 2023b, 2023c, 2023d, 2023e, 2023f, 2023g), bioclimatic variables from WorldClim (Fick & Hijmans, 2017), Sentinel‐2 satellite imagery (ESA), Light detection and ranging (LiDAR) data (GeoBasis‐DE/LVermGeoRP, 2021), Corine Land Cover (CLC) data (EEA, 2018), and variables derived from a tree species map (TSM; Bald et al., 2024) were used. Utilizing analytical tools such as Framework for Operational Radiometric Correction for Environmental Monitoring (FORCE; version 3.7.7, Frantz, 2019), Remote Sensing Database (RSDB; Wöllauer et al., 2020), and Fragstats (version 4.2; McGarigal et al., 2023), these inputs were processed to generate indices. The resulting variables were divided into a generalized and a more targeted stack of variables. These variables served as input for the modeling, where two models were created for each bat species. Variables that were part of the generalized variables modeling approach are displayed in orange. Variables that were part of the targeted variables modeling approach are displayed in pink. Variables can be part of both the generalized variables and the targeted variables modeling approach.
FIGURE 4
FIGURE 4
Tree species map and Corine Land Cover. (a) The six most common tree species in the study area are beech, Douglas fir, oak, spruce, pine, and other deciduous trees (Bald et al., 2024). (b) CLC forest classes used in the study: deciduous forest, coniferous forest, and mixed forest (EEA, 2018).
FIGURE 5
FIGURE 5
Comparison of model performance. Mean test results for all three bat species using both targeted variables and generalized variables modeling approaches. Figures (a) to (c) present individual bat species' metric results, comparing the two modeling approaches. Figures (d) and (e) provide a cross‐species comparison between targeted variables and generalized variables modeling approaches. The MAEPO is presented at a reversed scale to enhance readability. Note that comparing metrics to each other is not feasible, as they are on different scales. Only comparisons between different modeling approaches and species are possible for each metric. The axis ranges from 0 to 1 in steps of 0.2, as shown in (a). The direct comparison of modeling approaches for each bat species shows that, with the exception of one metric (CBI, Myotis bechsteinii), the targeted variables modeling approach consistently outperforms the generalized variables modeling approach (a–c).
FIGURE 6
FIGURE 6
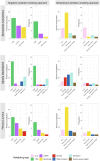
Variable contribution analysis. Each bat species and modeling approach are represented with two plots. The right plot illustrates the cumulative percentage contribution of variables within each variable group. The left plot displays the frequency distribution (number of variables) within each variable group. For the left plot the sum of the percent contribution of the variable group to the model are on the y‐axis and the variable groups on the x‐axis. For the right plot the frequency, how often a variable from the variable group was chosen by the model is on the y‐axis and the variable group on the x‐axis. The variable groups are bioclimatic variables, climatic variables, Corine Land Cover (CLC) variables, distance to water variable, global canopy height variable, light detection and ranging (LiDAR) variables, Sentinel‐2 variables, and tree species map (TSM) variables.
FIGURE 7
FIGURE 7
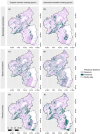
Habitat suitability maps. Maps showing the habitat suitability of the forested areas for all three bat species and the targeted variables (left) and generalized variables (right) modeling approach. Values close to 0 (blue) indicate low habitat suitability while values closer to 1 (red) indicate high habitat suitability. Study area is in white.
FIGURE 8
FIGURE 8
Presence–absence maps. Showing presence–absence maps of the forested areas for all three bat species using the targeted variables (left) and generalized variables (right) modeling approach. Study area is in white. Differences in mapped area between targeted variables and generalized variables modeling approach for the species are as follows: Myotis bechsteinii 544.33 km2, Plecotus auritus 385.35 km2, and Barbastella barbastellus 218.31 km2.
FIGURE A1
FIGURE A1
Variable importance of all three bat species and two modeling approaches (targeted variables (left) and generalized variables (right)). Variable importance in percent. Color of the variable bar plot indicates from which data source the variable was derived. The variable groups are bioclimatic variables, climatic variables, Corine Land Cover (CLC) variables, distance to water variable, global canopy height variable, light detection and ranging (LiDAR) variables, Sentinel‐2 variables, and tree species map (TSM) variables.

References

    1. Abdi, A. (2013). Integrating open access geospatial data to map the habitat suitability of the declining corn bunting (Miliaria calandra). ISPRS International Journal of Geo‐Information, 2(4), 935–954. 10.3390/ijgi2040935 - DOI
    1. Aiello‐Lammens, M. E. , Boria, R. A. , Radosavljevic, A. , Vilela, B. , & Anderson, R. P. (2015). spThin: An R package for spatial thinning of species occurrence records for use in ecological niche models. Ecography, 38(5), 541–545. 10.1111/ecog.01132 - DOI
    1. Allouche, O. , Tsoar, A. , & Kadmon, R. (2006). Assessing the accuracy of species distribution models: Prevalence, kappa and the true skill statistic (TSS). Journal of Applied Ecology, 43(6), 1223–1232. 10.1111/j.1365-2664.2006.01214.x - DOI
    1. Amini Tehrani, N. , Naimi, B. , & Jaboyedoff, M. (2020). Toward community predictions: Multi‐scale modelling of mountain breeding birds' habitat suitability, landscape preferences, and environmental drivers. Ecology and Evolution, 10(12), 5544–5557. 10.1002/ece3.6295 - DOI - PMC - PubMed
    1. Andersen, B. R. , McGuire, L. P. , Wigley, T. B. , Miller, D. A. , & Stevens, R. D. (2022). Habitat associations of overwintering bats in managed pine forest landscapes. Forests, 13(5), 803. 10.3390/f13050803 - DOI

LinkOut - more resources