. 2024 Jun 25;14(6):e11540.
doi: 10.1002/ece3.11540. eCollection 2024 Jun.

A niche-based theory of island biogeography

Affiliations

A niche-based theory of island biogeography

Gregory Beaugrand et al. Ecol Evol. .

Abstract

The equilibrium theory of island biogeography (ETIB) is a widely applied dynamic theory proposed in the 1960s to explain why islands have coherent differences in species richness. The development of the ETIB was temporarily challenged in the 1970s by the alternative static theory of ecological impoverishment (TEI). The TEI suggests that the number of species on an island is determined by its number of habitats or niches but, with no clear evidence relating species richness to the number of niches however, the TEI has been almost dismissed as a theory in favour of the original ETIB. Here, we show that the number of climatic niches on islands is an important predictor of the species richness of plants, herpetofauna and land birds. We therefore propose a model called the niche-based theory of island biogeography (NTIB), based on the MacroEcological Theory on the Arrangement of Life (METAL), which successfully integrates the number of niches sensu Hutchinson into ETIB. To account for greater species turnover at the beginning of colonisation, we include higher initial extinction rates. When we test our NTIB for resident land birds in the Krakatau Islands, it reveals a good correspondence with observed species richness, immigration and extinction rates. Provided the environmental regime remains unchanged, we estimate that the current species richness at equilibrium is ~45 species (range between 38.39 and 61.51). Our NTIB provides better prediction because it counts for changes in species richness with latitude, which is not considered in any theory of island biogeography.

Keywords: area; biodiversity; island biogeography; niche theory.


Conflict of interest statement

The authors declare no competing financial interests.

Figures

FIGURE 1
FIGURE 1
Relationships between species richness of an island, its area, the number of climatic niches, distance to mainland and latitude. Scatterplots of observed species richness in each island as a function of area (a–c), mean predicted number of climatic niches (d–f) and distance to mainland (g–i) for plants (a, d, g), herpetofauna (b, e, h) and birds (c, f, i). The size and the colour of the circles are proportional to the absolute value of latitudes (between 0° and 80°). The ordinary linear coefficient of correlation is indicated on each panel. All correlation coefficients, but panel h, were significant at p < .01. n is the number of couple of points used to calculate the correlation. All variables were log10‐transformed.
FIGURE 2
FIGURE 2
Relationships between observed species richness and richness predicted from a linear multiple regression model using area, the number of climatic niches and distance to mainland. Scatterplot of observed versus predicted species richness from the number of climatic niches M, area A and distance to continent d. The ordinary linear coefficient of correlation is indicated. The correlation was highly significant at p < .01. n is the number of couple of points used to calculate the linear correlation.
FIGURE 3
FIGURE 3
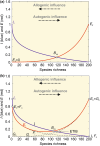
Model of island biogeography of (a) MacArthur and Wilson (1963, 1967) and (b) its modification proposed here. (a) In ETIB, B eq (Table S1) is reached when the monotonic reduction in immigration rate I (blue curve, with I 0 ≤ I t ≤ I s) crosses the monotonic increase in extinction rate (red curve, with E 0 ≤ E t ≤ E s). Note that immigration can be supplemented by speciation at first approximation, especially when distance to mainland is high (Lomolino et al., 2006); see Section 4. (b) In our model, as in ETIB, changes in I is modelled by a negative exponential function standardised between I 0 and IS, with I 0 = 1 at t = 0 and I S = 0 at saturation as an example. In contrast to ETIB, changes in total extinction rate (red line) are the results of two functions: a negative (i.e. short‐term extinction rate F t at year t with F 0 ≤ F t ≤ F s) and a positive (i.e. long‐term extinction rate Gt with G 0 ≤ G t ≤ G s) exponential function (red and black dashed lines for both functions). The first negative exponential function that is extended by a black dashed line (toward the right from the red curve) dominates for low values of species richness, that is at the beginning of island colonisation; initially the short‐term extinction rate was fixed to 0.8 in this example (E 0 = F 0 = 0.8). The second positive exponential function that is also extended by a black dashed line (toward the left from the red curve) is dominant for higher values of species richness, that is from the middle part of island colonisation. In this example, G t was standardised between G 0 = 0 and G S = E s = 1. Black dashed curves are never observed. Our model equals ETIB when the first negative exponential function is nil (i.e. E 0 = 0). Our model is a nonequilibrium model because B eq can be altered when species richness at saturation is modified by an environmental modification that affects both immigration and extinction rates (see Section 2).
FIGURE 4
FIGURE 4
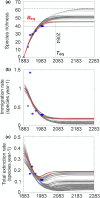
Long‐term changes in species richness (a), immigration (b) and (c) total extinction rates of land birds in Krakatau Islands. On panel (a), levels (minimum, maximum and optimal values) and timing at which species richness flattened off are indicated. On each panel, the red curve denotes the optimal model (i.e. with lowest RMSE), and the grey curves are the 1000 curves with the lowest RMSE out of a total of 1,935,360 possible estimates. Blue circles are observed number of resident land birds carried out on the island. 1883 was the year when the eruption of Krakatau sterilised the island. Species richness at equilibrium B eq (see Figure 3) and year at which equilibrium is reached yeareq are indicated. Here B eq = 44.60 species (range of values based on 1000 curves with smallest RMSE, 38.69–61.51 species) and T eq = 181 years (136–379 years) after 1883, or yeareq = 2064 (2019–2262). Parameters of the best model were I 0 = 1 (range for the 1000 curves, 0.9–1.1), b 1 = 2 (1.4–2), b 2 = 10 (8–150) and b 3 = 0.001 (0.0001–0.01), σ = 0.35 (0.3–0.45) and ϕ = 0.0005 (0.0004–0.0006). Because B s = ϕ × M, species at saturation B s = 52.5 (42.03–63.05) species. Other fixed parameters were M = 105,082 niches, E 0 = 0, E S = 1 and I S = 0.

References

    1. Abbott, I. , & Grant, P. R. (1976). Nonequilibrial bird faunas on islands. The American Naturalist, 110, 507–528.
    1. Arrhenius, O. (1921). Species and area. Journal of Ecology, 9, 95–99.
    1. Barajas‐Barbosa, M. P. , Weigelt, P. , Borregaard, M. K. , Keppel, G. , & Kreft, H. (2020). Environmental heterogeneity dynamics drive plant diversity on oceanic islands. Journal of Biogeography, 47, 2248–2260.
    1. Beaugrand, G. (2015). Marine biodiversity, climatic variability and global change. Routledge.
    1. Beaugrand, G. (2023). Towards an understanding of large‐scale biodiversity patterns on land and in the sea. Biology, 12, 339. 10.3390/biology12030339 - DOI - PMC - PubMed

LinkOut - more resources