. 2024 Jun 12:18:1409974.
doi: 10.3389/fncel.2024.1409974. eCollection 2024.

Dendritic morphology of motor neurons and interneurons within the compact, semicompact, and loose formations of the rat nucleus ambiguus

Affiliations

Dendritic morphology of motor neurons and interneurons within the compact, semicompact, and loose formations of the rat nucleus ambiguus

Matthew J Fogarty. Front Cell Neurosci. .

Abstract

Introduction: Motor neurons (MNs) within the nucleus ambiguus innervate the skeletal muscles of the larynx, pharynx, and oesophagus. These muscles are activated during vocalisation and swallowing and must be coordinated with several respiratory and other behaviours. Despite many studies evaluating the projections and orientation of MNs within the nucleus ambiguus, there is no quantitative information regarding the dendritic arbours of MNs residing in the compact, and semicompact/loose formations of the nucleus ambiguus..

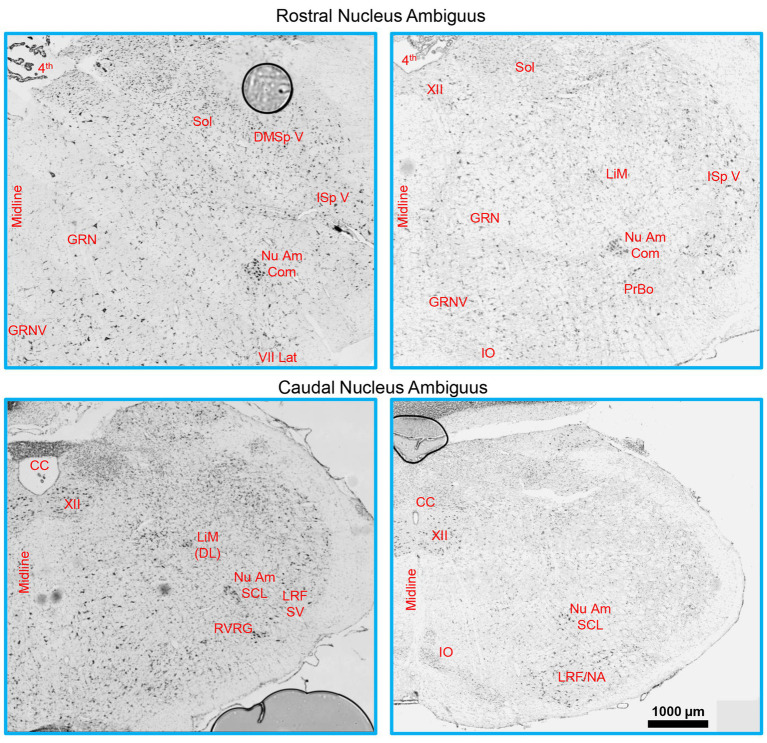
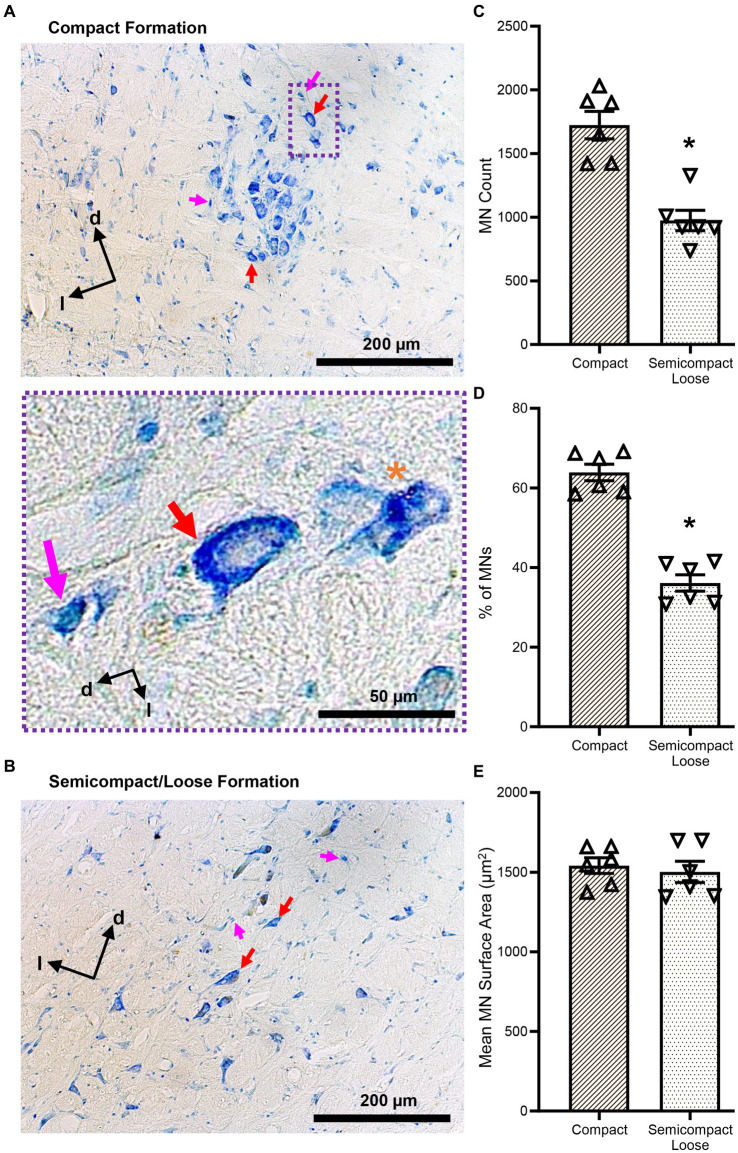
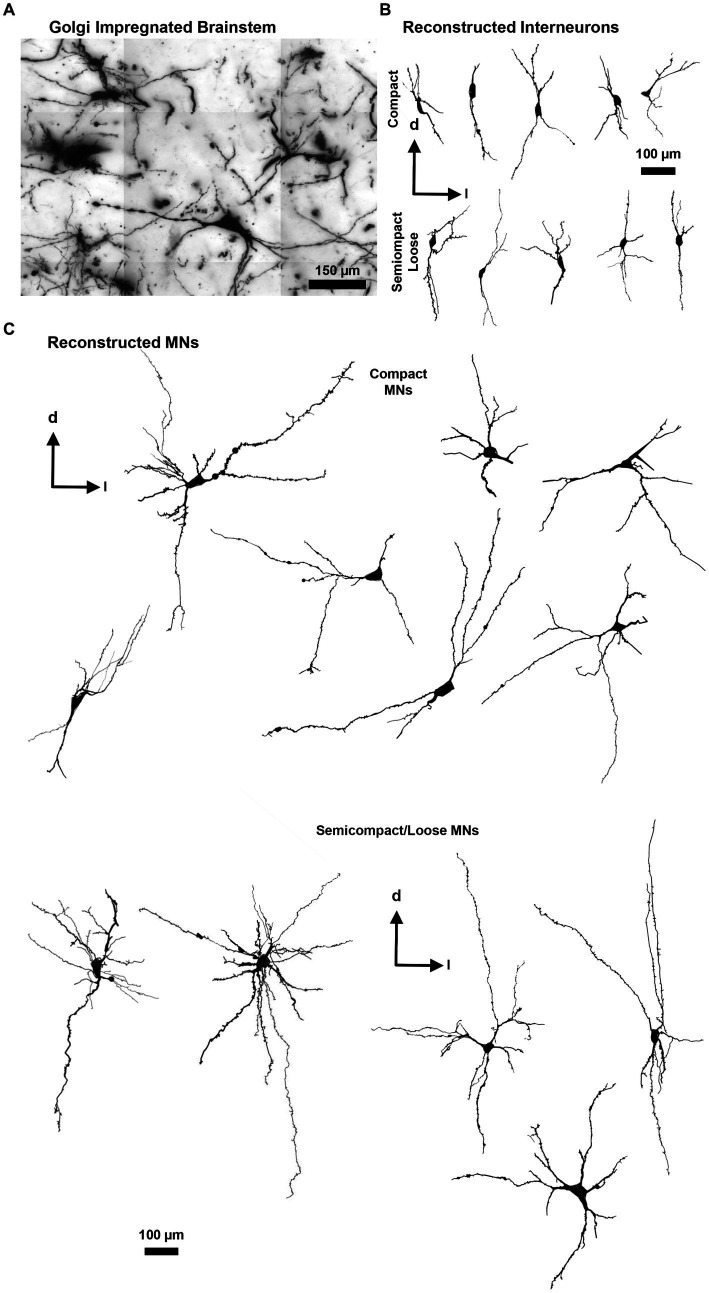
Methods: In female and male Fischer 344 rats, we evaluated MN number using Nissl staining, and MN and non-MN dendritic morphology using Golgi-Cox impregnation Brightfield imaging of transverse Nissl sections (15 μm) were taken to stereologically assess the number of nucleus ambiguus MNs within the compact and semicompact/loose formations. Pseudo-confocal imaging of Golgi-impregnated neurons within the nucleus ambiguus (sectioned transversely at 180 μm) was traced in 3D to determine dendritic arbourisation.

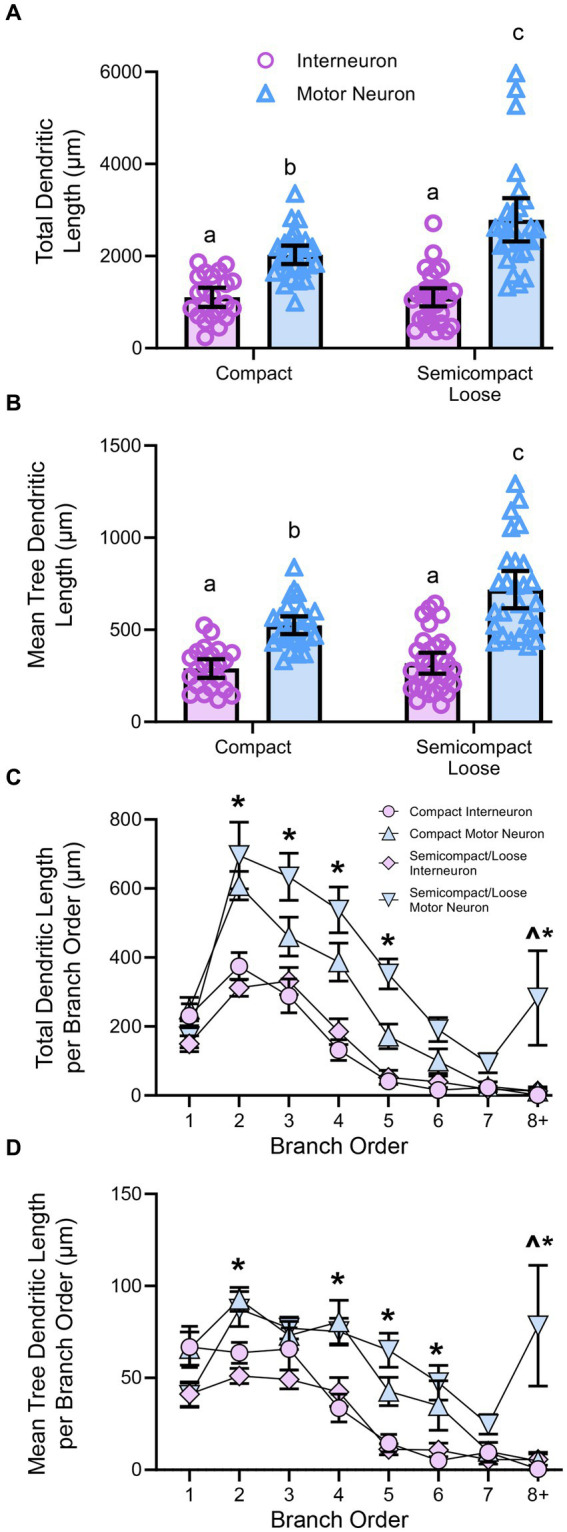
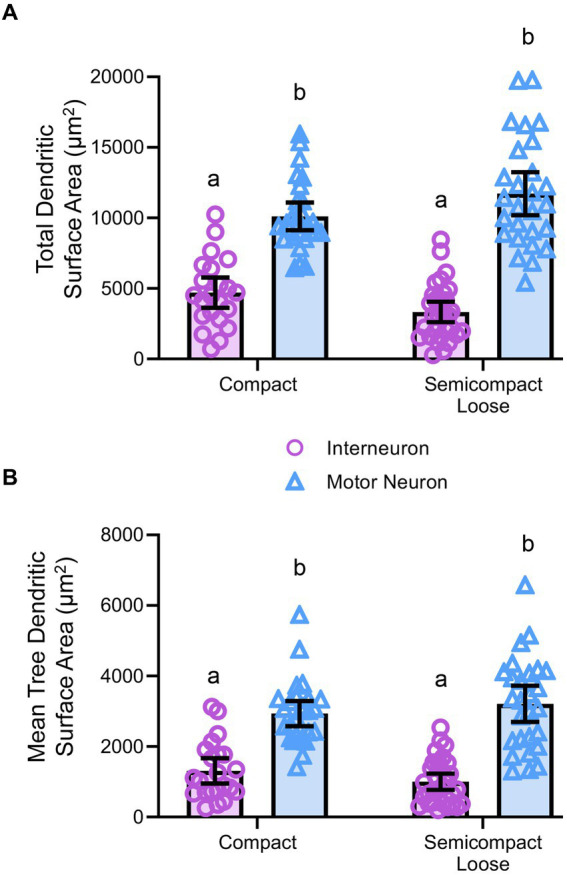
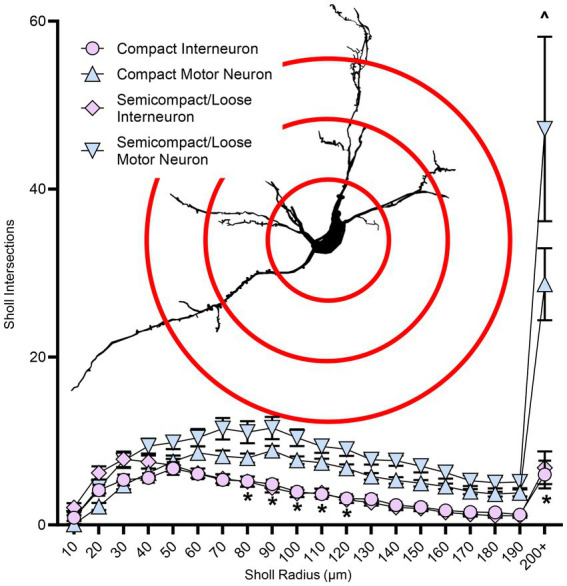
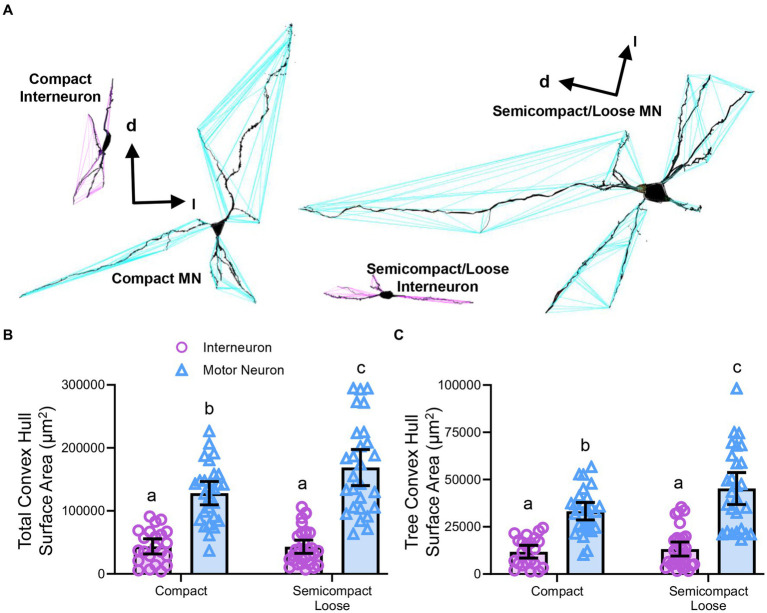
Results: We found a greater abundance of MNs within the compact than the semicompact/loose formations. Dendritic lengths, complexity, and convex hull surface areas were greatest in MNs of the semicompact/loose formation, with compact formation MNs being smaller. MNs from both regions were larger than non-MNs reconstructed within the nucleus ambiguus.

Conclusion: Adding HBLS to the diet could be a potentially effective strategy to improve horses' health.

Keywords: Golgi–Cox; brainstem; convex hull; swallow; vocalisation.


Conflict of interest statement

The author declares that the research was conducted in the absence of any commercial or financial relationships that could be construed as a potential conflict of interest.

Figures

Figure 1
Figure 1
A Brainstem Nissl staining showing the rostral (top row) and caudal (bottom row) nucleus ambiguus identified. The compact formation of the nucleus ambiguus was relatively circular and started at the very caudal end of the lateral portion of the facial nucleus and extended to ~0.5–1 mm prior to the closure of the central canal. The semicompact/loose formations of the nucleus ambiguus were more ovoid in shape, commencing ~0.5–1 mm rostral to the formation of the central canal, and were immediately dorsal to the rostroventral respiratory group. 4th, fourth ventricle; CC, central canal; DMSp V, dorsomedial/spinal trigeminal nucleus; GRN, gigantocellular reticular nucleus; GRNV, ventral gigantocellular reticular nucleus; IO, inferior olive; ISp V, interpolar spinal trigeminal nucleus; LiM, linear nucleus of the medulla; LiM (DL), linear nucleus of the medulla (dorsolateral to main nucleus ambiguus); LRF/NA, lateral reticular formation noradrenaline cells; LRF SV, lateral reticular formation subtrigeminal region; Nu Am Com, compact formation of the nucleus ambiguus; Nu Am SCL, semicompact/loose formation of the nucleus ambiguus; PrBo, pre-pre-Bötzinger complex; RVRG, rostral ventral respiratory group; Sol, solitary tract; VII lat, lateral portion of the facial nucleus; XII, hypoglossal nucleus.
Figure 2
Figure 2
(A,B) Show brightfield images of Nissl-stained MNs within the compact and semicompact/loose formations, respectively, exhibiting classical histological characteristics of large cytoplasm and prominent nucleoli (red arrows). Non-MNs (putative interneurons), excluded from MN counts, are identified by pink arrows. Dorsal (d) and lateral (l) are also indicated on the images. The inset (purple dashed area) shows a higher powered image of an excluded non-MN (pink arrow) an example MN (red arrow), and a fragmented cell excluded from counting (orange asterisk). (C) Plots of reduced MN counts (mean ± 95% CI) in the semicompact/loose formations of the nucleus ambiguus compared to the compact formation. (D) Plots of reduced % of total MN (mean ± 95% CI) in the semicompact/loose formations of the nucleus ambiguus compared to the compact formation. (E) Plots of unchanged mean MN surface areas (mean ± 95% CI) between semicompact/loose formations and the compact formation of the nucleus ambiguus. All analyses were carried out using paired Student’s t-tests, *denotes statistical differences between groups (i.e., p < 0.05).
Figure 3
Figure 3
(A) Golgi-impregnated brainstem showing staining of nucleus ambiguus neurons. The tessellations are an artefact of the mosaic imaging process, this image is a minimum-intensity projection of five optical slices. (B) Representative Neurolucida tracings of nucleus ambiguus interneurons within the complex formation (top row) and the semicomplex/loose formations (bottom row). (C) Representative Neurolucida tracings of nucleus ambiguus MNs within the complex formation (top group) and the semicomplex/loose formations (bottom group). Dorsal (d) and lateral (l) are also indicated on the images.
Figure 4
Figure 4
(A) Plots showing smaller total dendritic tree length (± 95% CI) in nucleus ambiguus interneurons compared to MNs, with semicompact/loose formation MN larger than compact formation MNs (two-way ANOVA with Bonferroni post-tests, with different letters denoting statistical differences between groups [i.e., p < 0.05]). (B) Plots showing smaller mean tree dendritic length (± 95% CI) in nucleus ambiguus interneurons compared to MNs, with semicompact/loose formation MN larger than compact formation MNs (two-way ANOVA with Bonferroni post-tests, with different letters denoting statistical differences between groups [i.e., p < 0.05]). (C) Plots of reduced total dendritic length per branch order of nucleus ambiguus interneurons compared to MNs; and reductions in compact MNs compared to semicompact/loose MNs at the eighth branch order and greater (three-way ANOVA with Bonferroni post-tests, *denotes the statistical difference between MNs and interneurons, ^denotes the statistical difference between compact MNs and semicompact/loose MNs [i.e., p < 0.05]). (D) Plots of reduced mean tree dendritic length per branch order of nucleus ambiguus interneurons compared to MNs; and reductions in compact MNs compared to semicompact/loose MNs at the eighth branch order and greater (three-way ANOVA with Bonferroni post-tests, *denotes statistical difference between MNs and interneurons, ^denotes statistical difference between compact MNs and semicompact/loose MNs [i.e., p < 0.05]). Dorsal (d) and lateral (l) are also indicated on the images.
Figure 5
Figure 5
(A) Plots of smaller total dendritic surface area (± 95% CI) in nucleus ambiguus interneurons compared to MNs. (B) Plots of smaller mean tree surface areas (± 95% CI) in nucleus ambiguus interneurons compared to MNs. All analyses are two-way ANOVAs with Bonferroni post-tests, where appropriate. Different superscript letters denote statistical differences between groups (i.e., p < 0.05).
Figure 6
Figure 6
Plots of reduced dendritic Sholl interactions (mean ± SEM) in nucleus ambiguus interneurons compared to MNs, with semicompact/loose formation MNs having more Sholl interactions at very distal regions compared to compact formation MNs. Analysis three-way ANOVA with Bonferroni post-tests, *denotes statistical difference between MNs and interneurons, ^ denotes statistical difference between compact MNs and semicompact/loose MNs (i.e., p < 0.05). Insets show examples of Sholl analysis of a nucleus ambiguus MN; Sholl radii (red) are separated by 75 μm.
Figure 7
Figure 7
(A) 3D reconstruction of convex hulls (purple and blue polygons) of compact, semicompact/loose MNs and interneurons. (B) Plot shows smaller total dendritic tree convex hull surface areas (± 95% CI) in nucleus ambiguus interneurons compared to MNs, with semicompact/loose formation MN larger than compact formation MNs. (C) Plot shows smaller mean tree convex hull surface areas (± 95% CI) in nucleus ambiguus interneurons compared to MNs, with semicompact/loose formation MN larger than compact formation MNs. All analyses two-way ANOVAs with Bonferroni post-tests, with different letters denoting statistical differences between groups (i.e., p < 0.05). Dorsal (d) and lateral (l) are also indicated on the images.

Similar articles

Cited by

References

    1. Ahmed R. M., Devenney E. M., Irish M., Ittner A., Naismith S., Ittner L. M., et al. . (2016). Neuronal network disintegration: common pathways linking neurodegenerative diseases. J. Neurol. Neurosurg. Psychiatry 87, 1234–1241. doi: 10.1136/jnnp-2014-308350, PMID: - DOI - PMC - PubMed
    1. Altschuler S. M., Bao X. M., Miselis R. R. (1991). Dendritic architecture of nucleus ambiguus motoneurons projecting to the upper alimentary tract in the rat. J. Comp. Neurol. 309, 402–414. doi: 10.1002/cne.903090309, PMID: - DOI - PubMed
    1. Amri M., Lamkadem M., Car A. (1991). Effects of lingual nerve and chewing cortex stimulation upon activity of the swallowing neurons located in the region of the hypoglossal motor nucleus. Brain Res. 548, 149–155. doi: 10.1016/0006-8993(91)91116-I - DOI - PubMed
    1. Andrew B. L. (1954). Proprioception at the joint of the epiglottis of the rat. J. Physiol. 126, 507–523. doi: 10.1113/jphysiol.1954.sp005225, PMID: - DOI - PMC - PubMed
    1. Andrew B. L. (1955). The respiratory displacement of the larynx: a study of the innervation of accessory respiratory muscles. J. Physiol. 130, 474–487. doi: 10.1113/jphysiol.1955.sp005421, PMID: - DOI - PMC - PubMed

LinkOut - more resources