. 2024 Jun 12:15:1400641.
doi: 10.3389/fimmu.2024.1400641. eCollection 2024.

Single-cell profiling indicates a high similarity between immune cells in the cerebrospinal fluid and in meningeal ectopic lymphoid tissue in experimental autoimmune encephalomyelitis

Affiliations

Single-cell profiling indicates a high similarity between immune cells in the cerebrospinal fluid and in meningeal ectopic lymphoid tissue in experimental autoimmune encephalomyelitis

Tanya Georgieva et al. Front Immunol. .

Abstract

Background and objectives: B cell depleting anti-CD20 monoclonal antibodies (aCD20 mAbs) are highly effective in treatment of multiple sclerosis (MS) but fail to halt the formation of meningeal ectopic lymphoid tissue (mELT) in the murine model experimental autoimmune encephalomyelitis (EAE). While mELT can be examined in EAE, it is not accessible in vivo in MS patients. Our key objectives were to compare the immune cells in cerebrospinal fluid (CSF), which is accessible in patients, with those in mELT, and to study the effects of aCD20 mAbs on CSF and mELT in EAE.

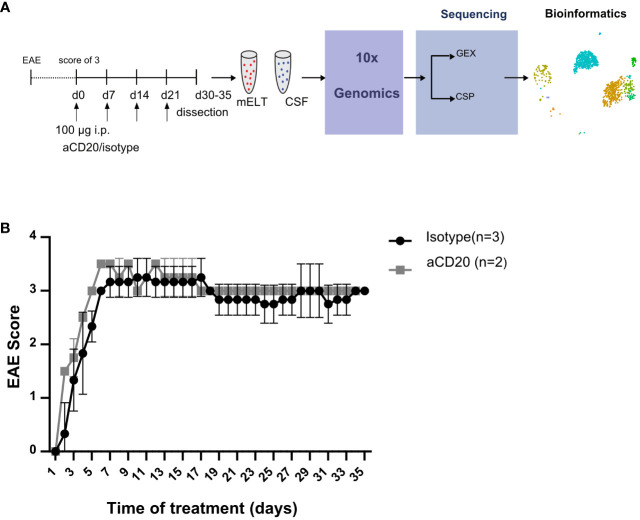
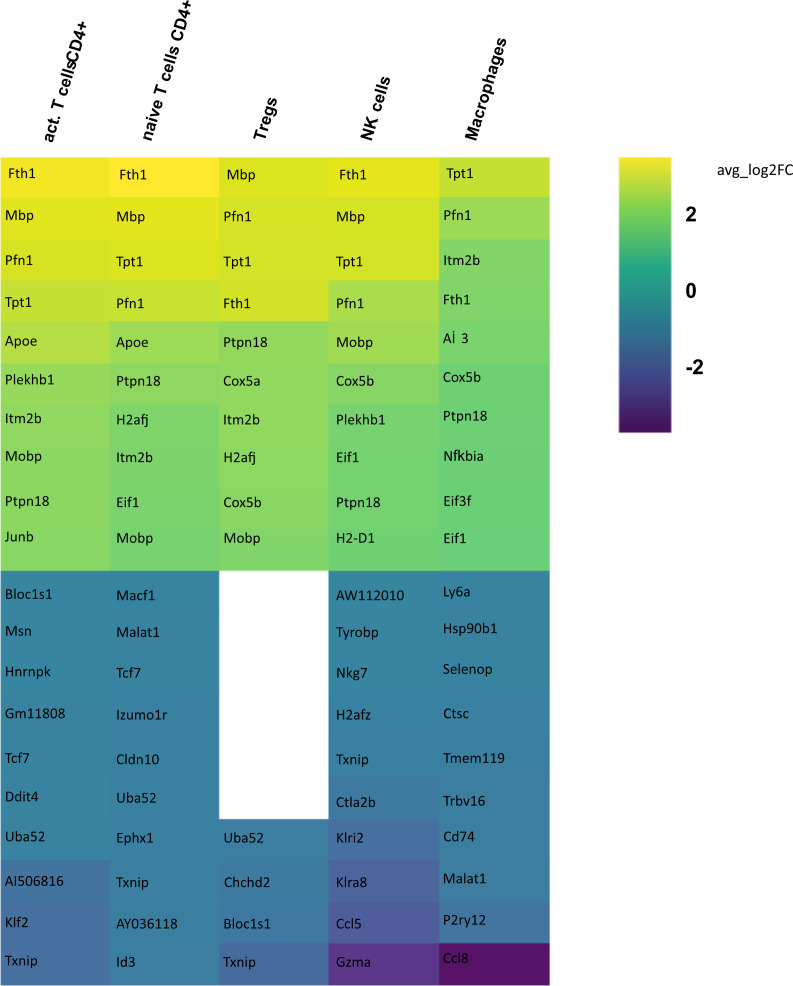
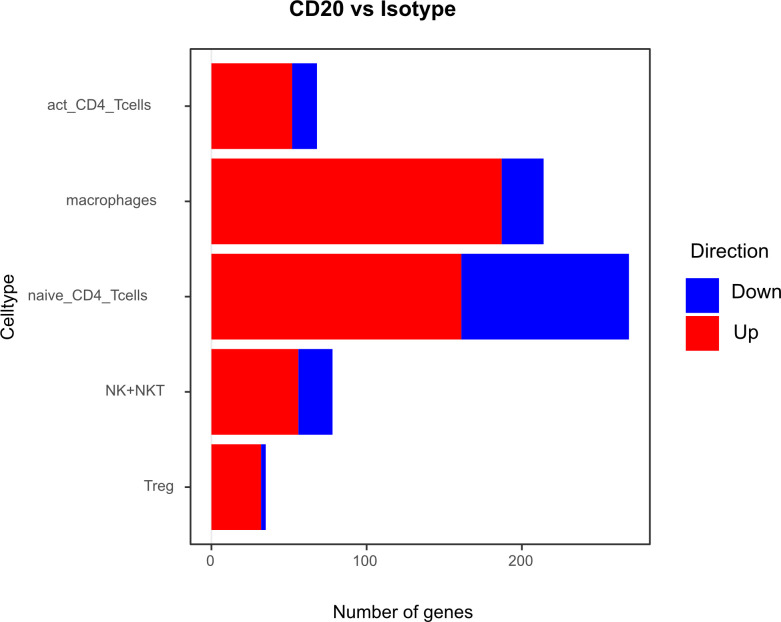
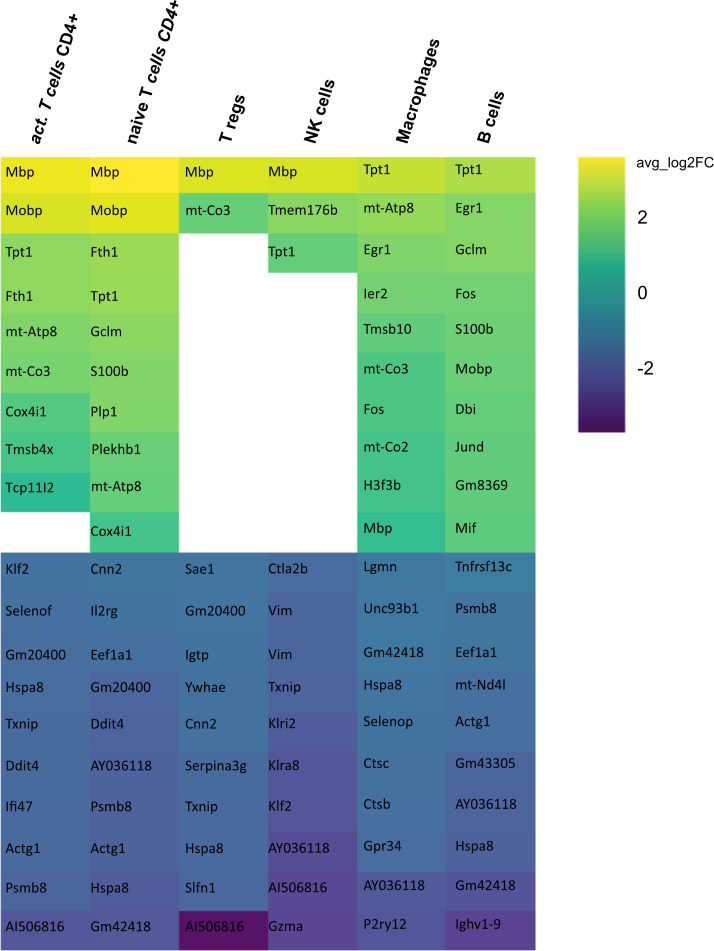
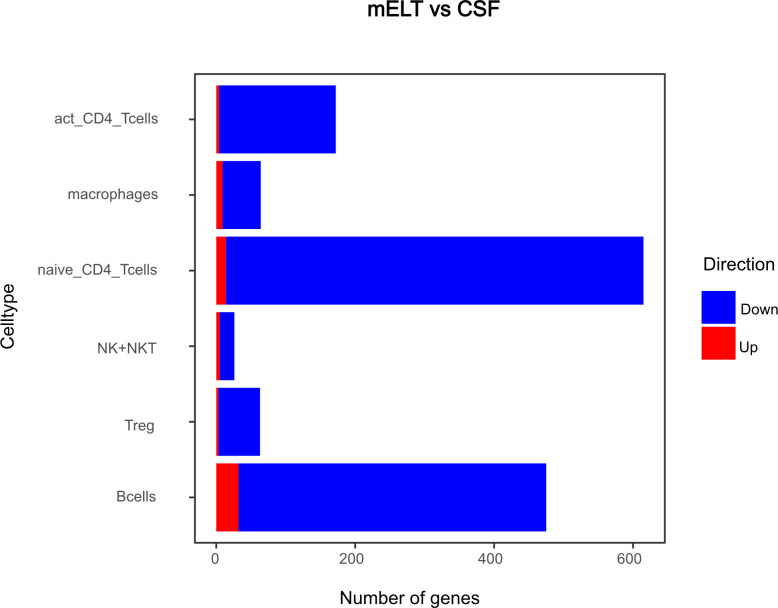
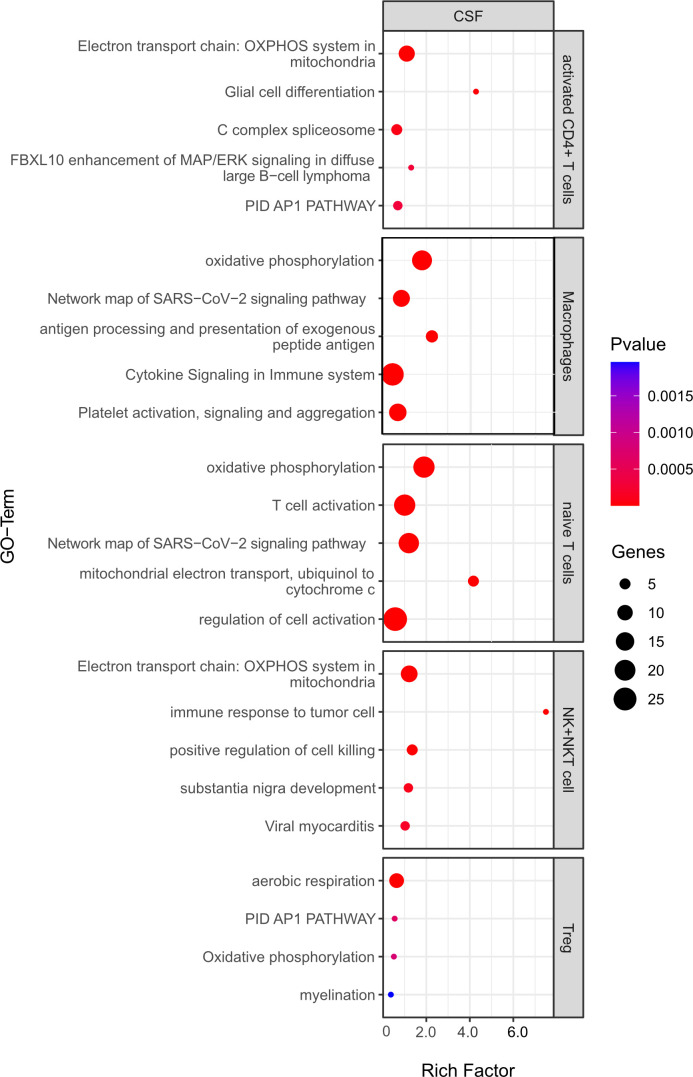
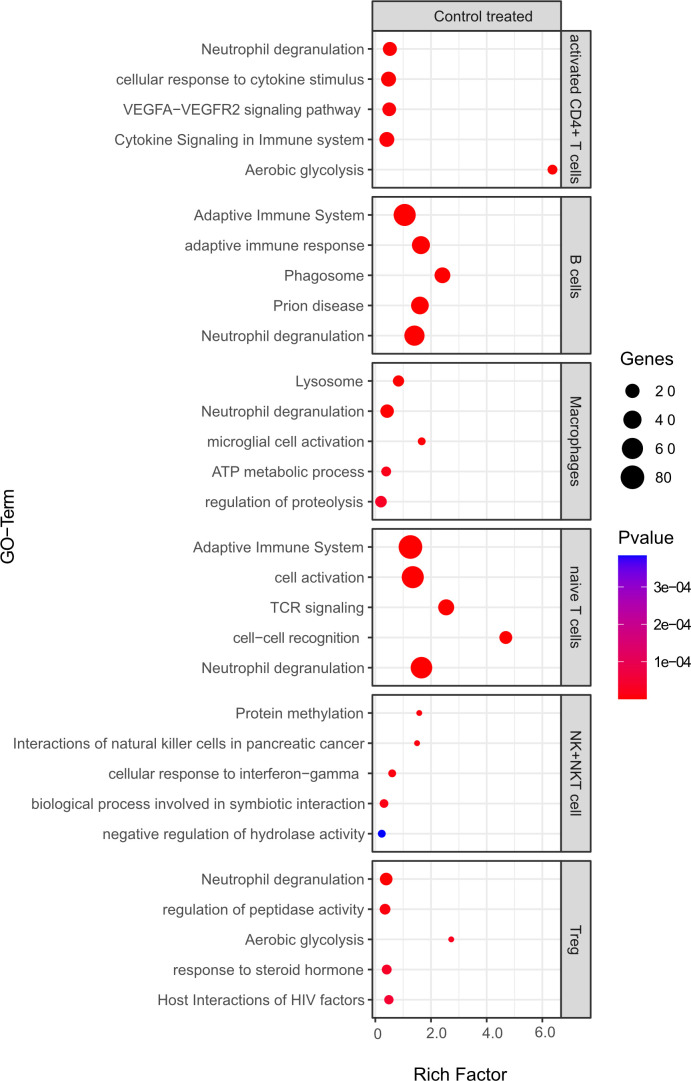
Methods: Applying single cell RNA sequencing, we compared gene expression profiles in immune cells from (1) CSF with mELT and (2) aCD20 mAbs treated with control treated mice in a spontaneous 2D2xTh EAE model.

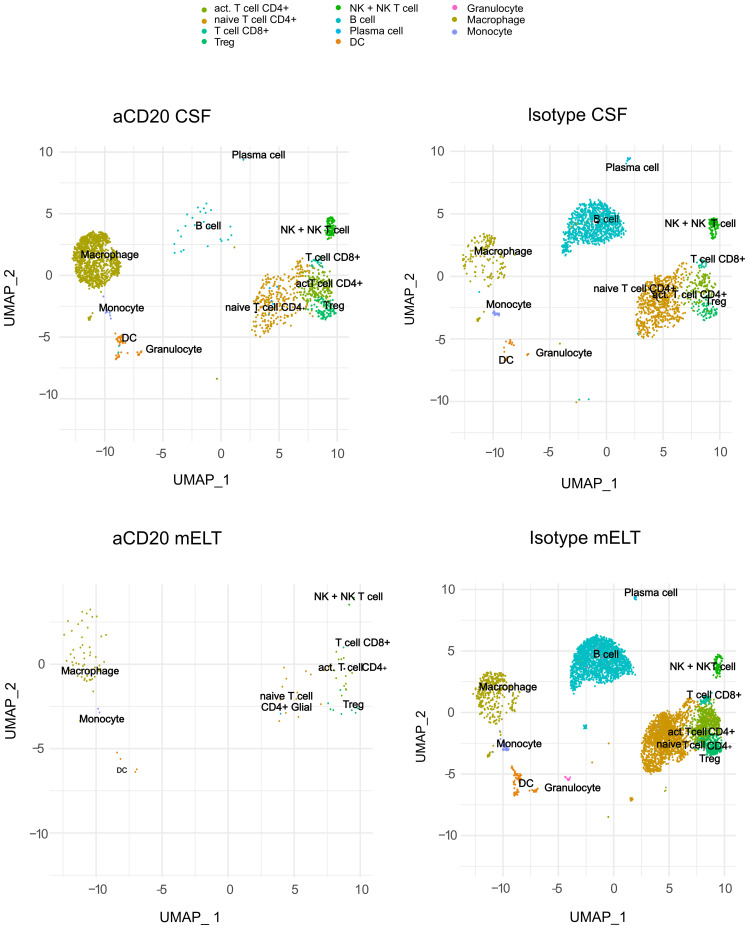
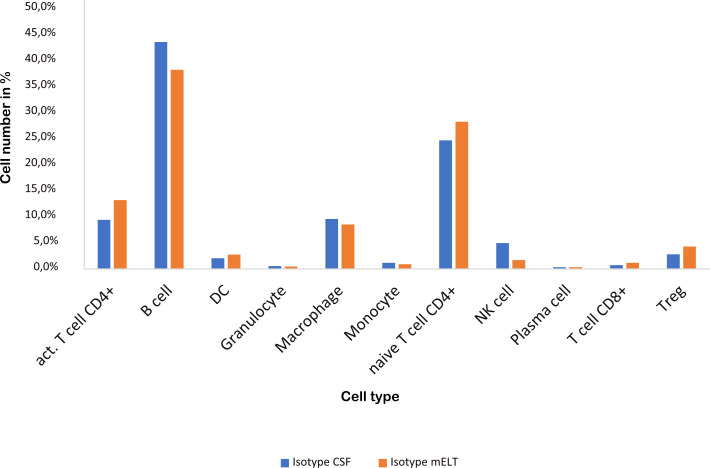
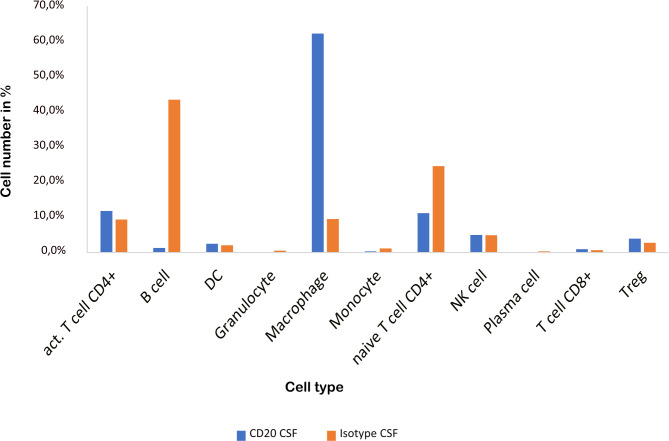
Results: The immune cell composition in CSF and mELT was very similar. Gene expression profiles and pathway enrichment analysis revealed no striking differences between the two compartments. aCD20 mAbs led not only to a virtually complete depletion of B cells in the CSF but also to a reduction of naïve CD4+ T cells and marked increase of macrophages. No remarkable differences in regulated genes or pathways were observed.

Discussion: Our results suggest that immune cells in the CSF may serve as a surrogate for mELT in EAE. Future studies are required to confirm this in MS patients. The observed increase of macrophages in B cell depleted CSF is a novel finding and requires verification in CSF of aCD20 mAbs treated MS patients. Due to unresolved technical challenges, we were unable to study the effects of aCD20 mAbs on mELT. This should be addressed in future studies.

Keywords: B cells; anti-CD20 treatment; ectopic lymphoid tissue; experimental autoimmune encephalomyelitis; multiple sclerosis; single-cell sequencing.


Conflict of interest statement

KL-H has received research support to TUM from Novartis and honoraria and compensation for travel expenses from Novartis, FHLR, Biogen, Teva, Hexal, Bayer, and Merck Serono. The remaining authors declare that the research was conducted in the absence of any commercial or financial relationships that could be constructed as a potential conflict of interest.

Figures

Figure 1
Figure 1
Study design and EAE score. (A) Mice were treated with a weekly dose of 100 μg of aCD20 mAb (n = 2) or isotype control (n = 3). On day 30-35, mice were dissected, and cell surface protein (CSP) and gene expression (GEX) libraries prepared and sequenced using 10x Genomics technology before bioinformatics analyses. (B) Daily evaluated EAE scores over the experimental period. Error bars show +/- SEM for the control group only.
Figure 2
Figure 2
Uniform manifold approximation and projection (UMAP) plot representing 11 color-coded cell clusters identified in using single cell sequencing, split per tissue (CSF and mELT) and per treatment (aCD20 treated mice and control treated mice).
Figure 3
Figure 3
Cell numbers in CSF from control treated mice vs. mELT in control treated mice are similar. The percentage of the respective cell types is shown.
Figure 4
Figure 4
CSF from aCD20 treated mice has less B cells and naïve CD4+ T cells, but more macrophages than CSF from control treated mice. The percentage of the respective cell types is shown.
Figure 5
Figure 5
Heatmap representing differentially expressed genes (DEGs) between CSF from aCD20 treated and CSF from isotype treated mice for each cell type. Gene expression analysis was conducted only for cell counts >50. Thus, not all cell types are shown. The top 10 up- and downregulated genes are shown, ranked according to average log2 fold-change (avg_log 2FC). Positive avg_log 2FC represent upregulated genes in CSF from aCD20 treated mice, negative values correspond to downregulated genes.
Figure 6
Figure 6
Number of genes that exhibit upregulation or downregulation in aCD20 treated mice compared to control treated mice.
Figure 7
Figure 7
Heatmap representing differentially expressed genes (DEGs) between mELT from control treated and CSF from control treated mice for each cell type. Gene analysis was conducted only for cell counts >50. Thus, not all cell types are shown. The top 10 up- and downregulated genes in mELT from control treated mice when compared to CSF from control treated mice are shown. Genes were ranked according to average log2 fold-change (avg_log 2FC). Positive avg_log 2FC represent upregulated genes in mELT from control treated mice (green), negative values correspond to downregulated genes (blue).
Figure 8
Figure 8
Number of genes that exhibit upregulation or downregulation in mELT in comparison to their expression levels in CSF.
Figure 9
Figure 9
Functional enrichment analysis for genes differentially expressed between CSF from aCD20 treated mice and CSF from control treated mice using Metascape. The top 5 GO-terms are shown (For Tregs, only four pathways were significant). For similar gene ontology (GO) terms, only the top-ranked GO term was shown. The dot size reflects the number of genes enriched in the GO term and its color the corresponding statistical significance (p-value). Rich factor is the ratio of differentially expressed gene numbers annotated in this GO-term to all gene numbers annotated in this GO term.
Figure 10
Figure 10
Functional enrichment analysis for genes differentially expressed between mELT from control treated mice and CSF from control treated mice using Metascape. The top 5 GO-terms are shown. For similar gene ontology (GO) terms, only the top-ranked GO term was shown. The dot size reflects the number of genes enriched in the GO term and its color the corresponding statistical significance (p-value). Rich factor is the ratio of differentially expressed gene numbers annotated in this GO term to all gene numbers annotated in this GO term.

References

    1. Hauser SL, Waubant E, Arnold DL, Vollmer T, Antel J, Fox RJ, et al. . B-cell depletion with rituximab in relapsing-remitting multiple sclerosis. N Engl J Med. (2008) 358:676–88. doi: 10.1056/NEJMoa0706383 - DOI - PubMed
    1. Hauser SL, Bar-Or A, Comi G, Giovannoni G, Hartung HP, Hemmer B, et al. . Ocrelizumab versus interferon beta-1a in relapsing multiple sclerosis. N Engl J Med. (2017) 376:221–34. doi: 10.1056/NEJMoa1601277 - DOI - PubMed
    1. Kappos L, Wolinsky JS, Giovannoni G, Arnold DL, Wang Q, Bernasconi C, et al. . Contribution of relapse-independent progression vs relapse-associated worsening to overall confirmed disability accumulation in typical relapsing multiple sclerosis in a pooled analysis of 2 randomized clinical trials. JAMA Neurol. (2020) 77:1132–40. doi: 10.1001/jamaneurol.2020.1568 - DOI - PMC - PubMed
    1. Montalban X, Hauser SL, Kappos L, Arnold DL, Bar-Or A, Comi G, et al. . Ocrelizumab versus placebo in primary progressive multiple sclerosis. N Engl J Med. (2017) 376:209–20. doi: 10.1056/NEJMoa1606468 - DOI - PubMed
    1. Serafini B, Rosicarelli B, Magliozzi R, Stigliano E, Aloisi F. Detection of ectopic B-cell follicles with germinal centers in the meninges of patients with secondary progressive multiple sclerosis. Brain Pathol. (2004) 14:164–74. doi: 10.1111/j.1750-3639.2004.tb00049.x - DOI - PMC - PubMed

MeSH terms