. 2024 May 31:26:101103.
doi: 10.1016/j.mtbio.2024.101103. eCollection 2024 Jun.

Olea europaea leaf exosome-like nanovesicles encapsulated in a hyaluronic acid / tannic acid hydrogel dressing with dual "defense-repair" effects for treating skin photoaging

Affiliations

Olea europaea leaf exosome-like nanovesicles encapsulated in a hyaluronic acid / tannic acid hydrogel dressing with dual "defense-repair" effects for treating skin photoaging

Zhenzhen Wang et al. Mater Today Bio. .

Abstract

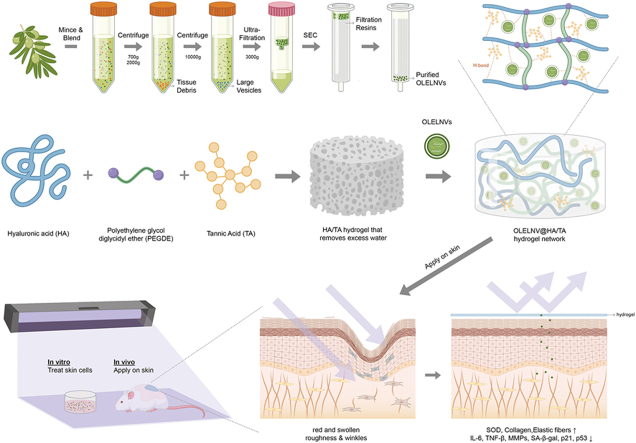
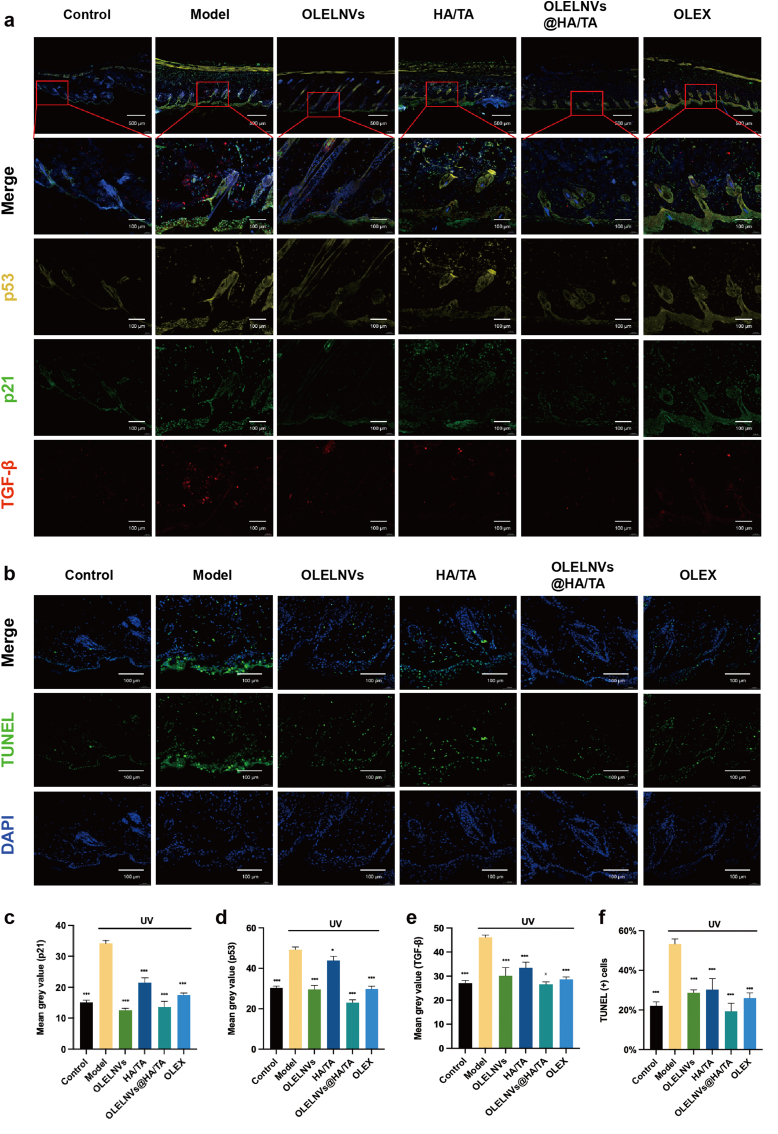
Photoaging, primarily caused by ultraviolet (UV) light, is the major factor in extrinsic skin aging. Existing anti-photoaging strategies mainly focus on early sun protection or repairing damaged skin, lacking a comprehensive treatment strategy. Therefore, this study developed a dressing that actively shields against UV radiation and repairs photoaged skin, offering double protection. This study utilized exosome-like nanovesicles derived from Olea europaea leaves (OLELNVs), enhancing them into a potent core biomaterial with high-dose effects and skin-friendly, non-cytotoxic inhibition of cell aging. These nanovesicles were incorporated into a cross-linked hyaluronic acid (HA) and tannic acid (TA) hydrogel with strong UV-absorbing properties, creating the OLELNVs@HA/TA hydrogel system. In vitro and in vivo experiments demonstrated that OLELNVs@HA/TA hydrogel can effectively reduce UV-induced skin damage and promote skin repair and regeneration. Additionally, RNA-seq and clustering analysis of miR168a-5p predicted targets revealed significant down-regulation of the NF-κB signaling pathway, mediating inflammatory aging responses. Overall, the OLELNVs@HA/TA hydrogel represents a novel dual-strategy approach for clinical application in combating photoaging.

Keywords: Exosome-like nanovesicles; Extracellular vesicles; Hyaluronic acid hydrogel; Photoaging; Skin regeneration; UV shielding.


Conflict of interest statement

The authors declare that they have no known competing financial interests or personal relationships that could have appeared to influence the work reported in this paper.

Figures

Image 1
Graphical abstract
Fig. 1
Fig. 1
Preparation and characterization of OLELNVs. (a) Flow chart illustrating the isolation of OLELNVs by ultrafiltration and size exclusion chromatography. (b) The average size of OLELNVs characterized by Zetaview analysis. (c) Representative TEM image of purified OLELNVs. Scale bars = 100 nm, 500 nm & 1000 nm. (d) Zeta potential of OLELNVs. (e) Tracing the uptake of OLELNVs by HaCaT cells. OLELNVs were labeled with PKH-67 (green) and HaCaT cell nuclei were labeled with DAPI (blue). Scale bar = 20 μm, 5 μm. (For interpretation of the references to colour in this figure legend, the reader is referred to the Web version of this article.)
Fig. 2
Fig. 2
Enhanced safety and efficacy of OLELNVs compared to OLEX. (a) The effect of OLELNVs and OLEX on HaCaT cell proliferation by CCK8 assay. (b, c) The effect of OLELNVs and OLEX on the wound healing of HaCaT cells, and the wound healing rates of each group after 12 and 24 h. Scale bar = 50 μm, n = 3. (d, e) The activity of OLELNVs and OLEX in scavenging ABTS free radicals, n = 3. (f) Schematic representation of the penetration of PELNVs through different pathways in the skin. (g, h) The penetration effect of OLELNVs and OLEX in skin slices with topical application; OLEX labeled with DNS (blue) and OLELNVs with Dil (red). Scale bar = 100 μm, n = 3. Data are expressed as mean ± SD (*P<0.05, NS: not significant). (For interpretation of the references to colour in this figure legend, the reader is referred to the Web version of this article.)
Fig. 3
Fig. 3
Inhibition of UV-induced cellular aging by OLELNVs. (a, b) The effect of OLELNVs on the morphology of UVB-treated HaCaT and HDF-α cells. Model: UVB-treated. Scale bar = 40 μm, 20 μm, n = 3. (c, d) The effect of OLELNVs on the proliferation of UVB-treated HaCaT and HDF-α cells by CCK8 assay, n = 3. (e) Relative SOD enzyme activity, (f) relative Il-6 levels, (g, h) relative ROS levels in UVB-treated HaCaT cells. Scale bar = 100 μm. (i, j) Relative SA-β-gal positivity rates in UVB-treated HDF-α cells. Scale bar = 20 μm, n = 3. (k, l) The effect of OLELNVs on the expression of MMP-1, MMP-3 and COL-I protein in UV-treated HDF-α cells was tested by western blot, n = 3. Data are expressed as mean ± SD (*P<0.05, **P<0.01, ***P<0.001, NS: not significant).
Fig. 4
Fig. 4
Potential cross-kingdom regulatory activity of OLELNVs. (a) Top 9 most abundant miRNA families in OLELNVs and OL juice. (b) Top 10 most abundant miRNAs of OLELNVs. (c) The KEGG analysis results of human target genes predicted by miR168a-5p in OLELNVs. (d) The differentially expressed genes in OLELNVs-treated UVB-induced HaCaT cells compared with the UVB-induced cells. (e) The KEGG analysis results of differentially expressed genes in the OLELNVs-treated group after UVB radiation. (f) The Venn plot result of both enriched signaling pathways.
Fig. 5
Fig. 5
Preparation and characterization of HA/TA and OLELNVs@HA/TA hydrogels. (a) Schematic representation of the cross-linking process of hydrogels. (b) ATR-IR spectra of HA, TA and HA/TA. (c) Photograph of the sol-gel transition of HA/TA and OLELNVs@HA/TA hydrogels. (d) Rheological property of the formed HA/TA hydrogel at different TA concentrations (TA: 0 %, 0.01 %, 0.05 %, 0.5 %) in frequency sweep. (e) Rheological property of the formed OLELNVs@HA/TA (TA: 0.05 %) hydrogel in strain sweep. (f) SEM images of OLELNVs@HA/TA (TA: 0.05 %). Scale bar = 100 μm, 500 nm. (g) Schematic representation of OLELNVs@HA/TA in a Tranwell insert. (h) The cumulative release rate of OLELNVs was quantitatively measured using proteins. (mean ± SD, n = 3).
Fig. 6
Fig. 6
Enhanced stability of OLELNVs in HA/TA hydrogel. (a, b) PKH67‐labeled OLELNVs encapsulated in the HA/TA hydrogel remain in HaCaT cells for different periods. Scale bar = 20 μm, n = 3. OLELNVs were labeled with PKH67 (green) and HaCaT cell nuclei with DAPI (blue). (c, d) Dil-labeled OLELNVs and OLELNVs@HA/TA were applied to the dorsal skin of mice. Skin retention was imaged with IVIS before and after being sprayed with artificial sweat, n = 3. (e) Protein quantifications of OLELNVs preserved by different methods for different periods. n = 3 per group. (f) TEM images of OLELNVs preserved by different methods after 28 days. Scale bar = 200 nm. Data are expressed as mean ± SD (***P<0.001). (For interpretation of the references to colour in this figure legend, the reader is referred to the Web version of this article.)
Fig. 7
Fig. 7
Synergy of HA/TA hydrogel with OLELNVs in inhibiting cellular damage.(a) UV–vis absorption spectra at 330 nm of HA, OLELNVs@HA, HA/TA and OLELNVs@HA/TA in different ratios. (b) The effect of OLELNVs, HA, OLELNVs@HA, HA/TA and OLELNVs@HA/TA on the proliferation of HDF-α cells in UVB block and damage-repair models by CCK8 assay, n = 3. (c) Schematic representation of the UVB block model. (d, e) Cell viability/cytotoxicity of HDF-α cells in a UVB block model was measured with live and dead staining reagents. Scale bar = 100 μm, n = 3. (f) Schematic representation of the UVB damage-repair model. (g, h) Cell viability/cytotoxicity of HDF-α cells in the UVB damage-repair model was measured with live and dead staining reagents. Scale bar = 100 μm, n = 3. Data are expressed as mean ± SD (*P<0.05, **P<0.01, ***P<0.001, NS: not significant).
Fig. 8
Fig. 8
Synergy of HA/TA hydrogel with OLELNVs in inhibiting photoaging in mouse skin. (a) Schematic representation of the experimental setup. (b) Anatomical representation of the skin changes before and after treatment. (c) Representative photos of the dorsal skin of mice on day 1, 7, 14, 21 and 28 after the first treatment. Schematic representation of mice on day 28 after the first treatment. (d–f) Representative immunohistochemistry (IHC) images of the dorsal skin of mice after 4 weeks of treatment. Scale bar = 100 μm, n = 3. (g) Relative SOD activity and (h) relative IL-6 concentration of dorsal skin of mice after 4 weeks of treatment, n = 10. Data are expressed as mean ± SD (*P<0.05, **P<0.01, ***P<0.001, NS: not significant).
Fig. 9
Fig. 9
Pathological analysis of mouse skin tissue. (a) Representative images of H&E staining and (b) Masson staining of mice after 4 weeks of treatment. Scale bar in full view = 500 μm. Scale bar in magnified partial view = 100 μm. (c) Representative images of Weigert staining of mice after 4 weeks of treatment. Scale bar in full view = 200 μm. Scale bar in magnified partial view = 100 μm. (d–f) Statistical data on epidermal thickness (n = 10), collagen content (n = 4) and number of elastic fibers (n = 3) of the dorsal skin tissue of mice.
Fig. 10
Fig. 10
Immunofluorescence (IF) staining analysis of mouse skin tissue. (a) Representative images of IF in the dorsal skin of mice labeled for p53 (yellow), p21 (green), TGF-β (red) and DAPI (blue) after 4 weeks of treatment. Scale bar in full view = 500 μm. Scale bar in magnified partial view = 100 μm. (b) Representative images of IF in the dorsal skin of mice labeled for TUNEL (green) and DAPI (blue) after 4 weeks of treatment. Scale bar in full view = 500 μm. Scale bar in magnified partial view = 100 μm. (c–f) Statistical data on the mean gray value of p53, p21, TGF-β and TUNEL positive cell rate (n = 3) of the dorsal skin tissue of mice. Data are expressed as mean ± SD (*P<0.05, ***P<0.001). (For interpretation of the references to colour in this figure legend, the reader is referred to the Web version of this article.)

References

    1. Fisher G.J., Kang S., Varani J., Bata-Csorgo Z., Wan Y., Datta S.C., Voorhees J.J. Mechanisms of photoaging and chronological skin aging. Arch. Dermatol. 2002;138:1462. doi: 10.1001/archderm.138.11.1462. - DOI - PubMed
    1. Coppé J., Desprez P., Krtolica A., Campisi J. The Senescence-Associated secretory phenotype: the dark side of tumor suppression. Ann. Rev. Pathol. 2010;5:99–118. doi: 10.1146/annurev-pathol-121808-102144. - DOI - PMC - PubMed
    1. Fitsiou E., Pulido T., Campisi J., Alimirah F., Demaria M. Cellular senescence and the Senescence-Associated secretory phenotype as drivers of skin photoaging. J. Investig. Dermatol. 2021;141:1119–1126. doi: 10.1016/j.jid.2020.09.031. - DOI - PubMed
    1. Kligman L.H., Kligman A.M. The nature of photoaging: its prevention and repair. PubMed. 1986;3:215–227. https://pubmed.ncbi.nlm.nih.gov/3534809 - PubMed
    1. Kammeyer A., Luiten R.M. Oxidation events and skin aging. Ageing Res. Rev. 2015;21:16–29. doi: 10.1016/j.arr.2015.01.001. - DOI - PubMed

LinkOut - more resources